Computer Shop Management.docx
This document was uploaded by user and they confirmed that they have the permission to share it. If you are author or own the copyright of this book, please report to us by using this DMCA report form. Report DMCA
Overview
Download & View Computer Shop Management.docx as PDF for free.
More details
- Words: 8,187
- Pages: 34
Loading documents preview...
1.
Introduction
1.1
Introduction
A Computer Shop Management System (CSMS) is a computer system typically used to manage the sales in retail stores. It includes hardware components such as a computer, a bar code scanner, a printer and also software to manage the operation of the store. The most basic function of a CSMS system is to handle sales. When a customer arrives at a Computer Shop counter with goods to purchase, the cashier will start a new sale transaction. When the barcode of a good is read by the CSMS system, it will retrieve the name and price of this good from the backend catalog system and interact with inventory system to deduce the stock amount of this good. When the sale transaction is over, the customer can pay in cash, credit card or even check. After the payment is successful, a receipt will be printed.
1.2
Problem Statement
Shop is still doing work manually. They need a system that will computerize all the records. The purpose of this project is to provide an easy shopping facility and easy selling facility to the merchants of all categories. Today maximum business is working on paper work or desktop base by using Microsoft access worksheet. At present there is a hard time. it’s very hard to do maintain or run any business. This is developing century everyone is running towards the developing sides and gaining new inventions and innovations. Current system has many problems. In this section we discuss those problems.
All the works are carried out with pen and paper. Sometime stock information will be not typed accurately Sometime user cannot get the proper information about the product. Buyers cannot place the order easily. This system is not efficient and take long time.
Some other problems are Lack of immediate retrievals: the information is very difficult to retrieve and to find a particular information. Lack of immediate information storage: the information generated by various transactions take time and efforts to be stored at right place. Lack of prompt updating: various changes to the information like cost and other information is difficult. Error prone manual calculation: manual calculations are error prone and take a lot of time. This may result in incorrect information.
1.3
Reasons and Motivations
After know the problems above it eager me to solve those problems and make a system which will not have those problems and will be very simple and basic.
Following will be the benefits of computer shop, if this software is implemented in the system:
No misinterpretation of product name. Efficient system. Fewer paper work. Less forms to fill. Ease in finding the relevant task and class. Accessing mails faster. Secure.
That is the reason I have undertaken this project for more immediate replies to the customers and provide ease to the salesman as well. This system is designed to help administrator/owner to view the information of stock, sail/purchase accurately and sequent. The proper information is provided to the customer.
1.4
Aims and Objective
Following are the objectives of the canteen management system
To boost up the Process of sales and purchase To Decrease time consumption To Ease the Vendors To replace the paper work thing This project will manage large amount of data in short time. No data redundancy. To reduce the time consuming
The aim of our project is to make the entire system efficient and user friendly to the product manager and administrator.
To promote the shopping market in Pakistan To make more products available to the customer To promote shops Searching will be easy and quicker. Paper work will be reduced. Avoid from wastage of time and effort. Manage large amount of data with efficiency and accuracy. Security of data is high. Easy to view product details. Fewer complexes. Searching is easy. User friendly To increase the flexibility of the administrator, agents and buyers. Making the system faster than the present system. To facilitate the administrator so that he can easily access product information from anywhere. To reduce complexity of selling and purchasing. Immediate storage of information Easy to operate Immediate retrieval of information No redundancy
1.5
Accuracy Reliability
Scope of Project
The problem is to develop and design the software to handle the computers and company details and generate the report of that particular computer and company. The lack of coordination among these modules must be solved first. There also exist problem in data handling as it very huge data, loss of data, data redundancy and complex manipulation of data.
1.6
SDLC Models
Software development life cycle (SDLC) is a series of phases that provide a common understanding of the software building process. How the software will be realized and developed from the business understanding and requirements elicitation phase to convert these business ideas and requirements into functions and features until its usage and operation to achieve the business needs. The good software engineer should have enough knowledge on how to choose the SDLC model based on the project context and the business requirements. Types of Software developing life cycles (SDLC)
Waterfall Model V-Shaped Model Evolutionary Prototyping Model Rad Model Spiral Method (SDM) Iterative and Incremental Method Agile development
Waterfall Model The Waterfall Model is a linear sequential flow. In which progress is seen as flowing steadily downwards (like a waterfall) through the phases of software implementation. This means that any phase in the development process begins only if the previous phase is complete. The waterfall approach does not define the process to go back to the previous phase to handle changes in requirement. The waterfall approach is the earliest approach and most widely known that was used for software development. V-Shaped Model It is an extension of the waterfall model, Instead of moving down in a linear way, the process steps are bent upwards after the implementation and coding phase, to form the typical V shape. The major difference between the V-shaped model and waterfall model is the early test planning in the V-shaped model. Evolutionary Prototyping Model It refers to the activity of creating prototypes of software applications, for example, incomplete versions of the software program being developed. It is an activity that can occur in software development and It used to visualize some component of the software to limit the gap of misunderstanding the customer requirements by the development team. This also will reduce the iterations may occur in the waterfall approach and hard to be implemented due to the inflexibility of the waterfall approach. So, when the final prototype is developed, the requirement is considered to be frozen.
Spiral Model It is combining elements of both design and prototyping-in-stages, in an effort to combine advantages of top-down and bottom-up concepts. This model of development combines the features of the prototyping model and the waterfall model. The spiral model is favored for large, expensive, and complicated projects. This model uses many of the same phases as the waterfall model, in essentially the same order, separated by planning, risk assessment, and the building of prototypes and simulations. Agile Model It is based on iterative and incremental development, where requirements and solutions evolve through collaboration between cross-functional teams. Iterative and Incremental Model It is developed to overcome the weaknesses of the waterfall model. It starts with an initial planning and ends with deployment with the cyclic interactions in between. The basic idea behind this method is to develop a system through repeated cycles (iterative) and in smaller portions at a time (incremental), allowing software developers to take advantage of what was learned during the development of earlier parts or versions of the system. It can consist of mini waterfalls or mini V-Shaped model RAD Model RAD model is Rapid Application Development model. It is a type of incremental model. In RAD model the components or functions are developed in parallel as if they were mini projects. The developments are time boxed, delivered and then assembled into a working prototype.
1.7
SDLC Model Chosen
Since I will be working on Visual Studio so that RAD Model will suite me the best
1.8
Procedure
User will first login. He can then choose what he wants to do from menu like
Manage Categories Manage Products Manage Sales and Customers Manage Purchases and Vendor Manage Returns of Sales and Purchases View and Print Various Reports like Income Statement Generate Bills
2.
Literature Review and Analysis
2.1
Background of Research
After choosing a topic, you will need to locate introductory sources that give basic background information about the subject. Finding background information at the beginning of your research is especially important if you are unfamiliar with the subject area or not sure from what angle to approach your topic. To collect the information, I have searched and visited few existing systems. Then find what flaws were there within them. Had meeting with my teachers. Watch demos and video about mail system. Background research is also important to help you understand the theory behind your experiment. In other words, science fair judges like to see that you understand why your experiment turns out the way it does
2.2
Literature Review
Computer Shop Management System plays a great role in simplifying the job of employees at the Computer Shop Management System and satisfying the need of customers and stakeholders of the canteen management system. Even though no documentation is found in Ethiopia to be reviewed, products have been observed at some canteen management systems to help understand the problem of managing canteen management systems and handling canteen management system data. This chapter reviews these products This project work tries to fill the gap by automating the various activities at computer shop management systems. It tries to satisfy customers need and simplify the works of administrators, record officer and supplier. With a computer shop management system
2.3
Existing Systems
2.3.1 Existing System I
Problem is that this system doesn’t work on Windows 10 and it doesn’t have advance reports and purchases return module.
2.3.2 Existing System II
This is very old and run only on windows 2000 and its ui not easy to understand and many modules are missing. 2.3.3 Existing System III
This system just has basic reports and don’t have module for purchase return.
2.4
Proposed System
The Computer-shop Management System is the new, self-contained product. The Computershop management system is using C# platform. All components follow 3 Tier Architecture pattern. The user can retrieve information of their shop progress. All pages of the system are following a consistent theme and clear structure. The occurrence of errors should be minimized through the use of checkboxes and scroll down in order to reduce the amount of text input from user. Error message should be located beside the error input which clearly highlight and tell user how to solve it. If system error, it should provide the contact methods. The
page should display the project process in different color to clearly reflect the various states. Each level of user will have its own interface and privilege to manage and modify the project information. User interface elements are easy to understand. Part of user interface is wellorganized on screen and the parts are concatenated right. When users look at the interface, they understand which pane is used for which purpose. Each task of an interface is specified clearly and users use them correctly. For example, when users press to any button on interface, they can know which operations are done by pressing this button.
2.5
Comparison
Existing systems Old and Unfriendly Interface Workflow was not fluid No Purchases Return No Advance Reporting Difficult Backup and Recovery No Authentication Hard to Operate
2.6
Proposed system Friendly and Eye Catching Interface Workflow is fluid Has Purchases Returns Has Advance Reporting One Click Backup and Recovery Secure Authentication Easy to Operate
Feasibility Report
The feasibility study is the important step in any software development process. This is because it makes analysis of different aspects like cost required for developing and executing the system, the time required for each phase of the system and so on. If these important factors are not analyzed then definitely it would have impact on the organization and the development and the system would be a total failure. So, for running the project and the organization successfully this step is a very important step in a software development life cycle process. By making analysis this way it would be possible to make a report of identified area of problem. By making a detailed analysis in this area a detailed document or report is prepared in this phase which has details like project plan or schedule of the project, the cost estimated for developing and executing the system, target dates for each phase of delivery of system developed and so on. This phase is the base of software development process since further steps taken in software development life cycle would be based on the analysis made on this phase and so careful analysis has to be made in this phase. The feasibility study that was done for this project included the following considerations – Economic Feasibility This is a very important aspect to be considered while developing a project. We decided the technology based on minimum possible cost factor. All hardware and software cost have to be borne by the organization. We analyzed the existing system and concluded that the existing systems with the organization only needed to be updated to newer configuration instead of going for new hardware setups. Overall, we have estimated that the benefits the organization is going to receive from the proposed system will surely overcome the initial costs and the later on running cost for system. Technical Feasibility This included the study of function, performance and constraints that may affect the ability to achieve an acceptable system. or this feasibility study, we studied complete functionality to be provided in the system, as described in the System Requirement Specification (SRS), and checked if everything was possible using C# and SQL Server. After the study we came to
conclusion that we can proceed further with the tools and development environment chosen by us. This was important in our case as we were working on two various phases of the department that will need to be integrated in future to make an extended system. Operation Feasibility No doubt the proposed system is fully GUI based that is very user friendly and all inputs to be taken all self-explanatory even to a layman. Besides, a proper training has been conducted to let know the essence of the system to the users so that they feel comfortable with new system. As far our study is concerned the clients are comfortable and happy as the system has cut down their loads and doing all the complex activities itself. Resource Feasibility This is also an important check to be done that the required resources will be available or not. As far as Software and hardware were considered, there was no such constraint using C# and SQL Server as Front-end and Back-end respectively.
2.7
Statement of Work
A statement of work (SoW) is a document routinely employed in the field of project management. It defines project-specific activities, deliverables and timelines for a vendor providing services to the client. The SOW typically also includes detailed requirements and pricing, with standard regulatory and governance terms and conditions. ORGANIZATION NAME CONTACT ADDRESS PROJECT NAME BRAND PRODUCT BEGIN DATE END DATE DURATION ASSUMPTIONS
GOALS OBJECTIVE SCOPE DELIVERABLES PAYMENTS ADVANCE MID TOTAL COST
2.8
Gantt Chart
A Gantt chart is a type of bar chart that illustrates a project schedule, named after its inventor, Henry Gantt (1861–1919), who designed such a chart around the years 1910– 1915. Modern Gantt charts also show the dependency relationships between activities and current schedule status. A Gantt chart, commonly used in project management, is one of the most popular and useful ways of showing activities (tasks or events) displayed against time. On the left of the chart is a list of the activities and along the top is a suitable time scale. Each activity is represented by a bar; the position and length of the bar reflects the start date, duration and end date of the activity.
3.
System Design
3.1
Introduction
Systems design is the process of defining the architecture, modules, interfaces, and data for a system to satisfy specified requirements. Systems design could be seen as the application of systems theory to product development. There is some overlap with the disciplines of systems analysis, systems architecture and systems engineering.
3.2
Data Flow Diagram
A two-dimensional diagram that explains how data is processed and transferred in a system. The graphical depiction identifies each source of data and how it interacts with other data sources to reach a common output. Individuals seeking to draft a data flow diagram must (1) identify external inputs and outputs, (2) determine how the inputs and outputs relate to each other, and (3) explain with graphics how these connections relate and what they result in. This type of diagram helps business development and design teams visualize how data is processed and identify or improve certain aspects. A data flow diagram (DFD) illustrates how data is processed by a system in terms of inputs and outputs. As its name indicates its focus is on the flow of information, where data comes from, where it goes and how it gets stored. DFD graphically representing the functions, or processes, which capture, manipulate, store, and distribute data between a system and its environment and between components of a system. The visual representation makes it a good communication tool between User and System designer. Structure of DFD allows starting from a broad overview and expand it to a hierarchy of detailed diagrams. DFD has often been used due to the following reasons: Logical information flow of the system Determination of physical system construction requirements Simplicity of notation Establishment of manual and automated systems requirements There are four basic symbols that are used to represent a data-flow diagram. Process A process receives input data and produces output with a different content or form. Processes can be as simple as collecting input data and saving in the database, or it can be complex as producing a report containing monthly sales of all retail stores in the northwest region. Data Flow A data-flow is a path for data to move from one part of the information system to another. A data-flow may represent a single data element such the Customer ID or it can represent a set of data element (or a data structure). Data Store A data store or data repository is used in a data-flow diagram to represent a situation when the system must retain data because one or more processes need to use the stored data in a later time. External Entity An external entity is a person, department, outside organization, or other information system that provides data to the system or receives outputs from the system. External entities are components outside of the boundaries of the information systems.
3.2.1 Context DFD A context diagram is a top level (also known as "Level 0") data flow diagram. It only contains one process node ("Process 0") that generalizes the function of the entire system in relationship to external entities.
This is simple Level 0 DFD with only one process 3.2.2 Level 1 DFD A level 1 data flow diagram (DFD) is more detailed than a level 0 DFD but not as detailed as a level 2 DFD. It breaks down the main processes into subprocesses that can then be analyzed and improved on a more intimate level.
A more detailed DFD of Computer Shop System
3.3
Use Case Diagram
UML Use Case Diagrams. Use case diagrams are usually referred to as behavior diagrams used to describe a set of actions (use cases) that some system or systems (subject) should or can perform in collaboration with one or more external users of the system (actors). A use case diagram contains four components.
3.4
The boundary, which defines the system of interest in relation to the world around it. The actors, usually individuals involved with the system defined according to their roles. The use cases, which are the specific roles played by the actors within and around the system. The relationships between and among the actors and the use cases.
Sequence Diagram
In software engineering, a class diagram in the Unified Modeling Language (UML) is a type of static structure diagram that describes the structure of a system by showing the system's classes, their attributes, operations (or methods), and the relationships among objects. The class diagram is the main building block of object-oriented modelling. It is used both for general conceptual modelling of the systematics of the application, and for detailed modelling translating the models into programming code. Class diagrams can also be used for data modeling. The classes in a class diagram represent both the main elements, interactions in the application, and the classes to be programmed. In the diagram, classes are represented with boxes that contain three compartments: The top compartment contains the name of the class. It is printed in bold and centered, and the first letter is capitalized. The middle compartment contains the attributes of the class. They are left-aligned and the first letter is lowercase. The bottom compartment contains the operations the class can execute. They are also leftaligned and the first letter is lowercase.
In the design of a system, a number of classes are identified and grouped together in a class diagram that helps to determine the static relations between them. With detailed modelling, the classes of the conceptual design are often split into a number of subclasses. In order to further describe the behavior of systems, these class diagrams can be complemented by a state diagram or UML state machine.
3.5
Class Diagram
In software engineering, a class diagram in the Unified Modeling Language (UML) is a type of static structure diagram that describes the structure of a system by showing the system's classes, their attributes, operations (or methods), and the relationships among objects. The class diagram is the main building block of object-oriented modelling. It is used both for general conceptual modelling of the systematics of the application, and for detailed modelling translating the models into programming code. Class diagrams can also be used for data modeling. The classes in a class diagram represent both the main elements, interactions in the application, and the classes to be programmed.
In the diagram, classes are represented with boxes that contain three compartments: The top compartment contains the name of the class. It is printed in bold and centered, and the first letter is capitalized. The middle compartment contains the attributes of the class. They are left-aligned and the first letter is lowercase. The bottom compartment contains the operations the class can execute. They are also leftaligned and the first letter is lowercase. In the design of a system, a number of classes are identified and grouped together in a class diagram that helps to determine the static relations between them. With detailed modelling, the classes of the conceptual design are often split into a number of subclasses. In order to further describe the behavior of systems, these class diagrams can be complemented by a state diagram or UML state machine.
3.6
ER Diagram
An entity-relationship diagram (ERD) is a graphical representation of an information system that shows the relationship between people, objects, places, concepts or events within that system. An ERD is a data modeling technique that can help define business processes and can be used as the foundation for a relational database.
While useful for organizing data that can be represented by a relational structure, an entityrelationship diagram can't sufficiently represent semi-structured or unstructured data, and an ERD is unlikely to be helpful on its own in integrating data into a pre-existing information system. Three main components of an ERD are the entities, which are objects or concepts that can have data stored about them, the relationship between those entities, and the cardinality, which defines that relationship in terms of numbers. For example, an ER diagram representing the information system for a company's sales department might start with graphical representations of entities such as the sales representative, the customer, the customer's address, the customer's order, the product and the warehouse. (See diagram) Then lines or other symbols can be used to represent the relationship between entities, and text can be used to label the relationships. Finally, cardinality notations define the attributes of the relationship between the entities. Cardinalities can denote that an entity is optional (for example, a sales rep could have no customers or could have many) or mandatory (for example, the must be at least one product listed in an order.) Relationships: A relationship, in the context of databases, is a situation that exists between two relational database tables when one table has a foreign key that references the primary key of the other table. Relationships allow relational databases to split and store data in different tables, while linking disparate data items. Cardinality and ordinality, respectively, refer to the maximum number of times an instance in one entity can be associated with instances in the related entity, and the minimum number of times an instance in one entity can be associated with an instance in the related entity. Cardinality and ordinality are When it comes to notation, data modelers have many options to choose from. While crow's foot notation is widely accepted as the most intuitive style, some developers use OMT, IDEF, Bachman, or UML notation to indicate cardinality. Since crow's foot notation shows both minimum and maximum cardinality in an easy-to-read graphic format. The three main cardinal relationships are: One-to-one (1:1). For example, if each customer in a database is associated with one mailing address. One-to-many (1:M). For example, a single customer might place an order for multiple products. The customer is associated with multiple entities, but all those entities have a single connection back to the same customer. Many-to-many (M:N). For example, at a company where all call center agents work with multiple customers, each agent is associated with multiple customers, and multiple customers might also be associated with multiple agents. While there are tools to help draw entity-relationship diagrams, such as CASE (computer-aided software engineering) tools, some relational database management systems also have design capabilities built in.
3.7
Database
3.7.1 Database Schema A database schema of a database system is its structure described in a formal language supported by the database management system (DBMS). The term "schema" refers to the organization of data as a blueprint of how the database is constructed (divided into database tables in the case of relational databases). The formal definition of a database schema is a set of formulas (sentences) called integrity constraints imposed on a database. These integrity constraints ensure compatibility between parts of the schema. All constraints are expressible in
the same language. A database can be considered a structure in realization of the database language. The states of a created conceptual schema are transformed into an explicit mapping, the database schema. This describes how real-world entities are modeled in the database. "A database schema specifies, based on the database administrator's knowledge of possible applications, the facts that can enter the database, or those of interest to the possible end-users." The notion of a database schema plays the same role as the notion of theory in predicate calculus. A model of this "theory" closely corresponds to a database, which can be seen at any instant of time as a mathematical object. Thus, a schema can contain formulas representing integrity constraints specifically for an application and the constraints specifically for a type of database, all expressed in the same database language. In a relational database, the schema defines the tables, fields, relationships, views, indexes, packages, procedures, functions, queues, triggers, types, sequences, materialized, views, synonyms, database links, directories, XML schema, and other elements. A database generally stores its schema in a data dictionary. Although a schema is defined in text database language, the term is often used to refer to a graphical depiction of the database structure. In other words, schema is the structure of the database that defines the objects in the database. Tables
Schema
3.8
Normalization
Database Normalization is a technique of organizing the data in the database. Normalization is a systematic approach of decomposing tables to eliminate data redundancy(repetition) and undesirable characteristics like Insertion, Update and Deletion Anamolies. It is a multi-step process that puts data into tabular form, removing duplicated data from the relation tables. Normalization is used for mainly two purposes, Eliminating reduntant(useless) data. Ensuring data dependencies make sense i.e data is logically stored. The inventor of the relational model Edgar Codd proposed the theory of normalization with the introduction of First Normal Form, and he continued to extend theory with Second and Third Normal Form. Later he joined with Raymond F. Boyce to develop the theory of Boyce-Codd Normal Form. Theory of Data Normalization in SQL is still being developed further. For example, there are discussions even on 6th Normal Form. However, in most practical applications, normalization
achieves its best in 3rd Normal Form. The evolution of Normalization theories is illustrated below-
3.8.1 Normalization Types with Examples Assume a video library maintains a database of movies rented out. Without any normalization, all information is stored in one table as shown below.
1NF (First Normal Form) Rules Each table cell should contain a single value. Each record needs to be unique. The above table in 1NF1NF Example
2NF (Second Normal Form) Rules Rule 1- Be in 1NF Rule 2- Single Column Primary Key It is clear that we can't move forward to make our simple database in 2nd Normalization form unless we partition the table above.
We have divided our 1NF table into two tables viz. Table 1 and Table2. Table 1 contains member information. Table 2 contains information on movies rented. We have introduced a new column called Membership_id which is the primary key for table 1. Records can be uniquely identified in Table 1 using membership id 3NF (Third Normal Form) Rules Rule 1- Be in 2NF Rule 2- Has no transitive functional dependencies To move our 2NF table into 3NF, we again need to again divide our table. 3NF Example
We have again divided our tables and created a new table which stores Salutations. There are no transitive functional dependencies, and hence our table is in 3NF In Table 3 Salutation ID is primary key, and in Table 1 Salutation ID is foreign to primary key in Table 3 Now our little example is at a level that cannot further be decomposed to attain higher forms of normalization. In fact, it is already in higher normalization forms. Separate efforts for moving into next levels of normalizing data are normally needed in complex databases. However, we will be discussing next levels of normalizations in brief in the following. Boyce-Codd Normal Form (BCNF) Even when a database is in 3rd Normal Form, still there would be anomalies resulted if it has more than one Candidate Key. Sometimes is BCNF is also referred as 3.5 Normal Form.
4NF (Fourth Normal Form) Rules If no database table instance contains two or more, independent and multivalued data describing the relevant entity, then it is in 4th Normal Form. 5NF (Fifth Normal Form) Rules A table is in 5th Normal Form only if it is in 4NF and it cannot be decomposed into any number of smaller tables without loss of data. 6NF (Sixth Normal Form) Proposed 6th Normal Form is not standardized, yet however, it is being discussed by database experts for some time. Hopefully, we would have a clear & standardized definition for 6th Normal Form in the near future...
4.
Development
4.1
Development Plan
I have used Rad Model for my development 4.1.1 Rad Model The RAD (Rapid Application Development) model is based on prototyping and iterative development with no specific planning involved. The process of writing the software itself involves the planning required for developing the product. Rapid Application Development focuses on gathering customer requirements through workshops or focus groups, early testing of the prototypes by the customer using iterative concept, reuse of the existing prototypes (components), continuous integration and rapid delivery. Rapid application development is a software development methodology that uses minimal planning in favor of rapid prototyping. A prototype is a working model that is functionally equivalent to a component of the product. In the RAD model, the functional modules are developed in parallel as prototypes and are integrated to make the complete product for faster product delivery. Since there is no detailed preplanning, it makes it easier to incorporate the changes within the development process. RAD projects follow iterative and incremental model and have small teams comprising of developers, domain experts, customer representatives and other IT resources working progressively on their component or prototype. The most important aspect for this model to be successful is to make sure that the prototypes developed are reusable. RAD model distributes the analysis, design, build and test phases into a series of short, iterative development cycles. Following are the various phases of the RAD Model – Business Modeling The business model for the product under development is designed in terms of flow of information and the distribution of information between various business channels. A complete business analysis is performed to find the vital information for business, how it can be obtained, how and when is the information processed and what are the factors driving successful flow of information. Data Modeling The information gathered in the Business Modeling phase is reviewed and analyzed to form sets of data objects vital for the business. The attributes of all data sets is identified and defined. The relation between these data objects are established and defined in detail in relevance to the business model. Process Modeling
The data object sets defined in the Data Modeling phase are converted to establish the business information flow needed to achieve specific business objectives as per the business model. The process model for any changes or enhancements to the data object sets is defined in this phase. Process descriptions for adding, deleting, retrieving or modifying a data object are given. The following illustration describes the RAD Model in detail.
RAD Model - Application RAD model can be applied successfully to the projects in which clear modularization is possible. If the project cannot be broken into modules, RAD may fail. The following pointers describe the typical scenarios where RAD can be used − RAD should be used only when a system can be modularized to be delivered in an incremental manner. It should be used if there is a high availability of designers for modeling. It should be used only if the budget permits use of automated code generating tools. RAD SDLC model should be chosen only if domain experts are available with relevant business knowledge. Should be used where the requirements change during the project and working prototypes are to be presented to customer in small iterations of 2-3 months. RAD Model - Pros and Cons RAD model enables rapid delivery as it reduces the overall development time due to the reusability of the components and parallel development. RAD works well only if high skilled engineers are available and the customer is also committed to achieve the targeted prototype in the given time frame. If there is commitment lacking on either side the model may fail. The advantages of the RAD Model are as follows − Changing requirements can be accommodated. Progress can be measured. Iteration time can be short with use of powerful RAD tools. Productivity with fewer people in a short time. Reduced development time.
Increases reusability of components. Quick initial reviews occur. Encourages customer feedback. Integration from very beginning solves a lot of integration issues. The disadvantages of the RAD Model are as follows − Dependency on technically strong team members for identifying business requirements. Only system that can be modularized can be built using RAD. Requires highly skilled developers/designers. High dependency on modeling skills. Inapplicable to cheaper projects as cost of modeling and automated code generation is very high. Management complexity is more. Suitable for systems that are component based and scalable. Requires user involvement throughout the life cycle. Suitable for project requiring shorter development times.
4.1.2 Hardware Tools Processor: Core i3 2.80 GHz RAM: 8GB Harddisk: 500GB 4.1.3 Software Tools Following Tools are used for making this system Language: C Sharp or C# IDE: Visual Studio 2017: Framework: .Net Framework 4.5 Technology: Winform UI and Reporting Framework: DevExpress 18.1.4 Database: SQL SERVER 2012 DB IDE: DbForge for Sql Server 5.1 Drawing: Microsoft Visio 2016 Report Making: Microsoft Word 2016
4.2
Platform (Microsoft)
Microsoft Visual Studio is an integrated development environment (IDE) from Microsoft. It is used to develop computer programs, as well as websites, web apps, web services and mobile apps. Visual Studio uses Microsoft software development platforms such as Windows API, Windows Forms, Windows Presentation Foundation, Windows Store and Microsoft Silverlight. It can produce both native code and managed code.
4.3
Language (C Sharp)
C# is a general-purpose, multi-paradigm programming language encompassing strong typing, imperative, declarative, functional, generic, object-oriented (class-based), and component-oriented programming disciplines. C# is one of the programming languages designed for the Common Language Infrastructure. 4.3.1 Creating User Interface
User Interface were made using drag and drop facility beside this UI Framework DevExpress was used to create more good looking, professional and responsive design 4.3.2 Levels of Coding Coding was done by keeping in view the 3-tier architecture. Visual studio itself provide 2 tier it keeps drag and drop code separate from other logic. But in 3 tier we further divide that logic into business logic and database logic. 4.3.3 OOP Features like inheritance, encapsulation and other oop features were used by default. Every custom Form or Control is inheriting from the basic form or control provided by visual studio itself 4.3.4 Dialog Box Dialog Box are used to show exception, success and error alerts. A few examples are given below 4.3.5 Events Mouse and Keyboard events are used beside them dropdown change event, and data grid selection changed event are also used. 4.3.6 Error Handling Errors are handled very wisely so that the software should not close unexpectedly. Few examples are given below. 4.3.7 Forms and Controls I have created following custom forms and controls 4.3.8 Why I choose C# I have chosen c# because it is very easy to create desktop application with it and criteria to create a computer shop management system was fulfilled by c#. and hardware work like printing was also added very easily.
5.
Deployment
5.1
Implementation
A product software implementation method is a blueprint to get users and/or organizations running with a specific software product. The method is a set of rules and views to cope with the most common issues that occur when implementing a software product: business alignment from the organizational view and acceptance from human view. The implementation of product software, as the final link in the deployment chain of software production, is in a financial perspective of a major issue. It is stated that the implementation of (product) software consumes up to 1/3 of the budget of a software purchase (more than hardware and software requirements together). When the main point of the computer study program is to implement counter measures to bots and bugs. 5.1.1 Location The software was implemented at Computer World 5.1.2 Hardware I told them to buy: Processor: Core 2 Dou 2.4 Ghz Ram: 2Gb HDD: 160Gb
5.2
Configuration
I installed sql server on their system. Made the installer of the software with automatic database connection setting. And database creation and table creation and insert one record for admin user in admin table for login
5.3
Testing
5.3.1 Purpose Software testing enables making objective assessments regarding the degree of conformance of the system to stated requirements and specifications. Testing verifies that the system meets the different requirements including, functional, performance, reliability, security, usability and so on. This verification is done to ensure that we are building the system right. In addition, testing validates that the system being developed is what the user needs. In essence, validation is performed to ensure that we are building the right system. Apart from helping make decisions, the information from software testing helps with risk management. Software testing contributes to improving the quality of the product. You would notice that we have not mentioned anything about defects/bugs up until now. 5.3.2 Unit Testing Testing performed on each module or block of code during development. Unit Testing is normally done by the programmer who writes the code.
5.3.3 Integration testing Testing done before, during and after integration of a new module into the main software package. This involves testing of each individual code module. One piece of software can contain several modules which are often created by several different programmers. It is crucial to test each module's effect on the entire program model. 5.3.4 System testing Testing done by a professional testing agent on the completed software product before it is introduced to the market. 5.3.5 Acceptance testing Beta testing of the product done by the actual end users.
5.4
Test Cases
1. Test case: Admin Login Test case: Login Priority(H,L): High Test objective: Verifying login Test descriptions: “user enter the required field, press login button”, client program contact to the server, server contact with database, database update the result and send the results to the user. Requirements verified: Yes Test environment: Person must have the software Test setup/ pre-condition: Software must be opened and user must be logged out Location Expected result The user will login to access application
Pass: Yes Problem /issues: NIL Status: Successfully Executed
“Login successfully”. Display main menu.
Condition: Pass
Fail: No
2. Test case: Computer Insert Test case: Add New Computer Item Priority(H,L): High Test objective: To Insert New Computer in the system Test descriptions: “user enter the required field, press save button”, client program contact to the server, server contact with database, database update the result and send the results to the user. Requirements verified: Yes Test environment: Person must be logged in Test setup/ pre-condition: Person should be in Manage Item Page Location Expected result Computer will be added to the system
Pass: Yes Problem /issues: NIL Status: Successfully Executed
“Item added successfully”. Clear the fields.
Condition: Pass
Fail: No
3. Test case: Category Insert Test case: Add New Computer Category Priority(H,L): High Test objective: To Insert New Computer Category in the system Test descriptions: “user enter the required field, press save button”, client program contact to the server, server contact with database, database update the result and send the results to the user. Requirements verified: Yes Test environment: Person must be logged in
Test setup/ pre-condition: Person should be in Manage Item Page and category dialog must be opened Location Expected result Category will be added to the system
Pass: Yes Problem /issues: NIL Status: Successfully Executed
“Category added successfully”. Clear the fields.
Condition: Pass
Fail: No
4. Test case: Adjust Price Test case: Adjusting Price of all items Priority(H,L): High Test objective: Adjust Price according to operation Test descriptions: User will select the operation and then select the value click calculate it will update the price fields for all items and user will then click save to update the database Requirements verified: Yes Test environment: Person must be logged in Test setup/ pre-condition: Person must be in adjust price page Location Expected result Price will be adjusted for all products
Pass: Yes Problem /issues: NIL Status: Successfully Executed
“Updated successfully”. Refresh the Grid
Condition: Pass
Fail: No
5. Test case: Adjust Stock Test case: Adjust Stock of Item Priority(H,L): High Test objective: Adjust Stock after the year end. Test descriptions: Increase or Decrease the New Stock and Click Save. Data will be updated in the database Requirements verified: Yes Test environment: Software must be logged in Test setup/ pre-condition: Person must be in adjust stock page Location Expected result “Updated successfully”. Refresh the Grid
Stock will be updated
Pass: Yes Problem /issues: NIL Status: Successfully Executed
Condition: Pass
Fail: No
6. Test case: Supplier Insert Test case: Add New Supplier Priority(H,L): High Test objective: To Insert New Supplier in the system Test descriptions: “user enter the required field, press save button”, client program contact to the server, server contact with database, database update the result and send the results to the user. Requirements verified: Yes Test environment: Person must be logged in Test setup/ pre-condition: Person should be in Manage Supplier Page Location Expected result Supplier will be added to the system
Pass: Yes Problem /issues: NIL Status: Successfully Executed
“Supplier added successfully”. Clear the fields.
Condition: Pass
Fail: No
7. Test case: Customer Insert Test case: Add New Customer Priority(H,L): High Test objective: To Insert New Customer in the system Test descriptions: “user enter the required field, press save button”, client program contact to the server, server contact with database, database update the result and send the results to the user. Requirements verified: Yes Test environment: Person must be logged in Test setup/ pre-condition: Person should be in Manage Customer Location Expected result Customer will be added to the system
Pass: Yes Problem /issues: NIL Status: Successfully Executed
“Customer added successfully”. Clear the fields.
Condition: Pass
Fail: No
8. Test case: Supplier Payment Test case: Add Supplier Payment Priority(H,L): High Test objective: To Add Supplier Payment Transaction Test descriptions: User select supplier. Open its payment dialog form. enter the required field, press save button, client program contacts to the server, server contact with database, database update the result and send the results to the user. Requirements verified: Yes Test environment: Person must be logged in Test setup/ pre-condition: Person should be in Manage Supplier Page Location Expected result Payment will be added to the system
Pass: Yes Problem /issues: NIL Status: Successfully Executed
“Supplier payment added successfully”. Clear the fields.
Condition: Pass
Fail: No
9. Test case: Purchase Test case: Insert Purchase Priority(H,L): High Test objective: To Insert Purchase in the System Test descriptions: User select supplier. Add Items in the cart. Fill payment fields, press save button, client program contacts to the server, server contact with database, database update the result and send the results to the user. Requirements verified: Yes Test environment: Person must be logged in Test setup/ pre-condition: Person should be in Purchase Page Location Expected result Purchase will be added to the system
Pass: Yes Problem /issues: NIL Status: Successfully Executed
“Purchase made successfully”. Clear the fields.
Condition: Pass
Fail: No
10. Test case: Sale Test case: Insert Sale Priority(H,L): High Test objective: To Insert Sale in the System Test descriptions: User select customer. Add Items in the cart. Fill payment fields, press save button, client program contacts to the server, server contact with database, database update the result and send the results to the user. Requirements verified: Yes Test environment: Person must be logged in
Test setup/ pre-condition: Person should be in Sale Page Location Expected result “Sale made successfully”. Clear the fields.
Sale will be added to the system
Pass: Yes Problem /issues: NIL Status: Successfully Executed
Condition: Pass
Fail: No
11. Test case: Purchase Return Test case: Make Purchase Return Priority(H,L): High Test objective: Return a purchase in the System Test descriptions: User select purchase. Open the return purchase page. Add item in return list from purchase list. Fill remaining fields. Click Save Requirements verified: Yes Test environment: Person must be logged in Test setup/ pre-condition: Person should be in Purchase List Page Location Expected result Purchase Return will be added to the system
Pass: Yes Problem /issues: NIL Status: Successfully Executed
“Return made successfully”. Clear the fields.
Condition: Pass
Fail: No
Conclusion According to our client requirements we have developed the POS System as offline based which is much backdated compare to new tech era? For future upgradation we will transform this offline system into online based. Currently users need to enter every detail manually. This system has some benefits to their staffs. Currently they are keeping every record by written down in memo manually. At least this system will give them relieve from exhausted life which they are dealing with their customers. Besides this system will make them more reliable to its customers as all the customers records will be kept safely than any previous times. Moreover, they can manage their stock more handily.
Reference SMARTDRAW http://www.smartdraw.com TECHNOPEDIA https://www.techopedia.com UML-DIAGRAM http://www.uml-diagrams.org GURU99 https://www.guru99.com/
Introduction
1.1
Introduction
A Computer Shop Management System (CSMS) is a computer system typically used to manage the sales in retail stores. It includes hardware components such as a computer, a bar code scanner, a printer and also software to manage the operation of the store. The most basic function of a CSMS system is to handle sales. When a customer arrives at a Computer Shop counter with goods to purchase, the cashier will start a new sale transaction. When the barcode of a good is read by the CSMS system, it will retrieve the name and price of this good from the backend catalog system and interact with inventory system to deduce the stock amount of this good. When the sale transaction is over, the customer can pay in cash, credit card or even check. After the payment is successful, a receipt will be printed.
1.2
Problem Statement
Shop is still doing work manually. They need a system that will computerize all the records. The purpose of this project is to provide an easy shopping facility and easy selling facility to the merchants of all categories. Today maximum business is working on paper work or desktop base by using Microsoft access worksheet. At present there is a hard time. it’s very hard to do maintain or run any business. This is developing century everyone is running towards the developing sides and gaining new inventions and innovations. Current system has many problems. In this section we discuss those problems.
All the works are carried out with pen and paper. Sometime stock information will be not typed accurately Sometime user cannot get the proper information about the product. Buyers cannot place the order easily. This system is not efficient and take long time.
Some other problems are Lack of immediate retrievals: the information is very difficult to retrieve and to find a particular information. Lack of immediate information storage: the information generated by various transactions take time and efforts to be stored at right place. Lack of prompt updating: various changes to the information like cost and other information is difficult. Error prone manual calculation: manual calculations are error prone and take a lot of time. This may result in incorrect information.
1.3
Reasons and Motivations
After know the problems above it eager me to solve those problems and make a system which will not have those problems and will be very simple and basic.
Following will be the benefits of computer shop, if this software is implemented in the system:
No misinterpretation of product name. Efficient system. Fewer paper work. Less forms to fill. Ease in finding the relevant task and class. Accessing mails faster. Secure.
That is the reason I have undertaken this project for more immediate replies to the customers and provide ease to the salesman as well. This system is designed to help administrator/owner to view the information of stock, sail/purchase accurately and sequent. The proper information is provided to the customer.
1.4
Aims and Objective
Following are the objectives of the canteen management system
To boost up the Process of sales and purchase To Decrease time consumption To Ease the Vendors To replace the paper work thing This project will manage large amount of data in short time. No data redundancy. To reduce the time consuming
The aim of our project is to make the entire system efficient and user friendly to the product manager and administrator.
To promote the shopping market in Pakistan To make more products available to the customer To promote shops Searching will be easy and quicker. Paper work will be reduced. Avoid from wastage of time and effort. Manage large amount of data with efficiency and accuracy. Security of data is high. Easy to view product details. Fewer complexes. Searching is easy. User friendly To increase the flexibility of the administrator, agents and buyers. Making the system faster than the present system. To facilitate the administrator so that he can easily access product information from anywhere. To reduce complexity of selling and purchasing. Immediate storage of information Easy to operate Immediate retrieval of information No redundancy
1.5
Accuracy Reliability
Scope of Project
The problem is to develop and design the software to handle the computers and company details and generate the report of that particular computer and company. The lack of coordination among these modules must be solved first. There also exist problem in data handling as it very huge data, loss of data, data redundancy and complex manipulation of data.
1.6
SDLC Models
Software development life cycle (SDLC) is a series of phases that provide a common understanding of the software building process. How the software will be realized and developed from the business understanding and requirements elicitation phase to convert these business ideas and requirements into functions and features until its usage and operation to achieve the business needs. The good software engineer should have enough knowledge on how to choose the SDLC model based on the project context and the business requirements. Types of Software developing life cycles (SDLC)
Waterfall Model V-Shaped Model Evolutionary Prototyping Model Rad Model Spiral Method (SDM) Iterative and Incremental Method Agile development
Waterfall Model The Waterfall Model is a linear sequential flow. In which progress is seen as flowing steadily downwards (like a waterfall) through the phases of software implementation. This means that any phase in the development process begins only if the previous phase is complete. The waterfall approach does not define the process to go back to the previous phase to handle changes in requirement. The waterfall approach is the earliest approach and most widely known that was used for software development. V-Shaped Model It is an extension of the waterfall model, Instead of moving down in a linear way, the process steps are bent upwards after the implementation and coding phase, to form the typical V shape. The major difference between the V-shaped model and waterfall model is the early test planning in the V-shaped model. Evolutionary Prototyping Model It refers to the activity of creating prototypes of software applications, for example, incomplete versions of the software program being developed. It is an activity that can occur in software development and It used to visualize some component of the software to limit the gap of misunderstanding the customer requirements by the development team. This also will reduce the iterations may occur in the waterfall approach and hard to be implemented due to the inflexibility of the waterfall approach. So, when the final prototype is developed, the requirement is considered to be frozen.
Spiral Model It is combining elements of both design and prototyping-in-stages, in an effort to combine advantages of top-down and bottom-up concepts. This model of development combines the features of the prototyping model and the waterfall model. The spiral model is favored for large, expensive, and complicated projects. This model uses many of the same phases as the waterfall model, in essentially the same order, separated by planning, risk assessment, and the building of prototypes and simulations. Agile Model It is based on iterative and incremental development, where requirements and solutions evolve through collaboration between cross-functional teams. Iterative and Incremental Model It is developed to overcome the weaknesses of the waterfall model. It starts with an initial planning and ends with deployment with the cyclic interactions in between. The basic idea behind this method is to develop a system through repeated cycles (iterative) and in smaller portions at a time (incremental), allowing software developers to take advantage of what was learned during the development of earlier parts or versions of the system. It can consist of mini waterfalls or mini V-Shaped model RAD Model RAD model is Rapid Application Development model. It is a type of incremental model. In RAD model the components or functions are developed in parallel as if they were mini projects. The developments are time boxed, delivered and then assembled into a working prototype.
1.7
SDLC Model Chosen
Since I will be working on Visual Studio so that RAD Model will suite me the best
1.8
Procedure
User will first login. He can then choose what he wants to do from menu like
Manage Categories Manage Products Manage Sales and Customers Manage Purchases and Vendor Manage Returns of Sales and Purchases View and Print Various Reports like Income Statement Generate Bills
2.
Literature Review and Analysis
2.1
Background of Research
After choosing a topic, you will need to locate introductory sources that give basic background information about the subject. Finding background information at the beginning of your research is especially important if you are unfamiliar with the subject area or not sure from what angle to approach your topic. To collect the information, I have searched and visited few existing systems. Then find what flaws were there within them. Had meeting with my teachers. Watch demos and video about mail system. Background research is also important to help you understand the theory behind your experiment. In other words, science fair judges like to see that you understand why your experiment turns out the way it does
2.2
Literature Review
Computer Shop Management System plays a great role in simplifying the job of employees at the Computer Shop Management System and satisfying the need of customers and stakeholders of the canteen management system. Even though no documentation is found in Ethiopia to be reviewed, products have been observed at some canteen management systems to help understand the problem of managing canteen management systems and handling canteen management system data. This chapter reviews these products This project work tries to fill the gap by automating the various activities at computer shop management systems. It tries to satisfy customers need and simplify the works of administrators, record officer and supplier. With a computer shop management system
2.3
Existing Systems
2.3.1 Existing System I
Problem is that this system doesn’t work on Windows 10 and it doesn’t have advance reports and purchases return module.
2.3.2 Existing System II
This is very old and run only on windows 2000 and its ui not easy to understand and many modules are missing. 2.3.3 Existing System III
This system just has basic reports and don’t have module for purchase return.
2.4
Proposed System
The Computer-shop Management System is the new, self-contained product. The Computershop management system is using C# platform. All components follow 3 Tier Architecture pattern. The user can retrieve information of their shop progress. All pages of the system are following a consistent theme and clear structure. The occurrence of errors should be minimized through the use of checkboxes and scroll down in order to reduce the amount of text input from user. Error message should be located beside the error input which clearly highlight and tell user how to solve it. If system error, it should provide the contact methods. The
page should display the project process in different color to clearly reflect the various states. Each level of user will have its own interface and privilege to manage and modify the project information. User interface elements are easy to understand. Part of user interface is wellorganized on screen and the parts are concatenated right. When users look at the interface, they understand which pane is used for which purpose. Each task of an interface is specified clearly and users use them correctly. For example, when users press to any button on interface, they can know which operations are done by pressing this button.
2.5
Comparison
Existing systems Old and Unfriendly Interface Workflow was not fluid No Purchases Return No Advance Reporting Difficult Backup and Recovery No Authentication Hard to Operate
2.6
Proposed system Friendly and Eye Catching Interface Workflow is fluid Has Purchases Returns Has Advance Reporting One Click Backup and Recovery Secure Authentication Easy to Operate
Feasibility Report
The feasibility study is the important step in any software development process. This is because it makes analysis of different aspects like cost required for developing and executing the system, the time required for each phase of the system and so on. If these important factors are not analyzed then definitely it would have impact on the organization and the development and the system would be a total failure. So, for running the project and the organization successfully this step is a very important step in a software development life cycle process. By making analysis this way it would be possible to make a report of identified area of problem. By making a detailed analysis in this area a detailed document or report is prepared in this phase which has details like project plan or schedule of the project, the cost estimated for developing and executing the system, target dates for each phase of delivery of system developed and so on. This phase is the base of software development process since further steps taken in software development life cycle would be based on the analysis made on this phase and so careful analysis has to be made in this phase. The feasibility study that was done for this project included the following considerations – Economic Feasibility This is a very important aspect to be considered while developing a project. We decided the technology based on minimum possible cost factor. All hardware and software cost have to be borne by the organization. We analyzed the existing system and concluded that the existing systems with the organization only needed to be updated to newer configuration instead of going for new hardware setups. Overall, we have estimated that the benefits the organization is going to receive from the proposed system will surely overcome the initial costs and the later on running cost for system. Technical Feasibility This included the study of function, performance and constraints that may affect the ability to achieve an acceptable system. or this feasibility study, we studied complete functionality to be provided in the system, as described in the System Requirement Specification (SRS), and checked if everything was possible using C# and SQL Server. After the study we came to
conclusion that we can proceed further with the tools and development environment chosen by us. This was important in our case as we were working on two various phases of the department that will need to be integrated in future to make an extended system. Operation Feasibility No doubt the proposed system is fully GUI based that is very user friendly and all inputs to be taken all self-explanatory even to a layman. Besides, a proper training has been conducted to let know the essence of the system to the users so that they feel comfortable with new system. As far our study is concerned the clients are comfortable and happy as the system has cut down their loads and doing all the complex activities itself. Resource Feasibility This is also an important check to be done that the required resources will be available or not. As far as Software and hardware were considered, there was no such constraint using C# and SQL Server as Front-end and Back-end respectively.
2.7
Statement of Work
A statement of work (SoW) is a document routinely employed in the field of project management. It defines project-specific activities, deliverables and timelines for a vendor providing services to the client. The SOW typically also includes detailed requirements and pricing, with standard regulatory and governance terms and conditions. ORGANIZATION NAME CONTACT ADDRESS PROJECT NAME BRAND PRODUCT BEGIN DATE END DATE DURATION ASSUMPTIONS
GOALS OBJECTIVE SCOPE DELIVERABLES PAYMENTS ADVANCE MID TOTAL COST
2.8
Gantt Chart
A Gantt chart is a type of bar chart that illustrates a project schedule, named after its inventor, Henry Gantt (1861–1919), who designed such a chart around the years 1910– 1915. Modern Gantt charts also show the dependency relationships between activities and current schedule status. A Gantt chart, commonly used in project management, is one of the most popular and useful ways of showing activities (tasks or events) displayed against time. On the left of the chart is a list of the activities and along the top is a suitable time scale. Each activity is represented by a bar; the position and length of the bar reflects the start date, duration and end date of the activity.
3.
System Design
3.1
Introduction
Systems design is the process of defining the architecture, modules, interfaces, and data for a system to satisfy specified requirements. Systems design could be seen as the application of systems theory to product development. There is some overlap with the disciplines of systems analysis, systems architecture and systems engineering.
3.2
Data Flow Diagram
A two-dimensional diagram that explains how data is processed and transferred in a system. The graphical depiction identifies each source of data and how it interacts with other data sources to reach a common output. Individuals seeking to draft a data flow diagram must (1) identify external inputs and outputs, (2) determine how the inputs and outputs relate to each other, and (3) explain with graphics how these connections relate and what they result in. This type of diagram helps business development and design teams visualize how data is processed and identify or improve certain aspects. A data flow diagram (DFD) illustrates how data is processed by a system in terms of inputs and outputs. As its name indicates its focus is on the flow of information, where data comes from, where it goes and how it gets stored. DFD graphically representing the functions, or processes, which capture, manipulate, store, and distribute data between a system and its environment and between components of a system. The visual representation makes it a good communication tool between User and System designer. Structure of DFD allows starting from a broad overview and expand it to a hierarchy of detailed diagrams. DFD has often been used due to the following reasons: Logical information flow of the system Determination of physical system construction requirements Simplicity of notation Establishment of manual and automated systems requirements There are four basic symbols that are used to represent a data-flow diagram. Process A process receives input data and produces output with a different content or form. Processes can be as simple as collecting input data and saving in the database, or it can be complex as producing a report containing monthly sales of all retail stores in the northwest region. Data Flow A data-flow is a path for data to move from one part of the information system to another. A data-flow may represent a single data element such the Customer ID or it can represent a set of data element (or a data structure). Data Store A data store or data repository is used in a data-flow diagram to represent a situation when the system must retain data because one or more processes need to use the stored data in a later time. External Entity An external entity is a person, department, outside organization, or other information system that provides data to the system or receives outputs from the system. External entities are components outside of the boundaries of the information systems.
3.2.1 Context DFD A context diagram is a top level (also known as "Level 0") data flow diagram. It only contains one process node ("Process 0") that generalizes the function of the entire system in relationship to external entities.
This is simple Level 0 DFD with only one process 3.2.2 Level 1 DFD A level 1 data flow diagram (DFD) is more detailed than a level 0 DFD but not as detailed as a level 2 DFD. It breaks down the main processes into subprocesses that can then be analyzed and improved on a more intimate level.
A more detailed DFD of Computer Shop System
3.3
Use Case Diagram
UML Use Case Diagrams. Use case diagrams are usually referred to as behavior diagrams used to describe a set of actions (use cases) that some system or systems (subject) should or can perform in collaboration with one or more external users of the system (actors). A use case diagram contains four components.
3.4
The boundary, which defines the system of interest in relation to the world around it. The actors, usually individuals involved with the system defined according to their roles. The use cases, which are the specific roles played by the actors within and around the system. The relationships between and among the actors and the use cases.
Sequence Diagram
In software engineering, a class diagram in the Unified Modeling Language (UML) is a type of static structure diagram that describes the structure of a system by showing the system's classes, their attributes, operations (or methods), and the relationships among objects. The class diagram is the main building block of object-oriented modelling. It is used both for general conceptual modelling of the systematics of the application, and for detailed modelling translating the models into programming code. Class diagrams can also be used for data modeling. The classes in a class diagram represent both the main elements, interactions in the application, and the classes to be programmed. In the diagram, classes are represented with boxes that contain three compartments: The top compartment contains the name of the class. It is printed in bold and centered, and the first letter is capitalized. The middle compartment contains the attributes of the class. They are left-aligned and the first letter is lowercase. The bottom compartment contains the operations the class can execute. They are also leftaligned and the first letter is lowercase.
In the design of a system, a number of classes are identified and grouped together in a class diagram that helps to determine the static relations between them. With detailed modelling, the classes of the conceptual design are often split into a number of subclasses. In order to further describe the behavior of systems, these class diagrams can be complemented by a state diagram or UML state machine.
3.5
Class Diagram
In software engineering, a class diagram in the Unified Modeling Language (UML) is a type of static structure diagram that describes the structure of a system by showing the system's classes, their attributes, operations (or methods), and the relationships among objects. The class diagram is the main building block of object-oriented modelling. It is used both for general conceptual modelling of the systematics of the application, and for detailed modelling translating the models into programming code. Class diagrams can also be used for data modeling. The classes in a class diagram represent both the main elements, interactions in the application, and the classes to be programmed.
In the diagram, classes are represented with boxes that contain three compartments: The top compartment contains the name of the class. It is printed in bold and centered, and the first letter is capitalized. The middle compartment contains the attributes of the class. They are left-aligned and the first letter is lowercase. The bottom compartment contains the operations the class can execute. They are also leftaligned and the first letter is lowercase. In the design of a system, a number of classes are identified and grouped together in a class diagram that helps to determine the static relations between them. With detailed modelling, the classes of the conceptual design are often split into a number of subclasses. In order to further describe the behavior of systems, these class diagrams can be complemented by a state diagram or UML state machine.
3.6
ER Diagram
An entity-relationship diagram (ERD) is a graphical representation of an information system that shows the relationship between people, objects, places, concepts or events within that system. An ERD is a data modeling technique that can help define business processes and can be used as the foundation for a relational database.
While useful for organizing data that can be represented by a relational structure, an entityrelationship diagram can't sufficiently represent semi-structured or unstructured data, and an ERD is unlikely to be helpful on its own in integrating data into a pre-existing information system. Three main components of an ERD are the entities, which are objects or concepts that can have data stored about them, the relationship between those entities, and the cardinality, which defines that relationship in terms of numbers. For example, an ER diagram representing the information system for a company's sales department might start with graphical representations of entities such as the sales representative, the customer, the customer's address, the customer's order, the product and the warehouse. (See diagram) Then lines or other symbols can be used to represent the relationship between entities, and text can be used to label the relationships. Finally, cardinality notations define the attributes of the relationship between the entities. Cardinalities can denote that an entity is optional (for example, a sales rep could have no customers or could have many) or mandatory (for example, the must be at least one product listed in an order.) Relationships: A relationship, in the context of databases, is a situation that exists between two relational database tables when one table has a foreign key that references the primary key of the other table. Relationships allow relational databases to split and store data in different tables, while linking disparate data items. Cardinality and ordinality, respectively, refer to the maximum number of times an instance in one entity can be associated with instances in the related entity, and the minimum number of times an instance in one entity can be associated with an instance in the related entity. Cardinality and ordinality are When it comes to notation, data modelers have many options to choose from. While crow's foot notation is widely accepted as the most intuitive style, some developers use OMT, IDEF, Bachman, or UML notation to indicate cardinality. Since crow's foot notation shows both minimum and maximum cardinality in an easy-to-read graphic format. The three main cardinal relationships are: One-to-one (1:1). For example, if each customer in a database is associated with one mailing address. One-to-many (1:M). For example, a single customer might place an order for multiple products. The customer is associated with multiple entities, but all those entities have a single connection back to the same customer. Many-to-many (M:N). For example, at a company where all call center agents work with multiple customers, each agent is associated with multiple customers, and multiple customers might also be associated with multiple agents. While there are tools to help draw entity-relationship diagrams, such as CASE (computer-aided software engineering) tools, some relational database management systems also have design capabilities built in.
3.7
Database
3.7.1 Database Schema A database schema of a database system is its structure described in a formal language supported by the database management system (DBMS). The term "schema" refers to the organization of data as a blueprint of how the database is constructed (divided into database tables in the case of relational databases). The formal definition of a database schema is a set of formulas (sentences) called integrity constraints imposed on a database. These integrity constraints ensure compatibility between parts of the schema. All constraints are expressible in
the same language. A database can be considered a structure in realization of the database language. The states of a created conceptual schema are transformed into an explicit mapping, the database schema. This describes how real-world entities are modeled in the database. "A database schema specifies, based on the database administrator's knowledge of possible applications, the facts that can enter the database, or those of interest to the possible end-users." The notion of a database schema plays the same role as the notion of theory in predicate calculus. A model of this "theory" closely corresponds to a database, which can be seen at any instant of time as a mathematical object. Thus, a schema can contain formulas representing integrity constraints specifically for an application and the constraints specifically for a type of database, all expressed in the same database language. In a relational database, the schema defines the tables, fields, relationships, views, indexes, packages, procedures, functions, queues, triggers, types, sequences, materialized, views, synonyms, database links, directories, XML schema, and other elements. A database generally stores its schema in a data dictionary. Although a schema is defined in text database language, the term is often used to refer to a graphical depiction of the database structure. In other words, schema is the structure of the database that defines the objects in the database. Tables
Schema
3.8
Normalization
Database Normalization is a technique of organizing the data in the database. Normalization is a systematic approach of decomposing tables to eliminate data redundancy(repetition) and undesirable characteristics like Insertion, Update and Deletion Anamolies. It is a multi-step process that puts data into tabular form, removing duplicated data from the relation tables. Normalization is used for mainly two purposes, Eliminating reduntant(useless) data. Ensuring data dependencies make sense i.e data is logically stored. The inventor of the relational model Edgar Codd proposed the theory of normalization with the introduction of First Normal Form, and he continued to extend theory with Second and Third Normal Form. Later he joined with Raymond F. Boyce to develop the theory of Boyce-Codd Normal Form. Theory of Data Normalization in SQL is still being developed further. For example, there are discussions even on 6th Normal Form. However, in most practical applications, normalization
achieves its best in 3rd Normal Form. The evolution of Normalization theories is illustrated below-
3.8.1 Normalization Types with Examples Assume a video library maintains a database of movies rented out. Without any normalization, all information is stored in one table as shown below.
1NF (First Normal Form) Rules Each table cell should contain a single value. Each record needs to be unique. The above table in 1NF1NF Example
2NF (Second Normal Form) Rules Rule 1- Be in 1NF Rule 2- Single Column Primary Key It is clear that we can't move forward to make our simple database in 2nd Normalization form unless we partition the table above.
We have divided our 1NF table into two tables viz. Table 1 and Table2. Table 1 contains member information. Table 2 contains information on movies rented. We have introduced a new column called Membership_id which is the primary key for table 1. Records can be uniquely identified in Table 1 using membership id 3NF (Third Normal Form) Rules Rule 1- Be in 2NF Rule 2- Has no transitive functional dependencies To move our 2NF table into 3NF, we again need to again divide our table. 3NF Example
We have again divided our tables and created a new table which stores Salutations. There are no transitive functional dependencies, and hence our table is in 3NF In Table 3 Salutation ID is primary key, and in Table 1 Salutation ID is foreign to primary key in Table 3 Now our little example is at a level that cannot further be decomposed to attain higher forms of normalization. In fact, it is already in higher normalization forms. Separate efforts for moving into next levels of normalizing data are normally needed in complex databases. However, we will be discussing next levels of normalizations in brief in the following. Boyce-Codd Normal Form (BCNF) Even when a database is in 3rd Normal Form, still there would be anomalies resulted if it has more than one Candidate Key. Sometimes is BCNF is also referred as 3.5 Normal Form.
4NF (Fourth Normal Form) Rules If no database table instance contains two or more, independent and multivalued data describing the relevant entity, then it is in 4th Normal Form. 5NF (Fifth Normal Form) Rules A table is in 5th Normal Form only if it is in 4NF and it cannot be decomposed into any number of smaller tables without loss of data. 6NF (Sixth Normal Form) Proposed 6th Normal Form is not standardized, yet however, it is being discussed by database experts for some time. Hopefully, we would have a clear & standardized definition for 6th Normal Form in the near future...
4.
Development
4.1
Development Plan
I have used Rad Model for my development 4.1.1 Rad Model The RAD (Rapid Application Development) model is based on prototyping and iterative development with no specific planning involved. The process of writing the software itself involves the planning required for developing the product. Rapid Application Development focuses on gathering customer requirements through workshops or focus groups, early testing of the prototypes by the customer using iterative concept, reuse of the existing prototypes (components), continuous integration and rapid delivery. Rapid application development is a software development methodology that uses minimal planning in favor of rapid prototyping. A prototype is a working model that is functionally equivalent to a component of the product. In the RAD model, the functional modules are developed in parallel as prototypes and are integrated to make the complete product for faster product delivery. Since there is no detailed preplanning, it makes it easier to incorporate the changes within the development process. RAD projects follow iterative and incremental model and have small teams comprising of developers, domain experts, customer representatives and other IT resources working progressively on their component or prototype. The most important aspect for this model to be successful is to make sure that the prototypes developed are reusable. RAD model distributes the analysis, design, build and test phases into a series of short, iterative development cycles. Following are the various phases of the RAD Model – Business Modeling The business model for the product under development is designed in terms of flow of information and the distribution of information between various business channels. A complete business analysis is performed to find the vital information for business, how it can be obtained, how and when is the information processed and what are the factors driving successful flow of information. Data Modeling The information gathered in the Business Modeling phase is reviewed and analyzed to form sets of data objects vital for the business. The attributes of all data sets is identified and defined. The relation between these data objects are established and defined in detail in relevance to the business model. Process Modeling
The data object sets defined in the Data Modeling phase are converted to establish the business information flow needed to achieve specific business objectives as per the business model. The process model for any changes or enhancements to the data object sets is defined in this phase. Process descriptions for adding, deleting, retrieving or modifying a data object are given. The following illustration describes the RAD Model in detail.
RAD Model - Application RAD model can be applied successfully to the projects in which clear modularization is possible. If the project cannot be broken into modules, RAD may fail. The following pointers describe the typical scenarios where RAD can be used − RAD should be used only when a system can be modularized to be delivered in an incremental manner. It should be used if there is a high availability of designers for modeling. It should be used only if the budget permits use of automated code generating tools. RAD SDLC model should be chosen only if domain experts are available with relevant business knowledge. Should be used where the requirements change during the project and working prototypes are to be presented to customer in small iterations of 2-3 months. RAD Model - Pros and Cons RAD model enables rapid delivery as it reduces the overall development time due to the reusability of the components and parallel development. RAD works well only if high skilled engineers are available and the customer is also committed to achieve the targeted prototype in the given time frame. If there is commitment lacking on either side the model may fail. The advantages of the RAD Model are as follows − Changing requirements can be accommodated. Progress can be measured. Iteration time can be short with use of powerful RAD tools. Productivity with fewer people in a short time. Reduced development time.
Increases reusability of components. Quick initial reviews occur. Encourages customer feedback. Integration from very beginning solves a lot of integration issues. The disadvantages of the RAD Model are as follows − Dependency on technically strong team members for identifying business requirements. Only system that can be modularized can be built using RAD. Requires highly skilled developers/designers. High dependency on modeling skills. Inapplicable to cheaper projects as cost of modeling and automated code generation is very high. Management complexity is more. Suitable for systems that are component based and scalable. Requires user involvement throughout the life cycle. Suitable for project requiring shorter development times.
4.1.2 Hardware Tools Processor: Core i3 2.80 GHz RAM: 8GB Harddisk: 500GB 4.1.3 Software Tools Following Tools are used for making this system Language: C Sharp or C# IDE: Visual Studio 2017: Framework: .Net Framework 4.5 Technology: Winform UI and Reporting Framework: DevExpress 18.1.4 Database: SQL SERVER 2012 DB IDE: DbForge for Sql Server 5.1 Drawing: Microsoft Visio 2016 Report Making: Microsoft Word 2016
4.2
Platform (Microsoft)
Microsoft Visual Studio is an integrated development environment (IDE) from Microsoft. It is used to develop computer programs, as well as websites, web apps, web services and mobile apps. Visual Studio uses Microsoft software development platforms such as Windows API, Windows Forms, Windows Presentation Foundation, Windows Store and Microsoft Silverlight. It can produce both native code and managed code.
4.3
Language (C Sharp)
C# is a general-purpose, multi-paradigm programming language encompassing strong typing, imperative, declarative, functional, generic, object-oriented (class-based), and component-oriented programming disciplines. C# is one of the programming languages designed for the Common Language Infrastructure. 4.3.1 Creating User Interface
User Interface were made using drag and drop facility beside this UI Framework DevExpress was used to create more good looking, professional and responsive design 4.3.2 Levels of Coding Coding was done by keeping in view the 3-tier architecture. Visual studio itself provide 2 tier it keeps drag and drop code separate from other logic. But in 3 tier we further divide that logic into business logic and database logic. 4.3.3 OOP Features like inheritance, encapsulation and other oop features were used by default. Every custom Form or Control is inheriting from the basic form or control provided by visual studio itself 4.3.4 Dialog Box Dialog Box are used to show exception, success and error alerts. A few examples are given below 4.3.5 Events Mouse and Keyboard events are used beside them dropdown change event, and data grid selection changed event are also used. 4.3.6 Error Handling Errors are handled very wisely so that the software should not close unexpectedly. Few examples are given below. 4.3.7 Forms and Controls I have created following custom forms and controls 4.3.8 Why I choose C# I have chosen c# because it is very easy to create desktop application with it and criteria to create a computer shop management system was fulfilled by c#. and hardware work like printing was also added very easily.
5.
Deployment
5.1
Implementation
A product software implementation method is a blueprint to get users and/or organizations running with a specific software product. The method is a set of rules and views to cope with the most common issues that occur when implementing a software product: business alignment from the organizational view and acceptance from human view. The implementation of product software, as the final link in the deployment chain of software production, is in a financial perspective of a major issue. It is stated that the implementation of (product) software consumes up to 1/3 of the budget of a software purchase (more than hardware and software requirements together). When the main point of the computer study program is to implement counter measures to bots and bugs. 5.1.1 Location The software was implemented at Computer World 5.1.2 Hardware I told them to buy: Processor: Core 2 Dou 2.4 Ghz Ram: 2Gb HDD: 160Gb
5.2
Configuration
I installed sql server on their system. Made the installer of the software with automatic database connection setting. And database creation and table creation and insert one record for admin user in admin table for login
5.3
Testing
5.3.1 Purpose Software testing enables making objective assessments regarding the degree of conformance of the system to stated requirements and specifications. Testing verifies that the system meets the different requirements including, functional, performance, reliability, security, usability and so on. This verification is done to ensure that we are building the system right. In addition, testing validates that the system being developed is what the user needs. In essence, validation is performed to ensure that we are building the right system. Apart from helping make decisions, the information from software testing helps with risk management. Software testing contributes to improving the quality of the product. You would notice that we have not mentioned anything about defects/bugs up until now. 5.3.2 Unit Testing Testing performed on each module or block of code during development. Unit Testing is normally done by the programmer who writes the code.
5.3.3 Integration testing Testing done before, during and after integration of a new module into the main software package. This involves testing of each individual code module. One piece of software can contain several modules which are often created by several different programmers. It is crucial to test each module's effect on the entire program model. 5.3.4 System testing Testing done by a professional testing agent on the completed software product before it is introduced to the market. 5.3.5 Acceptance testing Beta testing of the product done by the actual end users.
5.4
Test Cases
1. Test case: Admin Login Test case: Login Priority(H,L): High Test objective: Verifying login Test descriptions: “user enter the required field, press login button”, client program contact to the server, server contact with database, database update the result and send the results to the user. Requirements verified: Yes Test environment: Person must have the software Test setup/ pre-condition: Software must be opened and user must be logged out Location Expected result The user will login to access application
Pass: Yes Problem /issues: NIL Status: Successfully Executed
“Login successfully”. Display main menu.
Condition: Pass
Fail: No
2. Test case: Computer Insert Test case: Add New Computer Item Priority(H,L): High Test objective: To Insert New Computer in the system Test descriptions: “user enter the required field, press save button”, client program contact to the server, server contact with database, database update the result and send the results to the user. Requirements verified: Yes Test environment: Person must be logged in Test setup/ pre-condition: Person should be in Manage Item Page Location Expected result Computer will be added to the system
Pass: Yes Problem /issues: NIL Status: Successfully Executed
“Item added successfully”. Clear the fields.
Condition: Pass
Fail: No
3. Test case: Category Insert Test case: Add New Computer Category Priority(H,L): High Test objective: To Insert New Computer Category in the system Test descriptions: “user enter the required field, press save button”, client program contact to the server, server contact with database, database update the result and send the results to the user. Requirements verified: Yes Test environment: Person must be logged in
Test setup/ pre-condition: Person should be in Manage Item Page and category dialog must be opened Location Expected result Category will be added to the system
Pass: Yes Problem /issues: NIL Status: Successfully Executed
“Category added successfully”. Clear the fields.
Condition: Pass
Fail: No
4. Test case: Adjust Price Test case: Adjusting Price of all items Priority(H,L): High Test objective: Adjust Price according to operation Test descriptions: User will select the operation and then select the value click calculate it will update the price fields for all items and user will then click save to update the database Requirements verified: Yes Test environment: Person must be logged in Test setup/ pre-condition: Person must be in adjust price page Location Expected result Price will be adjusted for all products
Pass: Yes Problem /issues: NIL Status: Successfully Executed
“Updated successfully”. Refresh the Grid
Condition: Pass
Fail: No
5. Test case: Adjust Stock Test case: Adjust Stock of Item Priority(H,L): High Test objective: Adjust Stock after the year end. Test descriptions: Increase or Decrease the New Stock and Click Save. Data will be updated in the database Requirements verified: Yes Test environment: Software must be logged in Test setup/ pre-condition: Person must be in adjust stock page Location Expected result “Updated successfully”. Refresh the Grid
Stock will be updated
Pass: Yes Problem /issues: NIL Status: Successfully Executed
Condition: Pass
Fail: No
6. Test case: Supplier Insert Test case: Add New Supplier Priority(H,L): High Test objective: To Insert New Supplier in the system Test descriptions: “user enter the required field, press save button”, client program contact to the server, server contact with database, database update the result and send the results to the user. Requirements verified: Yes Test environment: Person must be logged in Test setup/ pre-condition: Person should be in Manage Supplier Page Location Expected result Supplier will be added to the system
Pass: Yes Problem /issues: NIL Status: Successfully Executed
“Supplier added successfully”. Clear the fields.
Condition: Pass
Fail: No
7. Test case: Customer Insert Test case: Add New Customer Priority(H,L): High Test objective: To Insert New Customer in the system Test descriptions: “user enter the required field, press save button”, client program contact to the server, server contact with database, database update the result and send the results to the user. Requirements verified: Yes Test environment: Person must be logged in Test setup/ pre-condition: Person should be in Manage Customer Location Expected result Customer will be added to the system
Pass: Yes Problem /issues: NIL Status: Successfully Executed
“Customer added successfully”. Clear the fields.
Condition: Pass
Fail: No
8. Test case: Supplier Payment Test case: Add Supplier Payment Priority(H,L): High Test objective: To Add Supplier Payment Transaction Test descriptions: User select supplier. Open its payment dialog form. enter the required field, press save button, client program contacts to the server, server contact with database, database update the result and send the results to the user. Requirements verified: Yes Test environment: Person must be logged in Test setup/ pre-condition: Person should be in Manage Supplier Page Location Expected result Payment will be added to the system
Pass: Yes Problem /issues: NIL Status: Successfully Executed
“Supplier payment added successfully”. Clear the fields.
Condition: Pass
Fail: No
9. Test case: Purchase Test case: Insert Purchase Priority(H,L): High Test objective: To Insert Purchase in the System Test descriptions: User select supplier. Add Items in the cart. Fill payment fields, press save button, client program contacts to the server, server contact with database, database update the result and send the results to the user. Requirements verified: Yes Test environment: Person must be logged in Test setup/ pre-condition: Person should be in Purchase Page Location Expected result Purchase will be added to the system
Pass: Yes Problem /issues: NIL Status: Successfully Executed
“Purchase made successfully”. Clear the fields.
Condition: Pass
Fail: No
10. Test case: Sale Test case: Insert Sale Priority(H,L): High Test objective: To Insert Sale in the System Test descriptions: User select customer. Add Items in the cart. Fill payment fields, press save button, client program contacts to the server, server contact with database, database update the result and send the results to the user. Requirements verified: Yes Test environment: Person must be logged in
Test setup/ pre-condition: Person should be in Sale Page Location Expected result “Sale made successfully”. Clear the fields.
Sale will be added to the system
Pass: Yes Problem /issues: NIL Status: Successfully Executed
Condition: Pass
Fail: No
11. Test case: Purchase Return Test case: Make Purchase Return Priority(H,L): High Test objective: Return a purchase in the System Test descriptions: User select purchase. Open the return purchase page. Add item in return list from purchase list. Fill remaining fields. Click Save Requirements verified: Yes Test environment: Person must be logged in Test setup/ pre-condition: Person should be in Purchase List Page Location Expected result Purchase Return will be added to the system
Pass: Yes Problem /issues: NIL Status: Successfully Executed
“Return made successfully”. Clear the fields.
Condition: Pass
Fail: No
Conclusion According to our client requirements we have developed the POS System as offline based which is much backdated compare to new tech era? For future upgradation we will transform this offline system into online based. Currently users need to enter every detail manually. This system has some benefits to their staffs. Currently they are keeping every record by written down in memo manually. At least this system will give them relieve from exhausted life which they are dealing with their customers. Besides this system will make them more reliable to its customers as all the customers records will be kept safely than any previous times. Moreover, they can manage their stock more handily.
Reference SMARTDRAW http://www.smartdraw.com TECHNOPEDIA https://www.techopedia.com UML-DIAGRAM http://www.uml-diagrams.org GURU99 https://www.guru99.com/
Related Documents

Computer Shop Management.docx
January 2021 1
Report-computer Shop Management System
January 2021 1
Computer
March 2021 2
Computer Viruses
January 2021 1
Computer Foreniscs
January 2021 13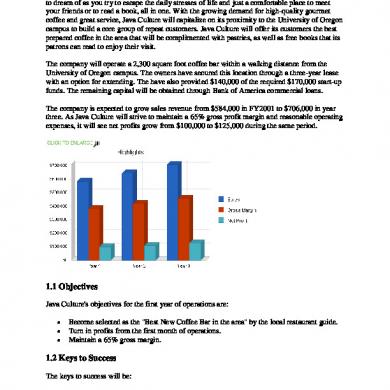
Coffee Shop
January 2021 1More Documents from "Whispering Melody"
Computer Shop Management.docx
January 2021 1
Macroeconomie-s2
January 2021 1
La_prediction_de_faillite_des_entreprises_tunisien.pdf
January 2021 1
Ov00
January 2021 3
Project Report On Credit Card1
January 2021 1