Discharge Ampl
This document was uploaded by user and they confirmed that they have the permission to share it. If you are author or own the copyright of this book, please report to us by using this DMCA report form. Report DMCA
Overview
Download & View Discharge Ampl as PDF for free.
More details
- Words: 1,116
- Pages: 5
Loading documents preview...
Br.no 60
AMPL I.
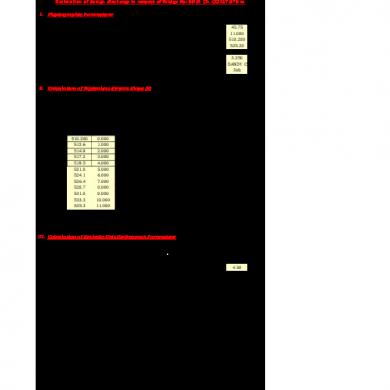
Estimation of design discharge in respect of Bridge No: 60 @ Ch :33127.676 m Proposed bridge 3 x 30.5. PSC Slab Physiographic Parameters:
1 2 3 4 5 6 7 8 9
Catchment area Length of longest stream from source to bridge site (L) Bed Level Level at the farthest point: Height of farthest point along the point of interest along river Length of the Stream from bridge site to nearer to the C.G Soil Sub zone Proposed formation level
A L BL FL H Lc
= = = = = = = = =
45.75 Sq Km 11.000 Km 510.280 m 535.28 m 25.000 m 3.250 Km SANDY CLAY 3(d) m
S
=
2.298
(i) Time from center of unit excess rainfall duration t peak of unit hydrograph Round this value to nearest 0.5 value L Lc 0.261 [ ] Tp=1.757
tp
= =
4.01 4.50
(ii) Peak Discharge of Unit Hydrograph per catchment area
qp
=
II. Calculation of Equivalent Stream Slope (S) Equivalent slope
S
=
Segment Length
S.No
R.L
Distance
1 2 3 4 5 6 7 8 9 10 11
(m) 510.280 512.6 514.9 517.2 519.5 521.8 524.1 526.4 528.7 531.0 533.3 535.3
(Km) 0.000 1.000 2.000 3.000 4.000 5.000 6.000 7.000 8.000 9.000 10.000 11.000
Total \
Li 0.000 1.000 1.000 1.000 1.000 1.000 1.000 1.000 1.000 1.000 1.000 1.000 11.000
SLix(Di-1+ Di)/L2 Height Above Datum Di 0.000 2.3 4.6 6.9 9.2 11.5 13.8 16.1 18.4 20.7 23.0 25.0
Di-1+Di Li(Di-1+Di)
0.000 2.300 6.900 11.500 16.100 20.700 25.300 29.900 34.500 39.100 43.700 48.000
0.00 2.30 6.90 11.50 16.10 20.70 25.30 29.90 34.50 39.10 43.70 48.00 278.0
Equivalent Slope
m/Km
III. Calculation of Sythetic Unit Hydrograph Parameters
S
= (iii) Width of the 50% Discharge Ordinate of Unit Hydrograph
(iv) Width of the 75% Discharge Ordinate of Unit Hydrograph
(v) Width of rising side Discharge Ordinate of 50% Unit Hydrograph
(vi) Width of rising side Discharge Ordinate of 75% Unit Hydrograph
(vii) Base width of the Unit Hydrograph
(viii) Unit Duration of Unit Hydrograph
1.260 tp-0.725 0.423
m3/s/Km2
W50 W50
= =
1.974(qp)-1.104
W75 W75
= =
0.961(qp)-1.125
WR50 WR50
= =
1.150(qp)-0.829
WR75 WR75
= =
0.527(qp)-0.932
TB
= =
5.411 (tp)0.826
tr
Page 1
hrs hrs
=
5.1
2.527
2.34
1.174
hrs
hrs
hrs
hrs
19.00
hrs
1.0
hrs
Br.no 60 (ix) Time to start of rise to the peak of Unit Hydrograph
Tm
=
(x) Peak Discharge of Unit Hydrograph
Qp
=
Page 2
5.0
hrs
3 19.372 m /s
Br.no 60 Estimated Unit Hydrograph Parameters were plotted on graph paper . The Plotted papers were joined to draw synthetic unit hydrograph 1Hour SUG Ordinates
Synthetic Unit Hydrograph
16
20.0
14
18.0
12
16.0 Discharge in Cumecs
10
14.0 12.0
8
10.0 6
8.0 6.0
4
4.0 2
2.0 0.0
0
02
0
4
5
6
10
8
10
12
15
14
16
20
18
25
20
22
Time in Hours
The summation of Discharge Ordinates of the unit Hydrograph of 1hr interval Thoeritically equal to Q= (A x d)/0.36*tr)
Where
A
=
Catchment Area
d
=
1.0 cm Depth
Theoritical Discharge Revise the Ordinates of Hydrograph equal to therotical Discharge
IV. Estimation of Design Storm a) Design Storm Duration The Design Storm Duration
Q
=
Hr.
Ordinate
0 1 2 3 4 5 6 7 8 9 10 11 12 13 14 15 16 17 18 19 20 21 22
0.0 2.0 4.0 10.0 15.0 19.00 16.00 12.0 9.00 8.0 6.0 5.0 4.0 3.0 3.0 2.4 2.0 2.0 1.7 1.5 1 0.75 0
127.31 3 127.08 m /s
(Refer Flood Estimation Report for 3d sub zone) TD
TD = 1.1xtp
=
5.00
hrs
b) Estimation of Point Rainfall and Areal Rainfall for Storm Duration R50 24 hour point rainfall (Refer Plate 9) = 24 cm Conversion factor (Refer Fig.10) = 0.69 R50 5 hour point rainfall = 16.56 cm Areal Reduction Factor for 45.75 Sq.Km catchment area (Refer Ann-4.2) = 0.975 R50 hour areal rainfall = 16.143 cm This 50 year design storm hour areal rainfall has been split in to 1-hour rainfall increments using time distribution coefficients given in Annexure-4.1 or fig-11 of F.E.R-3(d)
Duration
hr 1 2 3 4 5
coefficient
0.64 0.83 0.91 0.97 1
Storm Rainfall
Rainfall Increment
Loss Rate/Hr
Effective Hourly Rainfall
cm 10.332 13.399 14.690 15.659 16.143
cm 10.332 3.067 1.291 0.969 0.484
cm/hr 0.225 0.225 0.225 0.225 0.225
cm 10.107 2.842 1.066 0.744 0.259
V. Estimation of Peak Discharge For estimation of peak discharge, effecitve rainfall increments were arranged against ordinates in descending order. Sum of product of U.G ordinates and gives total direct surface runoff and base flow gives Total Peak Discharge
Time
S.U.G 1-Hour Ordinates Ef. Raifall
Direct Runoff
5
(m3/s) 19.37236
10.10672
(m3/s) 195.791
6.35
14.52927
2.842229
41.29551
7.7
9.686181
1.066465
10.32997
(Hours)
cm
Page 3
Br.no 60 10
7
0.743599
5.20519
11
5
0.259299
1.296496
12
4
0
Total Base Flow for the catchment area Peak Discharge
0 253.92
m3/s (Refer para 3.6)
=
=Direct surface runoff + base flow
=
Page 4
4.58
m3/s
3 258.49 m /s
Br.no 60 VI. Water way calculation (i) Design discharge as per Synthetic Unit Hydrograph method (ii) Assumed velocity
Q V
= =
(iii) Required area of water way
A0
=
3 258.49 m /s 2.44 m/sec
83.38
sqm
(iv) Poposed Linear water way
=
(v) Required Depth of water way = area of water way / Proposed Linear water way
=
(vi) Designed HFL
=
(vii) Required Vertical Clearance Provided Vertical Clearance
= =
1.108 1.108
m m
(viii) Thickness of the slab
=
2.25
m
= =
1.00 3.36
m m
=
4.269
m
(ix) Free board Required (Minimum) Free board Provided (FL-Designed HFL) (x) Bed level to formation level Hence proposed bridge is 3 x 30.5 x PSC Slab VII. Scour depth calculation (i) Design discharge Q is
=
Add 30% for foundation discharge
=
1. 811 xCx
0.91
m
511.19 m
3 258.49 m /s 3 336.04 m /s
Q
According to Lacey's formula Linear Water way= Where C= Coefficient taken as 2.67 (ii) Normal scour depth
91.500 m
D=0.473(Q/f)0.345
where for value of ' f ' refer 4.6.5 as per Bridge Substructure Code (iii) Maximum scour depth for abutment = 1.5*D (iv) Height from bottom of foundation to HFL is (v) Depth of Curtain wall / Drop wall below bed level References: 1 Bridge substructures & Foundation code 2 Flood Estimation Methods (RBF: 16) (If Catchment area <25 Sq.Km) 3 Flood Estimation Report for Mahanadi Sub zone -3(d) of February-1997
Page 5
=
77.74
m
=
2.72
m
=
1.76
= = =
4.09 4.54 3.62
m m m
AMPL I.
Estimation of design discharge in respect of Bridge No: 60 @ Ch :33127.676 m Proposed bridge 3 x 30.5. PSC Slab Physiographic Parameters:
1 2 3 4 5 6 7 8 9
Catchment area Length of longest stream from source to bridge site (L) Bed Level Level at the farthest point: Height of farthest point along the point of interest along river Length of the Stream from bridge site to nearer to the C.G Soil Sub zone Proposed formation level
A L BL FL H Lc
= = = = = = = = =
45.75 Sq Km 11.000 Km 510.280 m 535.28 m 25.000 m 3.250 Km SANDY CLAY 3(d) m
S
=
2.298
(i) Time from center of unit excess rainfall duration t peak of unit hydrograph Round this value to nearest 0.5 value L Lc 0.261 [ ] Tp=1.757
tp
= =
4.01 4.50
(ii) Peak Discharge of Unit Hydrograph per catchment area
qp
=
II. Calculation of Equivalent Stream Slope (S) Equivalent slope
S
=
Segment Length
S.No
R.L
Distance
1 2 3 4 5 6 7 8 9 10 11
(m) 510.280 512.6 514.9 517.2 519.5 521.8 524.1 526.4 528.7 531.0 533.3 535.3
(Km) 0.000 1.000 2.000 3.000 4.000 5.000 6.000 7.000 8.000 9.000 10.000 11.000
Total \
Li 0.000 1.000 1.000 1.000 1.000 1.000 1.000 1.000 1.000 1.000 1.000 1.000 11.000
SLix(Di-1+ Di)/L2 Height Above Datum Di 0.000 2.3 4.6 6.9 9.2 11.5 13.8 16.1 18.4 20.7 23.0 25.0
Di-1+Di Li(Di-1+Di)
0.000 2.300 6.900 11.500 16.100 20.700 25.300 29.900 34.500 39.100 43.700 48.000
0.00 2.30 6.90 11.50 16.10 20.70 25.30 29.90 34.50 39.10 43.70 48.00 278.0
Equivalent Slope
m/Km
III. Calculation of Sythetic Unit Hydrograph Parameters
S
= (iii) Width of the 50% Discharge Ordinate of Unit Hydrograph
(iv) Width of the 75% Discharge Ordinate of Unit Hydrograph
(v) Width of rising side Discharge Ordinate of 50% Unit Hydrograph
(vi) Width of rising side Discharge Ordinate of 75% Unit Hydrograph
(vii) Base width of the Unit Hydrograph
(viii) Unit Duration of Unit Hydrograph
1.260 tp-0.725 0.423
m3/s/Km2
W50 W50
= =
1.974(qp)-1.104
W75 W75
= =
0.961(qp)-1.125
WR50 WR50
= =
1.150(qp)-0.829
WR75 WR75
= =
0.527(qp)-0.932
TB
= =
5.411 (tp)0.826
tr
Page 1
hrs hrs
=
5.1
2.527
2.34
1.174
hrs
hrs
hrs
hrs
19.00
hrs
1.0
hrs
Br.no 60 (ix) Time to start of rise to the peak of Unit Hydrograph
Tm
=
(x) Peak Discharge of Unit Hydrograph
Qp
=
Page 2
5.0
hrs
3 19.372 m /s
Br.no 60 Estimated Unit Hydrograph Parameters were plotted on graph paper . The Plotted papers were joined to draw synthetic unit hydrograph 1Hour SUG Ordinates
Synthetic Unit Hydrograph
16
20.0
14
18.0
12
16.0 Discharge in Cumecs
10
14.0 12.0
8
10.0 6
8.0 6.0
4
4.0 2
2.0 0.0
0
02
0
4
5
6
10
8
10
12
15
14
16
20
18
25
20
22
Time in Hours
The summation of Discharge Ordinates of the unit Hydrograph of 1hr interval Thoeritically equal to Q= (A x d)/0.36*tr)
Where
A
=
Catchment Area
d
=
1.0 cm Depth
Theoritical Discharge Revise the Ordinates of Hydrograph equal to therotical Discharge
IV. Estimation of Design Storm a) Design Storm Duration The Design Storm Duration
Q
=
Hr.
Ordinate
0 1 2 3 4 5 6 7 8 9 10 11 12 13 14 15 16 17 18 19 20 21 22
0.0 2.0 4.0 10.0 15.0 19.00 16.00 12.0 9.00 8.0 6.0 5.0 4.0 3.0 3.0 2.4 2.0 2.0 1.7 1.5 1 0.75 0
127.31 3 127.08 m /s
(Refer Flood Estimation Report for 3d sub zone) TD
TD = 1.1xtp
=
5.00
hrs
b) Estimation of Point Rainfall and Areal Rainfall for Storm Duration R50 24 hour point rainfall (Refer Plate 9) = 24 cm Conversion factor (Refer Fig.10) = 0.69 R50 5 hour point rainfall = 16.56 cm Areal Reduction Factor for 45.75 Sq.Km catchment area (Refer Ann-4.2) = 0.975 R50 hour areal rainfall = 16.143 cm This 50 year design storm hour areal rainfall has been split in to 1-hour rainfall increments using time distribution coefficients given in Annexure-4.1 or fig-11 of F.E.R-3(d)
Duration
hr 1 2 3 4 5
coefficient
0.64 0.83 0.91 0.97 1
Storm Rainfall
Rainfall Increment
Loss Rate/Hr
Effective Hourly Rainfall
cm 10.332 13.399 14.690 15.659 16.143
cm 10.332 3.067 1.291 0.969 0.484
cm/hr 0.225 0.225 0.225 0.225 0.225
cm 10.107 2.842 1.066 0.744 0.259
V. Estimation of Peak Discharge For estimation of peak discharge, effecitve rainfall increments were arranged against ordinates in descending order. Sum of product of U.G ordinates and gives total direct surface runoff and base flow gives Total Peak Discharge
Time
S.U.G 1-Hour Ordinates Ef. Raifall
Direct Runoff
5
(m3/s) 19.37236
10.10672
(m3/s) 195.791
6.35
14.52927
2.842229
41.29551
7.7
9.686181
1.066465
10.32997
(Hours)
cm
Page 3
Br.no 60 10
7
0.743599
5.20519
11
5
0.259299
1.296496
12
4
0
Total Base Flow for the catchment area Peak Discharge
0 253.92
m3/s (Refer para 3.6)
=
=Direct surface runoff + base flow
=
Page 4
4.58
m3/s
3 258.49 m /s
Br.no 60 VI. Water way calculation (i) Design discharge as per Synthetic Unit Hydrograph method (ii) Assumed velocity
Q V
= =
(iii) Required area of water way
A0
=
3 258.49 m /s 2.44 m/sec
83.38
sqm
(iv) Poposed Linear water way
=
(v) Required Depth of water way = area of water way / Proposed Linear water way
=
(vi) Designed HFL
=
(vii) Required Vertical Clearance Provided Vertical Clearance
= =
1.108 1.108
m m
(viii) Thickness of the slab
=
2.25
m
= =
1.00 3.36
m m
=
4.269
m
(ix) Free board Required (Minimum) Free board Provided (FL-Designed HFL) (x) Bed level to formation level Hence proposed bridge is 3 x 30.5 x PSC Slab VII. Scour depth calculation (i) Design discharge Q is
=
Add 30% for foundation discharge
=
1. 811 xCx
0.91
m
511.19 m
3 258.49 m /s 3 336.04 m /s
Q
According to Lacey's formula Linear Water way= Where C= Coefficient taken as 2.67 (ii) Normal scour depth
91.500 m
D=0.473(Q/f)0.345
where for value of ' f ' refer 4.6.5 as per Bridge Substructure Code (iii) Maximum scour depth for abutment = 1.5*D (iv) Height from bottom of foundation to HFL is (v) Depth of Curtain wall / Drop wall below bed level References: 1 Bridge substructures & Foundation code 2 Flood Estimation Methods (RBF: 16) (If Catchment area <25 Sq.Km) 3 Flood Estimation Report for Mahanadi Sub zone -3(d) of February-1997
Page 5
=
77.74
m
=
2.72
m
=
1.76
= = =
4.09 4.54 3.62
m m m
Related Documents
Discharge Ampl
January 2021 1
1040v Discharge Debt Guide
February 2021 0
Discharge Planning (contoh)
March 2021 0
Discharge-plan
February 2021 0
Contoh Skenario Discharge Planning
February 2021 1
Format Discharge Plan
March 2021 0More Documents from "Butchay Lumbab"
Discharge Ampl
January 2021 1
Swathi Telugu Weekly 30th August 2013
February 2021 2
Mcq Electronics Electricals
February 2021 1
Pteg 201_lecture 1.ppt
February 2021 1
List_of_recovery_agency_credit_cards_hdfc (1).xlsx
February 2021 1