Extracted Pages From... Ielts Writing Task 1 Target 7+
This document was uploaded by user and they confirmed that they have the permission to share it. If you are author or own the copyright of this book, please report to us by using this DMCA report form. Report DMCA
Overview
Download & View Extracted Pages From... Ielts Writing Task 1 Target 7+ as PDF for free.
More details
- Words: 3,978
- Pages: 17
Loading documents preview...
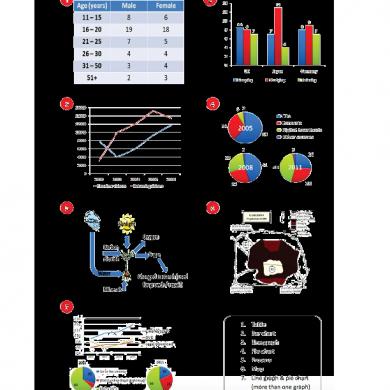
Các loại bảng biểu hay gặp
10
Từ vựng mô tả xu hướng, sự thay đổi Dưới đây là danh sách từ vựng dùng để mô tả xu hướng. Gồm các loại từ vựng khác nhau:
Các câu mô tả cho Figure 1: GM car sales increased significantly from $5,000 to $105,000 between 1960
and 2010. There was a significant increase of $100,000 in GM car sales, from
$5,000 to $105,000, between 1960 and 2010. GM car sales saw a significant growth in GM car sales, from $5,000 to $105,000, between 1960 and 2010. GM car sales registered a significant rise between 1960 and 2010. GM car sales reached a peak at $105,000 in 2010. GM car sales had an enormous climb of $100,000 between 1960 and 2010.
Lưu ý: Tại sao các câu trên lại dùng ‘thì quá khứ’ nhỉ?
11
Bài 1: Nhìn qua các biểu đồ dưới đây và mô tả các thay đổi trong biểu đồ
Lưu ý: Dùng thì tương lai để mô tả sự thay đổi của biểu đồ J, K và L Ví dụ: It is predicted that the number of radio listeners will fall to 45,000 people in 2030.
12
Kết nối các xu hướng Xu hướng giống nhau và khác nhau Figure 1 (Addition)
Figure 2 (Contrast)
105
105
85
85
65
65
45
45
25
25
Ví dụ Figure 1: GM car sales increased gradually to $24,000 in 1980, and then it continued its upward trend in the next four years to reach a peak at $105,000 in 2010. Ví dụ Figure 2: There was a sharp increase in GM car sales between 1960 and 1990 until it reached a high of almost $95,000; however, sales began to decrease swiftly to under $65,000 in 2010.
Bài 2: Quan sát các biểu đồ sau và mô tả sự thay đổi, kết nối các xu hướng.
Bài 3: Dùng các cụm từ dưới đây để viết mô tả cho sự thay đổ và các xu hướng trong biểu đồ. 1. mild fluctuations
8. a marked rise
2. a peak
9. a dramatic decrease
3. a period of instability
10. a period of slight volatility
4. a significant increase
11. a leveling out
5. a partial growth
12. a sharp decline
6. a record high
13. a plateau
7. figures climbing back
14. figures remaining constant
Ví dụ (Số 1 & 5 được dùng):
There were mild fluctuations in the number of the XYZ radio station from 1980 to 2000, ranging between 11 and 35 listeners; however, the figures saw a partial growth over the next two years, reaching almost 25 thousand people.
14
Dùng giới từ chính xác Khi mô tả số liệu và các đặc điểm, các giới từ như “to, by, with và at” có vai trò rất quan trọng trong câu. Dưới đây là một vài ví dụ bạn có thể tham khảo nhé:
1. Dùng giới từ “to” khi mô tả sự thay đổi đến mức nào đó In 2008, the rate of unemployment rose to 10%.
2. Dùng giới từ “by” khi mô tả sự thay đổi một khoảng nào đó In 2009, the rate of unemployment fell by 2% (from 10% to 8%).
3. Dùng giời từ “with” để nói về phần trăm, số lượng chiếm được He won the election with 52% of the vote.
4. Dùng giới từ “at” để thêm con số vào cuối câu Unemployment reached its highest level in 2008, at 10%. Bài tập: Hoàn thành các câu sau sử dụng giới từ phù hợp for of
at on to up down
in by with
from and
between during
1. ……… 1990 ……… 2000, there was a drop ……… 15%. 2. GM car sales peaked ……… 2,000 in 1999. 3. The chart shows a decline ……… 35% ……… the bird population. 4. There has been a significant increase ……… the number of people aged over eighty. 5. There have been dramatic cuts ……… the level of spending on the elderly, reaching a low …… 11%. 6. Profits rose ……… a low of 4.5 million to a high of 8 million in 2008. 7. Canada and Australia’s wheat exports fluctuated ……… 5 million and 6 million respectively. 8. There were significant improvements ……… healthcare ……… 1980. 9. The statistics show a reduction ……… 20% ……… energy costs as a result ……… the measures. 10. Profits fell ……… 10%, from 2,000 to 1,800 in 1970s. 11. The radio station experienced a fall ……… 36,000 listeners to a total audience ……… 2.1 million.
12. The number of students fell ……… a low of 1,500 in the second half of the year. 13. Cases of AIDS shot ……… from 2,400 in 1996 to 4,000 in 2004. 14. Demand reached a peak ……… 45,000 in early March. 15. The number of cars sold remained unchanged in 1999 ……… three million. 16. Students do between three ……… four hours homework a night. 17. The number of accidents ……… 1999 was slightly higher than that of 2000. 18. The figure rose steadily ……… the four years between 1997 ……… 2001. 19. Oil production rose dramatically at first but then leveled out ……… $70 a barrel. 20. There was an increase ……… 50,000 between 1990 and 1992. 21.……… 1994 ……… 1997, sales rose steadily ……… over 20,000. 22. DVD sales peaked ……… 60,000 ……… 1992 but then decreased ……… about 10,000 over the next two years. 23. In the year 2000, sales started ……… 10,000. In the first month, there was a rise ……… around 2,000. 24. After some fluctuations, sales in 2000 reached their peak ……… just over 15,000, a rise ……… 5,000 since the beginning of the year. Sales increased ……… over 10,000 between 1994 and 1997, but then dropped ……… more than 10,000 …………… 1997 and 1999. 25. In 2008, the rate of unemployment rose …… 10%. 26. In 2008, the rate of unemployment rose …… 10%, from 2,000 to 2,200 cases. 27.There was a slight rise …… the number of men employed. 28.
Experts expect there to be a fall …… approximately 30% over the next decade.
29.The introduction ……… DVDs led to a decline ……… 20% ……… video sales. 30. The figures show a drop ……… 5% ……… student numbers. 31. The health service program spent a total ……… $2.5 billion on staffing …… April 2002. 32. The survey hopes to track trends ……… consumer spending. 33. In 2009, the rate of unemployment fell ……… 2% (from 10% to 8%). 34. He won the election ……… 52% of the vote. 35. Unemployment reached its highest level ……… the year 2008 ……… 10%. 36.……… 2002, the cost of an average house in the UK was around £130,000. ……… 2007, the average house price had risen ……… almost £190,000, but it fell back ……… just under £150,000 ……… 2008. 37. Japan ……… two gold medals and a silver one stood ahead of the US ……… one gold and one bronze medal ……… 1968.
16
Giải đáp: 1. From 1990 to 2000, there was a drop of 15%. 2. GM car sales peaked at 2,000 in 1999. 3. The chart shows a decline of 35% in the bird population. 4. There has been a significant increase in the number of people aged over eighty. 5. There have been dramatic cuts in the level of spending on the elderly, reaching a low of 11%. 6. Profits rose from a low of 4.5 million to a high of 8 million in 2008. 7. Canada and Australia’s wheat exports fluctuated between 5 million and 6 million respectively. 8. There were significant improvements in healthcare in 1980. 9. The statistics show a reduction of 20% in energy costs as a result of the measures. 10. Profits fell by 10%, from 2,000 to 1,800 in 1970s. 11. The radio station experienced a fall of 36,000 listeners to a total audience of 2.1 million. 12. The number of students fell to a low of 1,500 in the second half of the year. 13. Cases of AIDS shot up from 2,400 in 1996 to 4,000 in 2004. 14. Demand reached a peak of 45,000 in early March. 15. The number of cars sold remained unchanged in 1999 at three million. 16. Students do between three and four hours homework a night. 17. The number of accidents in 1999 was slightly higher than that of 2000. 18.The figure rose steadily in the four years between 1997 and 2001. 19. Oil production rose dramatically at first but then leveled out at $70 a barrel. 20. There was an increase of 50,000 between 1990 and 1992. 21. Between 1994 and 1997, sales rose steadily to over 20,000. 22. DVD sales peaked at 60,000 in 1992 but then decreased to about 10,000 over the next two years. 23. In the year 2000, sales started at 10,000. In the first month, there was a rise of around 2,000. 24. After some fluctuations, sales in 2000 reached their peak of just over 15,000, a rise of 5,000 since the beginning of the year. Sales increased to over 10,000 between 1994 and 1997, but then dropped to more than 10,000 between 1997 and 1999. 25. In 2008, the rate of unemployment rose to 10%. 26. In 2008, the rate of unemployment rose by 10%, from 2,000 to 2,200 cases. 27. There was a slight rise in the number of men employed. 28. Experts expect there to be a fall of approximately 30% over the next decade.
17
29. The introduction of DVDs led to a decline of 20% in video sales. 30. The figures show a drop of 5% in student numbers. 31. The health service program spent a total of $2.5 billion on staffing in April 2002. 32. The survey hopes to track trends in consumer spending. 33. In 2009, the rate of unemployment fell by 2% (from 10% to 8%). 34.He won the election with 52% of the vote. 35. Unemployment reached its highest level in the year 2008 at 10%. 36. In 2002, the cost of an average house in the UK was around £130,000. In 2007, the average house price had risen to almost £190,000, but it fell back to just under £150,000 in 2008. 37. Japan with two gold medals and a silver one stood ahead of the US with one gold and one bronze medal in 1968.
18
Cách mô tả số liệu, phần trăm và phân số Trong một vài bảng biểu, đặc biệt là bảng (table), có những con số đặc biệt dướ dạng phân số như 1/3 hoặc 50%. Quan sát bảng dưới đây miêu tả số liệu trong năm 1990-1995: Bạn có thể mô tả bảng sau bằng con số, phân số hoặc phần trăm:
A.
1990 1,200
1995 1,800
1. The number went up by 600 from 1,200 to 1,800. (con số)
NHƯNG:
2. The number went up by one third from 1,200 to 1,800. (phân số) 3. The number went up by 50% from 1,200 to 1,800. (phần trăm)
Bạn có thể mô tả bảng sau bằng double, treble, quadruple, -fold and times:
B.
199 500
1994 1,000
1996 3,000
1998 12,000
1. The number doubled between 1992 and 1994. 2. The number trebled between 1994 and 1996. 3. The number quadrupled from 1996 to 1998. 4. There was a two-fold increase between 1992 and 1994. 5. The number went up six times between 1992 and 1996. 6. The figure in 1996 was six fold the 1992 figure. 7. The figure for 1996 was six times higher than that of 1992. 8. The figure for 1998 was four times greater than that of 1996. C.
Bạn có thể mô tả bảng sau bằng phân số: 1992 1,000
199 800
199 400
199 100
1. Between 1992 and 1994, the figure fell by one fifth. 2. Between 1994 and 1996, the figure dropped by half. 3. The figure in 1998 was one tenth the 1992 total. D.
Bạn có thể dùng phần trăm (percentage) ở đầu câu hoặc cuối câu: Family Type
Proportion of people living in
19
Single aged person Aged couple
6% 4%
1. 6% of single aged people were living in poverty. 2. The level of poverty among single aged people stood at 6% . E.
Bạn cũng có thể dùng các mẫu so sánh: 1. 6% of single aged people were living in poverty, compared to only 4% of aged couples.
20
Mở rộng bằng giải thích và ví dụ
1. 'double' (verb)
The number of unemployed people doubled between 2005 and 2009.
2. 'twice as...as/compared to', 'three times as...as/compared to'
There were twice as many unemployed people in 2009 as in 2005. Twice as many people were unemployed in 2009 compared to 2005.
3. 'twofold', 'threefold' (adjective or adverb)
There was a twofold increase in the number of unemployed people between 2005 and 2009. (adjective with the noun 'increase') The number of unemployed people increased twofold between 2005 and 2009. (adverb with the verb 'increase')
Các bạn hãy sử dụng các cách mô tả số liệu trên trong bài viết của bản thân nhé. Cách mô tả số lượng Cùng xem các ví dụ dưới đây và các công thức mẫu một cách kĩ càng. Đây là những mẫu bạn có thể áp dụng khi mô tả các con số khác nha trong bài task 1. The number of + Plural Countable Noun + Singular Verb Form The number of people out of work fell by 99,000 to 2.39 million in the three months to October.
The amount of + Singular Uncountable Noun + Singular Verb Form The amount of rainfall doubles between May and June. The proportion of + Countable or Uncountable Nouns + Singular Verb Form The proportion of spending on furniture and equipment reached its peak in 2001, at 23%.
The percentage of + Countable or Uncountable Nouns + Singular Verb Form The percentage of people using their phones to access the Internet jumped to 41% in 2008. The figures for Countable or Uncountable Nouns + Plural Verb Form The figures for imprisonment fluctuated sharply over the period shown.
21
Đa dạng hóa từ vựng Với bất kì dạng bài nào trong Task 1, việc đa dạng hóa từ vựng rất quan trọng. Chúng ta không nên dùng một mẫu câu quá nhiều lần. Đối với các biểu đồ tròn, dùng các từ vựng để mô tả về phần trăm và tỉ lệ. Các cụm hay gặp đó là "the proportion of…" hoặc "the percentage of…". Tuy nhiên, bạn có thể sử dụng các từ vựng mô tả phân số, bạn hãy xem các ví dụ sau đây nhé:
A large number of people
60%
three-fifths
over a quarter of people
55%
more than half
a small minority
50%
half
A significant number of people
45%
more than two fifths
less than a fifth
40%
two-fifths
35%
more than a third
30%
less than a third
This table presents some examples of how you can change percentages to fractions or ratios: Percentage Fraction
25%
a quarter
80%
four-fifths
20%
a fifth
75%
three-quarters
15%
less than a fifth
70%
seven in ten
10%
one in ten
65%
two-thirds
5%
one in twenty
Nếu số phần trăm không có con số chính xác như các ví dụ trên, bạn có thể sử dụng những cách sau để mô tả mà vẫn đảm bảo độ chính xác với biểu đồ gốc:
77%
just over three quarters
77%
approximately three quarters
49%
just under a half
Percentage proportion / number / amount / majority / minority 75% - 85% a very large majority
49%
nearly a half
65% - 75%
a significant proportion
32%
almost a third
10% - 15%
a minority
5%
a very small number
Dưới đây là 3 phương pháp hữu dụng bạn có thể dùng khi mô tả phần trăm:
1. English speakers usually put the percentage at the start of the sentence. 2. Use while, whereas or compared to (after a comma) to add a comparison. 3. Use "the figure for" to add another comparison in the next sentence.
22
In 1999, 35% of British people went abroad for their holidays, while only 28% of Australians spent their holidays in a different country. The figure for the USA stood at 31%. Around 40% of women in the UK had an undergraduate qualification in 1999, compared to 37% of men. The figures for the year 2000 rose slightly to 42% and 38% respectively.
Cách so sánh đơn giản Bạn có thể dùng "compared to", "compared with", "in comparison to" và "in comparison with" như nhau. Ví dụ:
Prices in the UK are high compared to / with / in comparison with (prices in) Canada and Australia. Compared to / with / in comparison with (prices in) Canada and Australia, prices in the UK are high.
Khi viết về con số hoặc sự thay đổi, các từ “while” hoặc “whereas” có thể dùng được trong rất nhiều hoàn cảnh:
There are 5 million smokers in the UK, while / whereas only 2 million Canadians and 1 million Australians smoke. Between 1990 and 2000, the number of smokers in the UK decreased dramatically, while / whereas the figures for Canada and Australia remained the same.
Lưu ý:
Chúng ta không nói "comparing to".
Chúng ta nói "2 million" , không nói "2 millions". Cách nói đúng: 10 million people Cách nói sai: 10 millions people, 10 millions of people, 10 million of people
Khi không có số liệu chính xác, có thể viết "millions of". e.g. Millions of people travel abroad each year.
23
Từ vựng so sánh Dưới đây là các cụm dùng để so sánh rất hay mà bạn nên áp dụng:
The chart compares... in terms of the number of... ...is by far the most... OR ...has by far the highest number of... the figures for... tend to be fairly similar In second place on the chart is...* The number of... is slightly higher than... Only four other countries have... ...all with similar proportions of... ...is the only country with a noticeably higher proportion of...
Lưu ý: Chỉ dùng các cụm như "in second place" nếu biểu đồ có đề cập đến thứ hạng hoặc đua tranh giữa các đối tượng. Các bạn không nên viết "in first / second place" nếu biểu đồ nói về việc thất nghiệp hoặc các vấn đề về sức khỏe / y tế.
So sánh hơn và so sánh nhất So sánh hơn kém và đối chiếu các số liệu với nhau là kĩ năng được đánh giá rất cao trong Writing Task 1. So sánh hơn và so sánh nhất là hai cách hiệu quả và hay được áp dụng nhất. So sánh hơn được dùng khi so sánh hai đối tượng:
Leopards are faster than tigers.
So sánh nhất được dùng để so sánh một đối tượng nổi bật trong nhóm:
The leopard is the largest of the four big cats.
Bảng dưới đây sẽ giúp bạn hình dung rõ hơn về các dạng so sánh bên trên nhé: Example Word Từ có 1 âm tiết Từ có 3 âm tiết trở lên
Từ kết thúc bằng chữ Từ ngắn cóynguyên âm ở
Comparative
Superlative
high
higher
the highest
productive
more productive
the most productive
less productive
the least productive
wealthy
wealthier
the wealthiest
hot
hotter
the hottest
good
better
the best
giữa từ Trường hợp đặc biệt
24
Cách từ vựng so sánh khác So sánh hơn và so sánh nhất được dùng để so sánh và đối chiếu, tuy nhiên vẫn chưa đủ để đa dạng hóa cách mô tả trong bài báo cáo. Ngoài ra, còn có các cách diễn đạt so sánh như sau: Từ nối
1. The Middle East produces high levels of oil; however, Japan produces none. 2. The USA produces large amounts of natural gas. In contrast, South Korea produces none. 3. European countries make great use of solar power. On the other hand, most Asian countries us this method of power generation very little.
Liên từ
1. The Middle East produces high levels of oil, whereas / while Japan produces none. 2. Whereas / While the Middle East produces high levels of oil, Japan produces none. 3. Although the Middle East produced 100 tons oil, Japan produced none.
Các cấu trúc khác
1. Developing countries are more reliant on alternative energy production than 2. 3. 4. 5. 6. 7. 8.
developed countries. Solar power accounts for far less of the total energy production than gas or coal does. Hydropower is not as efficient as wind power. Like Japan, South Korea does not produce any natural gas. The Middle East produces twice as much oil as Europe. Western countries consume three times more oil than the Middle East. Russia consumes slightly more oil than Germany. The UAE produced the same amount of oil as Saudi Arabia.
25
Cách đưa ra giải thích Khi đưa thêm thông tin giải thích, bạn cần giới hạn số lượng từ để đảm bảo rằng bài viết có thông tin chất lượng nhưng không vượt quá giới hạn từ. Cùng xem xét ví dụ sau đây nhé: 1. Both cities experienced a rise in the number of tourists coming in through their airports, which reached a common level of 255,000 in July. Rút gọn: Both cities experienced a rise in the number of tourists coming in through their airports, reaching a common level of 255,000 in July. 2. Gold bar prices experienced a spectacular rise in November, which climbed to a new peak of $625. Rút gọn: Gold bar prices experienced a spectacular rise in November, climbing to a new peak of $625. 3. In the first half of 2009, the attendance at the museum went into free fall, which nose-dived to approximately 300,000 visitors. Rút gọn: In the first half of 2009, the attendance at the museum went into free fall, nose-diving to approximately 300,000 visitors. 4. Females also spend less time socializing and much less time than men on sport, which allows them more time for studying. Rút gọn: Females also spend less time socializing and much less time than men on sport, allowing them more time for studying.
Bài tập: Rút gọn các câu sau thành cụm từ.
1. The figures then dropped sharply to well below 5000, which was the lowest in record for more than 40 years. 2. The largest number of visitors in total came from the United States, which rose from 345 to 609 thousand. 3. Rents shot up from 11% in 1993 to 21% in 2003, which doubled over the ten-year period.
4. From the end of 2001, consumption remained unchanged with two minor peaks at the end of 2001 and 2002, which corresponded with two dips in the use of nuclear and fossil energies. 5. Email and instant messenger are close thirds and fourths in popularity, which scored 17% and 16% respectively for men, 21% and 18% for their counterparts.
6. The amount of money saved also dropped dramatically, which stepped down from 6% in 2003 to just 2% ten years later. 7. In the first two months of the year, the number of internet users reached nearly 1.5 million, which was double the estimate for the period.
8. The number of internet users soared once more during March and April, which outstripped forecasts by a wide margin.
26
Related Documents
Extracted Pages From... Ielts Writing Task 1 Target 7+
January 2021 1
Ielts Writing Task 1
January 2021 1
Ielts Writing Task 1 Lessons
January 2021 3
Ielts Writing Task 2
January 2021 3
Ielts-writing-task-2-workbook
February 2021 1
Ielts Writing Task 1 Very Good.docx
January 2021 1More Documents from "Mohd Nor Hamzah"
Extracted Pages From... Ielts Writing Task 1 Target 7+
January 2021 1
Giao Trinh Ansys
January 2021 1
Last Session (new Oriental)
January 2021 1
O&m For Elevator English
January 2021 0
Ncc 2017 Round 2 Brief
February 2021 0