Quality Tools: Control Charts
This document was uploaded by user and they confirmed that they have the permission to share it. If you are author or own the copyright of this book, please report to us by using this DMCA report form. Report DMCA
Overview
Download & View Quality Tools: Control Charts as PDF for free.
More details
- Words: 607
- Pages: 3
Loading documents preview...
Quality Tools Control Charts
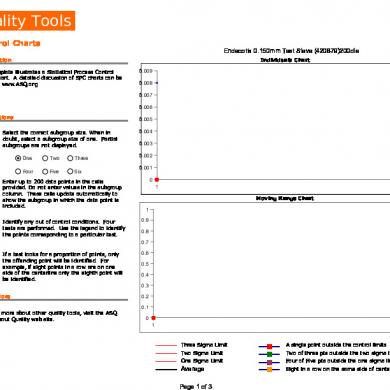
Endecotts 0.150mm Test Sieve (420879)200dia
Description
Individuals Chart
This template illustrates a Statistical Process Control (SPC) chart. A detailed discussion of SPC charts can be found at www.ASQ.org
0.009 0.008 0.007 0.006
Instructions ●
0.005
Select the correct subgroup size. When in doubt, select a subgroup size of one. Partial subgroups are not displayed. ●
●
●
One
Two
Three
Four
Five
Six
Enter up to 200 data points in the cells provided. Do not enter values in the subgroup column. These cells update automatically to show the subgroup in which the data point is included. Identify any out of control conditions. Four tests are performed. Use the legend to identify the points corresponding to a particular test.
0.004 0.003 0.002 0.001 0 1 Moving Range Chart 1 0.9 0.8 0.7
●
If a test looks for a proportion of points, only the offending point will be identified. For example, if eight points in a row are on one side of the centerline only the eighth point will be identified.
0.6 0.5 0.4 0.3
Learn More To learn more about other quality tools, visit the ASQ Learn About Quality web site.
0.2 0.1 0 1
Three Sigma Limit
A single point outside the control limits
Two Sigma Limit
Two of three pts outside the two sigma limit
One Sigma Limit
Four of Five pts outside the one sigma limit
Average
Eight in a row on the same side of centerline
Page 1 of 3
Quality Tools Control Charts
Endecotts 0.150mm Test Sieve (420879)200dia
Control Chart Data 0.008
Xbar/IMR Chart Avg
### Xbar one sigma Upper Limit
### Rbar one sigma Upper Limit
Range Chart Avg Rbar/d2
### Xbar two sigma Upper Limit
### Rbar two sigma Upper Limit
### Xbar three sigma Upper Limit
### Rbar three sigma Upper Limit
1
Number of samples
### Xbar one sigma Lower Limit
### Rbar one sigma Lower Limit
1
Subgroup size
### Xbar two sigma Lower Limit
### Rbar two sigma Lower Limit
1
Number of subgroups
### Xbar three sigma Lower Limit
#DIV/0! #DIV/0!
Year 2012
Sub Group 1
Data 0.008
Sub Group
Data
Sub Group
Data
Sub Group
Data
Sub Group
Data
n/a Sub Group
Data
Sub Group
Rbar three sigma Lower Limit
Data
Sub Group
26
51
76
101
126
151
176
2
27
52
77
102
127
152
177
3
28
53
78
103
128
153
178
4
29
54
79
104
129
154
179
5
30
55
80
105
130
155
180
6
31
56
81
106
131
156
181
7
32
57
82
107
132
157
182
8
33
58
83
108
133
158
183
9
34
59
84
109
134
159
184
10
35
60
85
110
135
160
185
11
36
61
86
111
136
161
186
12
37
62
87
112
137
162
187
13
38
63
88
113
138
163
188
14
39
64
89
114
139
164
189
15
40
65
90
115
140
165
190
16
41
66
91
116
141
166
191
17
42
67
92
117
142
167
192
18
43
68
93
118
143
168
193
19
44
69
94
119
144
169
194
20
45
70
95
120
145
170
195
21
46
71
96
121
146
171
196
22
47
72
97
122
147
172
197
23
48
73
98
123
148
173
198
24
49
74
99
124
149
174
199
25
50
75
100
125
150
175
200
Page 2 of 3
Data
This template was written for the American Society for Quality by Stat Aids Your feedback is welcome and encouraged. Please e-mail to: [email protected]
Endecotts 0.150mm Test Sieve (420879)200dia
Description
Individuals Chart
This template illustrates a Statistical Process Control (SPC) chart. A detailed discussion of SPC charts can be found at www.ASQ.org
0.009 0.008 0.007 0.006
Instructions ●
0.005
Select the correct subgroup size. When in doubt, select a subgroup size of one. Partial subgroups are not displayed. ●
●
●
One
Two
Three
Four
Five
Six
Enter up to 200 data points in the cells provided. Do not enter values in the subgroup column. These cells update automatically to show the subgroup in which the data point is included. Identify any out of control conditions. Four tests are performed. Use the legend to identify the points corresponding to a particular test.
0.004 0.003 0.002 0.001 0 1 Moving Range Chart 1 0.9 0.8 0.7
●
If a test looks for a proportion of points, only the offending point will be identified. For example, if eight points in a row are on one side of the centerline only the eighth point will be identified.
0.6 0.5 0.4 0.3
Learn More To learn more about other quality tools, visit the ASQ Learn About Quality web site.
0.2 0.1 0 1
Three Sigma Limit
A single point outside the control limits
Two Sigma Limit
Two of three pts outside the two sigma limit
One Sigma Limit
Four of Five pts outside the one sigma limit
Average
Eight in a row on the same side of centerline
Page 1 of 3
Quality Tools Control Charts
Endecotts 0.150mm Test Sieve (420879)200dia
Control Chart Data 0.008
Xbar/IMR Chart Avg
### Xbar one sigma Upper Limit
### Rbar one sigma Upper Limit
Range Chart Avg Rbar/d2
### Xbar two sigma Upper Limit
### Rbar two sigma Upper Limit
### Xbar three sigma Upper Limit
### Rbar three sigma Upper Limit
1
Number of samples
### Xbar one sigma Lower Limit
### Rbar one sigma Lower Limit
1
Subgroup size
### Xbar two sigma Lower Limit
### Rbar two sigma Lower Limit
1
Number of subgroups
### Xbar three sigma Lower Limit
#DIV/0! #DIV/0!
Year 2012
Sub Group 1
Data 0.008
Sub Group
Data
Sub Group
Data
Sub Group
Data
Sub Group
Data
n/a Sub Group
Data
Sub Group
Rbar three sigma Lower Limit
Data
Sub Group
26
51
76
101
126
151
176
2
27
52
77
102
127
152
177
3
28
53
78
103
128
153
178
4
29
54
79
104
129
154
179
5
30
55
80
105
130
155
180
6
31
56
81
106
131
156
181
7
32
57
82
107
132
157
182
8
33
58
83
108
133
158
183
9
34
59
84
109
134
159
184
10
35
60
85
110
135
160
185
11
36
61
86
111
136
161
186
12
37
62
87
112
137
162
187
13
38
63
88
113
138
163
188
14
39
64
89
114
139
164
189
15
40
65
90
115
140
165
190
16
41
66
91
116
141
166
191
17
42
67
92
117
142
167
192
18
43
68
93
118
143
168
193
19
44
69
94
119
144
169
194
20
45
70
95
120
145
170
195
21
46
71
96
121
146
171
196
22
47
72
97
122
147
172
197
23
48
73
98
123
148
173
198
24
49
74
99
124
149
174
199
25
50
75
100
125
150
175
200
Page 2 of 3
Data
This template was written for the American Society for Quality by Stat Aids Your feedback is welcome and encouraged. Please e-mail to: [email protected]
Related Documents
Quality Tools: Control Charts
January 2021 1
Quality Control
February 2021 1
Quality Control Specification
February 2021 1
Laboratory Quality Control. Ppt
February 2021 1
12879652 Parenteral Quality Control
January 2021 0
Biological Assay In Quality Control
March 2021 0More Documents from "Dilawar Khan"