Cement Elra
This document was uploaded by user and they confirmed that they have the permission to share it. If you are author or own the copyright of this book, please report to us by using this DMCA report form. Report DMCA
Overview
Download & View Cement Elra as PDF for free.
More details
- Words: 37,239
- Pages: 89
Loading documents preview...
Closer to dawn Ravindra Deshpande [email protected] +91 22 4062 6805 Ravi Sodah [email protected] +91 22 4062 6817
India Cement 9 November 2010 Elara Securities (India) Private Limited
9 November 2010
India | Cement
Initiating Coverage
Cement Closer to dawn
Sluggish capacity additions 18
300
15
250
12
200
9
150
6
100
FY13E
FY12E
FY10
FY11E
FY09
FY08
0 FY07
0 FY06
3
FY05
50
FY04
(Million tonne )
Indian cement industry witnessed massive capacity additions during the past three to four years on the back of a strong pricing regime. The nameplate cement capacity in the country went up by nearly 38% from FY08 till FY10. However, the same was reciprocated by a demand growth of only 20% which pulled down utilizations and therefore, the cement pricing as well as profitability of the industry. Lower profitability and cash inflows slowed down the capacity additions. Besides, the hurdles in acquiring land for greenfield projects as well as obtaining approvals and clearances for mining have taken a toll on capacity additions. Therefore, we believe, capacity utilizations in the sector would start improving post FY12 with the decelerating pace of capacity additions.
350
(Million tonne )
Effective capacity (LHS) Increase in effective capacity (RHS) Source: CMA, Elara Securities Estimates
All India Demand & Supply(mn tonnes)
Pricing: The worst is behind us
All India
We believe the actual cement pricing will depend upon the demand supply equations in the region, actual cost of production and players’ individual as well as collective actions. However, we expect the worst to be over for the cement pricing considering the improving demand supply equations and the resultant utilization levels in the industry. Although, we expect utilization levels to drop again in the Q2&Q3 FY12, we also assume that the higher cost push might arrest the fall in prices. Our RoCE based methodology to forecast prices, denotes that prices will rise the maximum in the Western region.
FY09 FY10 FY11E FY12E FY13E
Year end capacity
212
247
276
301
318
Effective Capacity
205
232
270
296
310
Dispatches
181
200
216
238
263
89
86
80
81
85
Capacity utilization (%)
Source: CMA, Elara Securities Estimates
Cement prices improve in major cities (INR per bag)
330
Upside in large caps limited, mid-caps flaunt superior potential We expect the upcycle in the cement cycle to be at least one year away. Our historical valuation analysis as well as comparative analysis suggests that current valuations enjoyed by large cap players are close to the discounted upcycle valuations. Hence, we believe the upside in these large cap stocks will be limited. However, mid-cap players are trading way below their distress case valuations hence warrant a favorable risk reward ratio even considering the regional risk.
280 230 180
Mumbai Chennai
Delhi Hyderabad
Oct-10
Jul-10
Apr-10
Jan-10
Oct-09
Jul-09
Apr-09
Jan-09
Oct-08
Jul-08
Apr-08
130
Kolkata
Source: CMIE, Elara Securities Research
Valuation FY12
FY11
FY10
FY09
FY08
FY07
FY06
FY05
FY04
FY03
FY02
Mid caps: Valuation gap swells FY01
With a sharp increase in cement prices in past two months, we believe that earnings of cement companies will bottom out in Q2FY11. We also expect the cement demand to gradually improve on the back of a strong construction and infrastructure demand. However, we believe the valuations of frontline stocks have already factored in the potential up-cycle in the sector. Yet `value buy opportunities’ are still available among mid-cap cement stocks.
20 0 (20) (40) (60) (80) (100)
(%)
Global Markets Research
Slower capacity addition to maintain demand-supply balance
Valuation disc for mid caps EBITDA/tonne disc Source: Elara Securities Estimates
Key Financials MCAP CMP Target Upside INR bn USD mn (INR) (INR) (%) UltraTech Reduce 310 6,976 1,122 1,139 1.5 Ambuja Sell 226 5,099 148 119 (19.8) ACC Accumulate 200 4,495 1,062 1,123 5.7 India Cements Accumulate 36 803 116 131 12.5 Shree Cem Accumulate 75 1,698 2,165 2,501 15.5 JK Cement Buy 12 264 168 220 31.4 Orient paper Buy 12 265 61 87 41.7 JK Lakshmi Buy 8 174 63 78 24 Source: Company, Elara Securities Estimates 1 USD= INR44.4 Company
Rating
EV/EBITDA(x) FY11E FY12E 10.4 8.5 9.8 9.2 10.2 8.0 7.9 4.2 6.6 4.8 6.7 5.2 3.4 2.9 3.8 3.6
P/E(X) FY11E FY12E 17.5 15.3 17.2 16.9 16.7 15.0 18.4 10.7 19.2 12.6 16.1 8.9 6.0 5.8 6.4 4.8
EV/tonne(USD) FY11E FY12E 144 138 184 180 131 122 62 56 98 82 54 51 50 40 47 55
RoE(%) FY11E FY12E 20.9 18.4 18.8 16.8 18.5 17.9 5.2 7.8 19.4 24.1 6.5 10.8 23.2 19.7 11.1 13.8
Ravindra Deshpande • [email protected] • +91 22 4062 6805 Ravi Sodah • [email protected] • +91 22 4062 6817 Elara Securities (India) Private Limited
Cement
Table of Content Executive Summary………………………………………………………………………………………………………………
3
The worst is behind us…………………………………………………………………………………………………………
5
Demand to quicken from H2FY11……………………………………………………………………………………..
7
Pricing: Downside remains limited…………………………………………………………………………………….
10
Comparative analysis……………………………………………………………………………………………………………
12
Valuation & Recommendation……………………………………………………………………………………………
20
Company Section Ultratech Cement Restructuring priced in………………………………………………………………………………………………………..
23
Ambuja Cements Melody from clinker……………………………………………………………………………………………………………..
33
ACC In the region of comfort………………………………………………………………………………………………………
43
India Cement Warming South winds…………………………………………………………………………………………………………
53
Shree Cement Regional champ at reasonable value…………………………………………………………………………………
63
JK Cement
Grey eminence……………………………………………………………………………………………………………………..
69
Orient Paper Lord of low cost, master in a downturn…………………………………………………………………………….
75
JK Lakshmi Cement Cementing its true place……………………………………………………………………………………………………..
81
2
Elara Securities (India) Private Limited
Executive summary Capacity additions to slowdown on lower prices After adding record capacities addition of a ~ 87mn tonnes between FY07 and FY10, the country has witnessed a marginal slowdown in the pace of addition. Primarily, the capacity additions were the result of higher operating cash flows on the back of high cement pricing regime. However, due to cost push and low cement prices, operating cash flows of cement companies have come under pressure resulting in a slowdown in new project announcement. Besides, long procedures related to the acquisition of land and obtaining environment clearances have delayed the commissioning of many cement plants. Thus, after capacity additions of whooping ~35mn tonnes by FY10, the cement industry is expected to add ~29mn tonnes in FY11, ~24mn tonnes in FY12 and 17mn tonnes in FY13. Between FY10FY13, the industry is expected to add 71mn tonnes while in the same period, the demand is expected to increase by only 63mn tonnes. Demand to accelerate in second half Growth in cement demand has been sluggish (4.9%) during the first half of FY11 due to heavy monsoons and a higher base effect. We believe the demand will accelerate from H2FY11 onwards on the back of a higher demand from infrastructure and construction sectors. As we approach the last two years of XIth Five Year Plan, we believe there will be a higher thrust on the infrastructure since the Government plans to spend ~52% of the target expenditure in the last two years. Buoyant order book of construction companies also indicate that construction activities will pick up in the near future. On the back of the firm demand from the user industry, we expect the demand to grow at 8% in FY11, followed by 10.4% in FY12 as well as in FY13. Therefore with the moderating pace of capacity additions and a steady demand growth, we expect capacity utilizations in the industry to gradually improve going ahead. We consider that the pan India capacity utilizations will improve to 81% in FY12 only to better to 85% in FY13. However, we expect a dip in capacity utilizations in monsoons of FY12 (Q2 & Q3 of FY12). Pricing : The worst seems to be over We believe that in terms of pricing, the worst is behind us. A gradual improvement in utilization levels on the back of an enhancement in cement demand (supported by an increase in cost of production) will prevent a sharp fall in prices in future. We believe, Q2FY11 is likely to be the worst quarter for cement producers as low cement prices in Q2FY11 had resulted in a negative EBITDA/tonne for some Southern
Elara Securities (India) Private Limited
players and an RoCE of well below WACC for majority of players. Therefore, we expect things to perk up going ahead as cement companies are likely to opt for price increases rather than higher volumes. Earnings of cement companies are more sensitive to pricing changes (~4% variation with 1% change in pricing) than volume changes (~2% change with a 1% change in volume sales). Due to the mature behavior of cement players, prices have already gone up by INR20 -100 per bag in the past two months. Further, discount in the cement price in trade and non-trade has also been reduced from INR40 per bag to INR20/bag. We believe, the concerted action of the players might not be a long term phenomenon, but with improving capacity utilizations and a strong cost push, cement prices might have a little downside from the current levels. We have built in our estimates, a price increase of ~INR25/bag in H2FY11 from Q2FY11 levels. For FY12, we have built in a decline of ~INR17/bag over H2FY11 levels (On annual basis, our cement prices for FY12 are 23% higher than FY11).
Cement
Cement
Scenario to look up from FY13; Upcycle a year away As discussed earlier, we expect utilizations to gradually improve from FY12 before reaching a level of 85% in FY13. The demand on the other hand, is expected to grow at a steady pace after suffering hiccups in the first half of FY11. The XIth 5 Year Plan envisages an investment of INR 10,750 bn with a focus on infrastructure activities which will ensure a steady demand growth for cement. Therefore, we believe that the stable pace in demand and lack of strong capacity additions will create a healthy cement market in the country. Little upside in large caps, value lies in midcaps For valuation of cement companies, we have used EV/tonne based methodology as the earnings based valuations have historically failed to provide a fair picture of the stock performance. The entire large cap pack is already trading at a premium to its replacement cost as well as close to its peak cycle EV/tonne valuations. As we believe, the upcycle is still one year away, for valuing large cap players, we have discounted the average bull cycle EV/tonne multiples at a WACC of 13%. However, for mid cap players, we have used a distress case EV/tonne valuation of USD62/tonne, considering the regional risk. Historically, mid cap players have traded at a discount to the large cap peers as the profitability of mid caps too was lower than their large cap counterparts. But due to the cost cutting initiative undertaken by mid cap cement 3
Cement players, the EBITDA/tonne discount of these companies has gone down from 63% in the last down cycle to 10% in FY10. However, the valuation gap has increased from 30% to 56% during the same period. We believe that the sharp valuation gap between frontline and midcap cement companies is unjustified. Hence, we believe the mid cap players offer more upside than their large cap peers while the risk reward ratio is more favorable to mid caps as these are trading at a significant discount to their large cap peers as well as the replacement cost of cement assets. We initiate our coverage on large cap cement stocks with Accumulate rating on ACC (TP: INR1,123;Upside:6% ) Sell rating on Ambuja (TP: INR119;Upside:-20% ) and Reduce on UltraTech (TP: INR1,1139; Upside: 2% ). Considering
the potential upside, the IPL franchise might hold for India Cements, we initiate our coverage with a Accumulate recommendation (TP: INR136; Upside: 13%). We have considered the minimum bid price for Indian Premier League (IPL) 4 franchise as a valuation for Chennai Super Kings team. Any upside in the same will warrant an upside for the India cements stock. We continue to maintain our Buy rating on Orient Paper (TP: INR87; Upside: 42%), JK Lakshmi (TP: INR78; Upside: 24% ), JK Cement (TP: INR220; Upside: 31%), considering the below distress case valuations the stocks are currently trading at and the favorable risk reward ratio these stocks offer. We have assigned Accumulate rating on Shree Cements (TP: INR2,501; Upside: 16%), taking into account its superior fundamentals and low valuations.
4
Elara Securities (India) Private Limited
Cement
The worst is behind us
Capacity addition in listless mode Riding on the firm cement prices during the FY06 to FY08, cement companies had generated huge operating cash flows. The period witnessed a demand growth of ~10% CAGR, matched by only ~6% CAGR in capacity additions. The increased capacity utilizations during the period augured well for a high cement pricing regime. Cement prices in fact surpassed the inflation during the period. Exhibit 1: Cement prices shoot up during FY06-10
(INR per bag)
260 220 180 140
2009-10
2008-09
2007-08
2006-07
2005-06
2004-05
2003-04
2002-03
2001-02
2000-01
1999-00
1998-99
1997-98
1996-97
1995-96
1994-95
100
Source: CMA, Elara Securities Research
On the back of huge increase in the operating cash flows and favorable demand supply scenario, the industry lined up huge capacity addition programs. As was evident, the country witnessed highest capacity additions during FY09 and FY10. The country added a total capacity of ~63 mn tonnes in these two years. Exhibit 2: Operating cash flows step up in FY07-10 50 Strong operating cash flows generated by the industry
(INR bn)
40 30
in the domestic cement market in the medium term. Hence, companies have been cautious in going ahead with the cement capex which curtailed the pace of capacity additions in the country. Some of the cement companies (like Shree Cement, JK Lakshmi and Orient Paper) have utilized their accumulated cash flows to diversify into other businesses like merchant power. This was reflected in the capacity addition announcements as the industry passed the euphoria stage. Besides the land acquisition, procedures related to forest as well as environment clearances are likely to delay the implementation of the already announced greenfield projects. Even brownfield projects have faced delays of at least three to six months as seen by the precedents. After record nameplate capacity additions of ~35mn tonnes in FY10, the industry is expected to add ~29mn tonnes in FY11 followed by ~24 mn tonnes in FY12 and 17 mn tonnes in FY13. Going forward, the industry will add another ~46 mn tonnes of capacity over next 32 months (ie: from August 2010 till March 2013), putting the total capacity at 318 mn tonnes by the end of FY13. So considering the slowing pace of capacity additions, increasing timelines for completion of greenfield as well as brownfield projects and the current depressed profitability enjoyed by the sector, we believe the capacity additions will not reach the peak levels of FY09 to FY11. We believe any new plant announcement will take at least two years (for brownfield) and at least three to four years (for greenfield) to come on stream. Therefore, we believe the demand supply equations will improve only gradually. Exhibit 3: Capacity addition - Missed deadlines Company
20 10
Orient Paper
Capacity Type (mn tonnes) 2.4
FY10
FY09
FY08
FY07
FY06
FY05
FY04
FY03
FY02
FY01
FY00
Source: Capitaline, Elara Securities Research
The higher capacity additions coupled with financial slowdown, led to subdued cement pricing. With such a subdued cement pricing and high cost regime, operating cash flows of cement companies have been under pressure since FY10. Despite a steady growth in the demand, the oversupply scenario has become inevitable Elara Securities (India) Private Limited
Madras Cement GrasimShambhupura:
State
Initial Actual timeline
Brownfield Maharashtr Mar-10 a /Andhra Pradesh
Sep-10
4,000 TPD Brownfield Jayanthipur Sep-09 kiln. am
Jan-10
0
Cement
Capacity additions decline as unfavorable pricing, land acquisition issues crop up Demand subdued in H1FY11; to firm up from H2FY11 on higher infra spend Large caps not attractive, but mid caps in favorable risk reward zone
4.4
Brownfield Rajasthan
Q4FY08 Q1FY10
Clinker
Q4FY08 Q2FY09
Grinding
Q4FY08 Q1FY10
Source: Elara Securities Research
5
Cement Exhibit 4: Capacity addition momentum down 18
Pace of capacity addition slows down
300 250
15 12
200
9
150
6
100
Effective capacity (LHS) Increase in effective capacity (RHS)
FY13E
FY12E
FY11E
FY10
FY09
FY08
FY07
FY06
0 FY05
3
0 FY04
50
(Million s tonnes)
(Million tonne s)
350
prices crashed in Hyderabad and Chennai, down from the peak by ~40% and 35% respectively in Aug’10 before recovering sharply in month of September and October. Due to the oversupply scenario in the region and reduced profitability of cement players, the pace of new capacity additions has slowed down. Hence, out of new capacities that are expected to hit the market by FY13, the share of South has reduced to mere 25%. Hence, we believe capacity utilization in South will increase to 77% in FY13. Exhibit 6: Capacity adds more secular by FY13 North 22%
South 25%
Source: CMA, Elara Securities Estimates
South to witness massive capacity additions The new supply coming on stream has been skewed towards the Sothern region due to huge limestone reserves, strong demand growth between FY06 to FY09, particularly in Andhra Pradesh (South grew at a CAGR of 12.8%, Andhra Pradesh grew at CAGR of 20.4%), and larger size of the market (south is the largest market in India and even bigger than Russia, Brazil. Japan, and South Korea). Exhibit 5: South faces brunt of excess supply North 26%
East 10%
West 7% Central 6%
Source: CMA, Elara Securities Research
During Apr’08-Aug’10, a whopping 51% of new capacities that came on stream were in South India. Due to such massive capacity additions, utilizations in South has declined from 94% in FY08 to 74% in FY10. Cement
6
Central 20% Source: Elara Securities Estimates
Exhibit 7: Region wise capacity additions (mn tonnes) Year end capacity FY10
North Eastern Southern
Western Central
All India
54
35
93
37
29
247
13.8
2.2
9.3
1.0
3.0
29.1
FY11
68
37
102
38
32
276
+Capacity additions
1.8
2.1
8.3
5.9
6.4
24.4
FY12
70
39
110
43
38
301
+Capacity additions
4.5
4.8
2.5
2.5
2.9
17.2
FY13
74
44
113
46
41
318
Total
20.0
9.0
20.0
9.0
12.0
71.0
+Capacity additions
South 51%
West 18%
East 15%
Source: Elara Securities Estimates
Elara Securities (India) Private Limited
Cement Demand to quicken from H2FY11
We believe the cement demand will accelerate from H2FY11 onwards, driven by infra spend and a recovery in the real estate sector. We believe the last two years of the current Five Year Plan (FY11 and FY12) will provide enough impetus to infrastructure investments. Similarly, higher residential as well as commercial construction activities backed by Government schemes like Indira Away Yojana (IAY) and Interest Subsidy scheme will consume higher cement in the next two years to come. As we approach the last two years of XIth Five Year Plan (FY11 & FY12), we expect nearly INR10,750bn to be spent on infrastructure activities. The total planned expenditure of the entire XIth Plan is INR20,562bn and nearly 52% of the same will be spent in the last two years. Hence assuming that only 70% of the target expenditures materialize in the last two years (FY11 & FY12) of the Plan, we expect cement demand of ~154mn tonnes to be generated due to infrastructure activities. Exhibit 8: Infra spending to sustain high consumption 12,000
8,000
6
7
7
8
9
10 10 10 10
12 10 8 6
(%)
FY17E
FY16E
0 FY15E
0 FY14E
10
FY13E
50
FY12E
20
FY11E
100
FY10
30
FY09
150
Projected cement demand (LHS) % of total Infra spending projected each year (RHS) Source: Planning Commission, Elara Securities Research
Exhibit 10: Share of infra in total demand to go up Projected cement demand from infra (mn tonnes)
Total projected cement demand (mn tonnes)
% of total
FY11E
69
216
32
FY12E
85
238
36
FY13E
92
263
35
Year
Source: Planning Commission, Elara Securities Research
A sizable chunk of these infrastructure investments has been on roads in these five year plans. The Government has planned to invest INR3,141.5bn (USD69.8bn) on roads and bridges in the XIth Five Year Plan. Of the total investments, ~47% is planned to be spent in the last two years (FY11 and FY12) of the plan. A major thrust has been on building national highways which consume higher cement than other roads. A sum of 22,921km of national highways are being planned to be built in three years from FY10 to FY12. We believe, the average execution per day of national highways will increase as we approach the end of the XIth Plan. According to our infrastructure analyst, the execution per day is likely to be ~15.2km/day in FY11 which will increase to 16.8km/day in FY12 and 19.2km/day in FY13.
4
XIth Plan: Investments in road sector
4,000
2
Exhibit 11: Roads to gather momentum (INR bn)
2,000
0
INR bn
FY17E
FY16E
FY15E
FY14E
FY13E
FY12E
FY11E
FY10
FY09
6,000
FY08
(INR bn)
10,000
9
40
Investment in infrastructurein (LHS) Investment as % of GDP(RHS)
Centre
State
Private
Total
FY08
183.2
175.3
159.7
518.2
FY09
194.5
181.5
171.9
547.9
FY10
206.7
188.9
196.4
592.0
Source: Planning Commission, Elara Securities Estimates
FY11E
226.2
206.1
251.4
683.7
In the XIIth Five Year Plan, the Government has planned to spend ~INR40,750bn on infrastructure activities. Hence even post FY12, we expect the infra related cement consumption to remain strong.
FY12E
263.0
248.2
288.5
799.7
Elara Securities (India) Private Limited
Cement
Scenario brighten up on infra, real estate push
200
FY08
After reporting an impressive growth of 10.1% in FY10, the cement demand has decelerated to only 4.8% YoY in Apr –Sep’10 period due to seasonal weakness and a higher base. The delayed monsoons last year accounted for the higher base in Q2FY10 as compared to the Q2FY11 consumption. Apart from this, flood like situation in few states and near completion of some of the major projects (such as Common Wealth) also impacted the cement demand.
(mn tonne)
First two quarters register below average growth
(%)
Exhibit 9: Infra-related spending to be strong
Total
3,141.5
Source: Planning Commission, Elara Securities Research
7
Cement
460
8.7
440
FY11E
15.2
420
FY12E
16.8
FY13E
19.2
FY14E
19.5
360
FY15E
16.1
340
FY16E
4.5
FY17E
1.6
4,500 4,000
400
3,500
380
3,000
Exhibit 16: Real estate revenues recover 40
1050
Exhibit 14: Build-up in order-book seen for majors
1000 (INR bn)
3.4
3.2 3.1
3.2
950 900
2.8
2.8
2.2
Sep-10
Jul-10
May-10
Mar-10
Jan-10
Nov-09
Sep-09
2.4
Jul-09
2.6
May-09
850 2.5
Mar-09
Order book to sales ratio(x)
Q1FY11
Exhibit 17: HDFC’s loan book remains buoyant
Source: CMIE, Elara Securities Research
2.4
Q4FY10
Source: Capitaline, Elara Securities Research
New order during the quarter (LHS) Total order book (RHS)
3.0
Q3FY10
1,000 Q1FY10 Q2FY10 Q3FY10 Q4FY10 Q1FY11
Q2FY10
0
Q1FY10
0 Q4FY09
1,500
10
Q3FY09
100
20
Q2FY09
2,000
(INR bn)
200
30
Q1FY09
(INR bn)
2,500
26-Feb-10
The real estate sector is also showing signs of recovery which has been visible from the revenue trends of real estate majors which has increased 65% YoY in Q1FY11. The credit flow to the housing sector also indicates improvement in the housing volume. An indication of this can be seen from the Q2FY11 outstanding loan book of HDFC Limited which was up 19% YoY.
300
Infrastructure(RHS)
Source: CMIE, Elara Securities Research
(INR bn)
3,000
20-Nov-09
22-May-09
Construction(LHS)
Exhibit 13: Construction order book on an uptick 400
21-May-10
2,500
Source: Planning Commission, Elara Securities Estimates
Leading indicators show that construction activities will pick up sharply in years to come. The total outstanding order book of the major construction players was up 40% YoY at the end of Q1FY11. The order book to bill ratio has also been consistently on an uptrend. At the end of Q1FY11, the average order book to bill ratio of major construction players stood at 3.2x (as compared to last year’s average of 2.4x). Furthermore, credit flow to construction and infrastructure sectors has shown a positive trend. As of 22nd May, 2010, the total loans outstanding to construction and infrastructure sectors were up (YoY) 16% and 44% respectively.
(INR bn)
KM/day
FY10
(INR bn)
Average Execution per day
Exhibit 15: Credit flow to infra, construction soars
28-Aug-09
Exhibit 12: Execution visibility high till FY15
Source: HDFC, Elara Securities Research
Q1FY10
Q2FY10
Q3FY10
Q4FY10
Q1FY11
Source: CMIE, Elara Securities Research
8
Elara Securities (India) Private Limited
Cement
Exhibit 18: Shift to Pucca houses gathers speed Year
Households Total Housing (mn) Stock (mn)
Pucca Semi-pucca (mn) (mn)
Kutcha (mn)
1961
14.9
13.3
6.44
4.9
1.96
1971
19.1
18.5
11.8
4.35
2.35
1981
29.3
28
18.09
6.8
3.11
1991
40.7
39.3
29.79
6.21
3.3
2001
55.8
50.95
41.17
8.08
1.7
Source: Planning Commission, Elara Securities Research
The private sector has also maintained its capex buoyant. At the end of Q1FY11, value of projects under implementation in the private sector stood at 59 trillion, up by 17% (YoY). Exhibit 19: Pvt capex growing rapidly 59
60 55 (INR trillion)
55 50
50 45
51
52
53
44
Exhibit 20: Cement to GDP multiple to stay constant
20
4
r=0.94
15
3
10 5 0
2 1.11.51.02.01.22.4
1.72.30.71.11.11.01.11.21.4
(0.4)
0 (1)
FY95 FY96 FY97 FY98 FY99 FY00 FY01 FY02 FY03 FY04 FY05 FY06 FY07 FY08 FY09 FY10
(5)
1
Cement consumption growth to GDP multiple (RHS) GDP Growth (LHS) Cement Consumption Growth (LHS)
Cement
Avg. GDP to cement consumption multiple of last 15 years is 1.3X GDP YoY Growth(%)
With the Government’s extension of the 1% interest subvention on a housing loan of INR1mn (where the cost of the house does not exceed INR2mn) and increased spending in the Rajeev Awaas Yojana (RAY) by 700% from the last the financial year to INR12.7bn for FY11, we believe that housing demand will continue to remain strong in rural areas.
have depended upon the GDP multiplier factor to estimate the cement demand in the country. For the last five years, the cement consumption in India has grown at an average multiplier of 1.3 x GDP growth. Over the past ten years, the same has shown a growth of 1.1x GDP, which was due to a negative growth in cement consumption in FY01.
Cement consumption to GDP Multiple
Past trends indicate that with rising income levels, people are shifting from semi-pucca and kutccha houses to pucca houses which create demand for cement. Besides, incentives provided by the Central as well as state Governments are likely to provide an impetus for the rural and semi-urban housing. The Planning Commission estimates a growth of ~4% CAGR (2001 to 2012) in pucca houses denoting higher cement consumption. Central Government initiatives like Indira Away Yojana (IAY) and several state Government initiatives like construction subsidy (Gujarat, Himachal Pradesh, Punjab, Jharkhand etc) have provided incentives for pucca houses which is evident from the trends witnessed in the past.
Source: CMA, CMIE,Elara Securities Research
Considering the slowdown in the cement demand due to factors mentioned earlier in this report, we have used the GDP multiplier of 1.0x for FY11. However, taking into account the fact that we are approaching last two years of XIth Plan and the buoyant activities expected in the commercial as well as residential construction spaces, we have relied on a multiplier factor 1.3x GDP for estimating the demand growth in FY12 and FY13. Accordingly, we expect the cement demand to grow by 8% in FY11 and 10.4% in FY12 -FY13 period. Hence, we estimate the cement consumption to reach a level of 263mn tonnes by the end of FY13, registering a CAGR of 9.6% over the next three years. Exhibit 21: Demand estimates at different multiples Real GDP YoY growth (%)
FY11E
FY12E
FY13E
8.0
8.0
8.0
Bull Case Multiple Cement to GDP Multiple (x)
1.2
1.5
1.5
Cement Demand growth (%)
9.2
12.0
12.0
Capacity utilization (%)
81
83
88
Cement to GDP Multiple (x)
1.0
1.3
1.3
Cement Demand growth (%)
8.0
10.4
10.4
Capacity utilization (%)
80
81
85
Base case Multiple 40 Dec-08 Mar-09 Jun-09 Sep-09 Dec-09 Mar-10 Jun-10 Source: CMIE, Elara Securities Research
Bear Case Multiple
Domestic demand to grow at a CAGR of 9.6%
Cement to GDP Multiple (x)
0.9
1.1
1.1
Historically, the cement consumption has shown a strong direct co-relation with the country’s GDP growth. The correlation between the two was as high as 94% between FY05 to FY09. Due to lack of reliable data, we
Cement Demand growth (%)
6.8
8.8
8.8
Capacity utilization (%)
79
78
81
Elara Securities (India) Private Limited
Source: Elara Securities Research
9
Cement Capacity utilization rebound in FY12
Exhibit 25: Monsoon utilization to remain low 90
93
90
89
90 85
89
87
83
80
82
84
81
79
75
74
70
81
78
76
Q3FY13
Q1FY13
Q1FY12
Q1FY11
Q3FY10
Q1FY10
65
Q3FY11
69 Q3FY12
95
(%)
In first eight months of CY10 (Jan- Aug’10), the industry added 38mn tonnes of capacity, (16.4% increase over CY09). However, during the same period (Jan- Aug’10) cement demand grew by only 6.3%. Considering the demand slowdown in FY11 and higher capacity additions in the last two to three years, we expect capacity utilizations to come down to 80% (7-year low) from 86% in FY10. However, we expect the demand to revive in FY12 and FY13 and with the slowing down pace of capacity additions, we expect utilizations to improve to 81% in FY12 and 85% in FY13. Exhibit 22: Capacity utilization: Gradually improving
Source: CMA, Elara Securities Estimates
All India Year end capacity Effective Capacity Dispatches Capacity utilization (%)
Pricing: Downside remains limited
FY13E 318 310 263 85
Source: CMA, Elara Securities Estimates
Quarter wise analysis Due to the sharp increase in supply and moderate growth in demand, capacity utilization of the industry has declined from 90% in Q4FY10 to 69% in Q2FY11, lowest since Q2FY99. We expect capacity utilization to improve in FY12 except the monsoon period when we anticipate the same to drop to 74% in Q2FY12 and 76% in Q3FY12. However, we see the same to remain close to 80% levels or above in the FY13. Exhibit 23: Peak capacity addition behind us 10
Exhibit 26: ACC: Higher costs pump up realizations
% increase in capacity (RHS)
60 50
All India Cement Despatches (LHS)
Q3FY13E
Q1FY13E
Q3FY12E
Q1FY12E
Q3FY11E
Q1FY11
Q3FY10
Q1FY10
40
Cost
Source: Capitaline, Company, Elara Securities Research
(%)
(Mn tonnes)
Relisation 18 15 12 9 6 3 0
CY09
FY96
Exhibit 24: Steady growth in cement dispatches 70
2,000 1,500
Source: CMA, Elara Securities Estimates
80
2,500
CY08
Capacity addition (LHS)
3,000
CY07
0
CY06
0
3,500
CY05
2
FY05
5
4,000
FY04
4
FY03
6
10
Q1FY10 Q2FY10 Q3FY10 Q4FY10 Q1FY11 Q2FY11 Q3FY11E Q4FY11E Q1FY12E Q2FY12E Q3FY12E Q4FY12E Q1FY13E Q2FY13E Q3FY13E Q4FY13E
15
FY02
8
FY01
(Mn tonnes)
20
12
(INR per tonne)
Capacity additions bunch up in H1CY10
25
Prices of key raw material (imported coal as well as petcoke) have been on a consistent uptrend. Diesel prices have recently gone up thereby raising the transport cost for players. Hence we believe the cost push factor will arrest the cement pricing fall as we go ahead. Historical data too indicates that higher costs have supported higher cement prices.
(%)
30
We believe the actual cement pricing will depend upon the demand supply equations in the region, actual cost of production and players’ individual as well as consolidated actions. However, we anticipate the downside for cement prices to be restricted mainly due to the rising cost of production, increasing levels of consolidation in the industry, better financial position of the industry players and the bettering demand supply equations post H2FY12.
FY00
FY12E 301 296 238 81
FY99
FY11E 276 270 216 80
FY98
FY10 247 232 200 86
FY97
FY09 212 205 181 89
YoY (RHS)
Source: CMA, Elara Securities Estimates
10
Elara Securities (India) Private Limited
Cement
1,500
an average net debt equity ratio of ~2.6x in FY03 when the industry witnessed a steep ~7.4% price decline. The last few years of the `Bull Run’ had transformed the balance sheets of these companies which now have 0.4x debt equity ratios. Besides, the companies are almost in the final leg of their capacity additions which might not put a stress on the operating cash flows for the company in the period of stress.
1,000
Exhibit 30: Industry’s balance sheet improves
4,000
3,000 2,500
CY09
CY08
CY07
CY06
FY05
Cost (x) INR per tonne
Limestone Royalty
20
Increase in other raw material cost
45
Fuel
138
Electricity
41
Freight
54
Excise duty
83
Total
380
Source: Elara Securities Estimate
The consolidation levels in the industry have increased as compared to the last downcycle with top five players now controlling close to ~54% of capacities as compared to 31.3% in 2000 (the last downcycle). The consolidated action of players was visible recently in South where despite lowest capacity utilizations in the region, cement prices increased in the range of INR75 – 100/bag. Historically as well, benefits of consolidation were witnessed in the Northern region, where players resorted to lower production to control the prices during the initial part of FY09. Hence, we believe, the increased consolidation in the industry will negate any significant price falls in the cement industry. Exhibit 29: Industry consolidation increases 100
(%)
60
46.0 68.7
40 20
54.0 31.3
0 FY2000 Share of top 5 players
At present Others
Source: CMA, Elara Securities Research
Besides, the companies have better balance sheets now as compared to the earlier downturn. The industry had
Elara Securities (India) Private Limited
15
2.0
10
1.5 1.0
(%)
Exhibit 28: Reliance on imported coal to increase cost
80
20
2.5
Source: Capitaline, Company, Elara Securities Research
Cost Item
3.0
5
0.5
0
0.0 FY95 FY96 FY97 FY98 FY99 FY00 FY01 FY02 FY03 FY04 FY05 FY06 FY07 FY08 FY09 FY10
Realizations
CY05
FY04
FY03
FY01
FY00
FY99
FY98
FY97
2,000
FY96
(INR per tonne)
3,500
Net debt equity ratio (LHS) % increase in Effective Capacity (RHS)
Cement
Exhibit 27: Ambuja: Costs inflate realizations
Source: CMA,Capitaline, Elara Securities Research
We have tried to compute the cement pricing based on the minimum RoCE the players would desire in the coming years. Accordingly, we have considered Southern companies to desire at least 8% (equal to risk free rate of return) RoCE in the years to come considering the looming oversupply concerns in the region. Similarly, we have assumed a desired RoCE of 12% for Western players as excess capacities in the Southern market are likely to spoil equations in the Western region. In the northern region, we have assumed desired RoCE of 10% considering the possible slowdown in demand post the Common Wealth Games. Apart from this, among the major regions, Northern region is expected to witness the second highest capacity addition (ie: 22%). For the Eastern as well as Central regions, we have assumed the highest desired RoCE of 14% as the demand supply equations in these regions are likely to be more favorable as compared to other regions in the country. Accordingly, the prices are expected to rise the most in the Western region, where the prices were depressed due to spillover effect of low prices in Southern region. However, we expect the pricing in the Eastern region to remain flat as the same had not declined sharply. We expect the prices in the Southern region to have risk of downside than upside considering the unfavorable demand supply equations and the quantum of hikes taken recently. For rest of the country, we expect prices to increase ~4% in the coming years. Despite higher cement prices, the profitability of cement players may come under pressure in Q2 and Q3FY12 when the capacity utilization is expected to reach 74% 11
Cement and 76% respectively. Post these quarters, the capacity utilization is expected to bounce back in Q4FY12 to 89%. Exhibit 31: Cement prices bounce back
(INR per bag)
330 280 230 180
Mumbai Chennai
Delhi Hyderabad
Oct-10
Jun-10
Aug-10
Apr-10
Feb-10
Oct-09
Dec-09
Jun-09
Aug-09
Apr-09
Feb-09
Dec-08
Oct-08
Jun-08
Aug-08
Apr-08
130
Kolkata
Source: CMIE, Elara Securities Research
Exhibit 32: Implied cement price increase from RoCE (%)
The nature of the cement industry does not provide any barriers to entry; companies gain an edge over peers due to the inherent characteristics like plant location, sourcing of key raw material and capital structure etc. We have tried to analyze few of the key parameters which have a significant bearing on the profitability of these companies. We have tried to rank the large cap companies on different parameters with 1 being lowest and 3 being the highest rating. Regional presence: The cement industry is characterized by regional demand supply as it is uneconomical to transport cement over long distances, being a low priced commodity. Our analysis shows that if cement companies transport outside the radius of ~1,000- 1,200 kms by rail and/or road, these players would not be making profits at the EBITDA level. Therefore, the regional demand supply equations play an important role in the pricing dynamics and profitability of the cement players.
INR
South Central
East
West
North
Realization per tonne (present)
4,292
3,712
3,644
3,570
3,661
Greenfield capex cost per ton
5,000
5,000
5,000
5,000
5,000
400
700
700
600
500
Average Q1FY11 EBITDA/tonne prior to Freight expenses
8.0
14.0
14.0
12.0
10.0
Transport cost per tonne per km by road
100
100
100
100
100
Maximum distances viable by road
Cost (inc dep) per tonne
2,949
3,096
2,672
2,979
3,108
EBIT / tonne
1,343
617
972
591
553
26.9
12.3
19.4
11.8
11.1
Implied Realization per tonne
3,349
3,796
3,372
3,579
3,608
Implied price change (INR)
(943)
83
(272)
9
(53)
% change
(22.0)
2.2
(7.5)
0.2
(1.5)
72
98
89
84
85
Cost (inc dep) per tonne
3,244
3,158
2,806
3,128
3,263
EBIT per tonne
1,048
555
838
442
398
15.1
10.9
15.0
7.4
6.8
Implied Realization per tonne
3,937
3,869
3,595
3,797
3,822
Implied price increase (INR)
(355)
157
(49)
228
161
(8.3)
4.2
(1.3)
6.4
4.4
Target EBIT/tonne Target RoCE(%) At Capacity utilization (%)
RoCE(%)
Comparative analysis
At Capacity utilization (%)
RoCE(%)
% change
Exhibit 33: EBITDA neutral lead distances
Transport cost per tonne per km by road
Source: Elara Securities Estimates
Maximum distances viable by rail
1,506 1.5 1,004 1.35 1,115
Source: Elara Securities Estimates
We expect the capacity utilization in the South to decline from 74% in FY10 to 69% in FY11 due to an increase in capacity and subdued demand. However, this situation is likely to improve to 72% in FY12 and 77% in FY13 due to the slower pace of capacity additions. Despite improving capacity utilizations, the same will be the lowest in the Southern region hence, we prefer companies having minimum presence in this region. In the case of East, we expect the capacity utilization to increase from 86% in FY10 to 88% in FY11, 90% in FY12 and 93% in FY13. The capacity additions in this region have been low while the demand has remained strong. In the Central region, the utilizations are expected to decline due to capacity additions. Capacity utilization is likely to decline from 104% in FY10 to 100% in FY11 and further to 92% in FY12. However in FY13, capacity utilization is expected to improve to 96%.The scenario in the Northern and Western regions might remain close to the all India average.
12
Elara Securities (India) Private Limited
Cement
Exhibit 34: Region wise yearly capacity utilization (%) 110 100 90 80 70 60 FY19 North Eastern
FY10
FY11E
FY12E
Western Southern
FY13E Central All India
83
85
82
82
80 73
75 70 Central Eastern Western All India
North Southern
(Average for FY11-FY13)
Exhibit 36: Region wise capacity break-up (%) North
East South
West Central
UltraTech Cement post merger
26
14
23
26
11
UltraTech Cement pre merger
0
18
35
48
0
Ambuja
42
14
0
37
7
ACC
24
18
36
4
18
India Cements
0
0
92
8
0
Shree Cement
100
0
0
0
0
JK Cement
62
0
38
0
0
JK Lakshmi
88
0
0
12
0
0
0
60
40
0
Orient Paper
Cement
Source: Elara Securities Estimate
Source: Company, Elara Securities Research
Exhibit 37: India Cements leads Southern capacity 100
90
75
60 38
50
35
32
26 0
0
0
JK Lakshmi
Ambuja
UltraTech Cement post merger
ACC
0
Shree Cement
25
UltraTech Cement pre merger
India Cements has the worst regional mix in mid-cap cement companies as ~92% of its capacity is in South India. Players such as Shree Cement and JK Lakshmi Cement have restricted presence in the Northern region. We do not expect Northern region to be hit as badly as the South.
90
90
JK Cement
Due to Ambuja’s superior regional mix in frontline cement players, we have assigned it the highest rating of 3. The other two frontline players UltraTech and ACC too do not have very high regional risk due to pan-India presences. However, due to ACC’s relatively higher capacity in low priced Southern market (ACC has 36% of its capacity in South as compared to 23% for UltraTech), we have assigned it the lowest rating 1 while UltraTech gets a rating of 2.
96
95
Orient Paper
In our coverage universe, Ambuja has the best regional mix as it does not have presence in the Southern region. Apart from this, about 14% of the capacity of the company is in the Eastern region and 7% in the Central region. We expect these regions to have better pricing environments as compared to other regions in India. The average capacity utilization of Eastern and Central region is likely to be ~1,400bps and ~900bps higher than pan India. We expect players having presences in Central and Eastern region to earn ~21% higher EBIT per tonne as compared to players having pan-India presences.
100
India Cement
Due to supply overhang, we expect cement players in the South to earn ~36% lower EBIT per tonne than players in other regions. Players having higher presence in the Southern region will continue to earn lower return ratios and margins as compared to players having presences in other regions.
Exhibit 35: Utilization to stay firm in Central India
(%)
As mentioned earlier, we expect cement prices to remain firm in H2FY11. The price increase is expected to be sharper in the western region, as the prices in western region were depressed by low prices in south. Though among all regions cement prices are highest in the southern region, we expect cement prices in south to fall by 8%.
Source: Company, Elara Securities Research
Power and fuel cost: Power and fuel constitutes 25-35% of the total expenditure for cement manufacturers who mainly use coal and petcoke as fuel for manufacturing cement. The coal is usually sourced from three sources viz linkage coal, open market purchases in domestic market and imports. Prices of petcoke and imported coal are presently hovering around INR7,250/tonne and INR5,175/tonne respectively. Prices of domestic coal vary, depending on its calorific values. Players having presence in the Southern region (particularly Tamil Nadu) are likely to have the cost disadvantage due to higher dependence on imported
Source: CMA, Elara Securities Estimates
Elara Securities (India) Private Limited
13
Cement Exhibit 38: Power and fuel cost per tonne of cement manufactured using different fuels Fuel cost
Electricity Power & Electricity consumption Electricity cost Fuel cost per per tonne tonne of cement (h) (i) J=f+i
(a)
(b)
c=b/a
(d)
kcalry per tonne of cement (e)
f=a*d
Per unit Electricity VC cost INR (g)
Domestic
3,000
4,000
0.75
18.5%
740
555
2.3
85
198
753
Imported
5,175
6,000
0.86
12.3%
740
639
2.7
85
227
866
Pet Coke
7,250
8,000
0.91
8.8%
740
634
2.8
85
239
873
Fuel
INR Per Calorific INR per tonne Values kcalry
Input out put ratio
Fuel cost
Source: Elara Securities Research
coal. As these are located distantly from mines, players with plants in Tamil Nadu (such as India Cements, Madras Cement, Dalmia Cement) are heavily dependent on imported coal.
The price of imported coal has increased 42% YoY due to the improvement in global sentiment while petcoke has also gone up ~100% YoY in line with a hike in crude oil prices. Going ahead, we do not expect the price of pet coke to soften as RIL (the largest manufacturer of pet coke in India) has reduced the sale of petcoke in the open market as it has started using petcoke for captive power and petrochemical products manufacturing. As far as the linkage coal is concerned, Coal India has increased coal prices by ~10% to 11% in Q3FY10. At present prices, we expect power and fuel cost for players dependent on the domestic coal, imported coal and petcoke to be approximately INR753, INR 856 and INR 873 respectively for every tonne of cement produced. The player dependent on domestic coal is likely to have cost advantage of INR 113 per tonne as compared to player using imported coal and INR 121 as compared to player using petcoke. Thus, players dependent on domestic coal such as Orient Paper and ACC are likely to have lowest power and fuel cost per tonne of cement. Historically, petcoke prices (adjusted for differences in the kcalr) have been cheaper by 20-30% as compared to imported coal. However, due to supply disturbances as mentioned above, current prices of petcoke are at a marginal premium to landed price of imported coal. If this premium increases, we expect cement players dependent on petcoke such as Shree Cement, JK Cement and JK Lakshmi Cement to gradually shift towards imported coal.
Exhibit 39: Fuel mix of cement players Imported Petcoke Other P&F cost Coal (%) (%) (%) FY10/CY09
Company
Domestic Coal (%)
UltraTech
62
29
9
0
711
JK Lakshmi
0
0
90
10
633
ACC
85
15
0
0
715
India Cements
45
55
0
0
913
Shree Cement
0
0
100
0
544
JK Cement
10
0
90
0
*903
JK Lakshmi
0
0
90
10
633
100
0
0
0
635
Orient Paper
Source: Company, Elara Securities Research *Higher as compared to peers due to production of white cement
As ACC meets only 15% of its fuel requirements through imports we have assigned it a rating of 3 on this parameter. We have assigned UltraTech 2 rating and Ambuja 1 due to their relatively higher dependence on imported coal (UltraTech 29% and Ambuja 30%). Players dependent on grid for power, such as India Cements, are likely to have cost disadvantage of INR161 per tonne as compared to player dependent on CPP for power such as Shree Cement. Apart from this, players dependent on grid also run the risk of loss of production due to power cuts which have curtailed cement production particularly in the states of AP and TN in last few years during the summer. Exhibit 40: Savings from CPP INR Grid cost
4.5
Average variable cost
2.6
Electricity consumption per tonne of cement Saving per tonne
85 161
Source: Elara Securities Estimates
14
Elara Securities (India) Private Limited
Cement
9
9
37
Shree Cement
97
97
97
JK Cement
83
97
97
Orient Paper
24
94
97
JK Lakshmi
70
95
95
Source: Company, Elara Securities Estimates
In frontline players, UltraTech meets about 90% of its electricity needs through CPP as compared to 68% for ACC and 65% for Ambuja. Thus we have assigned rating of 3 to UltraTech, 2 for ACC and 1 for Ambuja. Transport mix/freight costs: Freight costs constitute ~25– 30% of the total cost of sales for cement companies who normally dispatch through rail and/or road. Rail transport is cheaper as compared to road transport as it warrants a saving of 0.25paise/tonne/km. Assuming an average lead distances of 600kms, the rail transport generates savings of INR150/tonne vis a vis road. Thus in the downturn, when lead distances to market are expected to increase and in the scenario of high crude prices, a player having a higher dependence on rail as a mode of transport such as ACC is likely to have an edge over others. Exhibit 42: Road dominates transport mix (%)
Exhibit 43: OPI least sensitive to price decline (%) 7.5 6.5 4.5 3.5
2.7
2.9
3.4
3.5
5.5
3.8
2.5
Source: Elara Securities Estimates
Fixed cost: Players having lower fixed cost will be betteroff than peers in the downturn as this edge ensures a lower breakeven point. In our coverage universe of large caps, UltraTech has the lowest fixed cost (20%) and ACC has the highest (25%). Thus we have assigned a rating of 3 for UltraTech, 2 for Ambuja and 1 for ACC. In the midcaps, Shree Cement (12%) and OPI (15%) have the lowest fixed cost while JK Cement (24%) has the highest.
Rail
Ultra Tech Cement
62
35
3
Ambuja Cement
55
30
15
ACC
50
50
0
India Cements
46
54
0
30
Shree Cement
77
23
0
25
JK Cement
85
15
0
20
Orient Paper
80
20
0
JK Lakshmi
52
48
0
Exhibit 44: ACC has the highest fixed cost
15
12
19
20
20
22
24
25
15
10 5 Shree Cement
ACC dispatches about 50% of its volume by rail as compared to 35% by UltraTech and 30% by Ambuja. Thus we have assigned rating of 3 to ACC. As Ambuja dispatches about 15% of the cement by sea, we have assigned rating of 2 to Ambuja and 1 to UltraTech.
5.1
5.5
Road
Source: Company, Elara Securities Research
8
8.5
(%)
Sea
In the midcaps OPI (2.7%) and Shree Cement (2.9%) have the lowest earnings sensitivity to price decline while India Cements (8%) has the highest earnings sensitivity.
Cement
India Cements
India Cement
91
ACC
95
83
JK Cement
95
68
JK Cement
65
ACC
JK Lakshmi
Ambuja
India Cement
95
ACC
96
Ambuja
90
Ultra tech
UltraTech
Ultra Tech
CY11/FY12E
Ambuja Cement
CY10/FY11E
JK Lakshmi
CY09/FY10
Shree Cement
% of power meet through CPP
Orient Paper
Company
Earning sensitivity: Lower earnings sensitivity to cement price decline will prevent the earnings of the company from sharp erosion in a downturn. A one percent price change is likely to impact the EPS of Ambuja, UltraTech and ACC by 3.4%, 3.5% and 3.8% respectively. Thus we have assigned a rating of 3 for Ambuja, 2 for UltraTech and 1 for ACC.
Orient Paper
Exhibit 41: Players look for self sufficiency in power
Source: Elara Securities Research
Elara Securities (India) Private Limited
15
Cement
Exhibit 45: Operational parameters Region wise
Volume Growth
Fixed Earning cost sensitivity capacity breakup YoY (%) Company as a Capacity to price % of CY09/ CY10/ CY11/ Domestic Imported Petcoke Other CY09/ CY10/ CY11/ decline North East South West Central sales FY10 FY11E FY12E Coal (%) Coal (%) FY10 FY11E FY12E (%) (%) % of power meet through CPP
UltraTech
90
96
Fuel Mix
95
62
29
9
0
26
14
23
26
11
14
5
12
3.5
20
52
Ambuja
65
95
95
70
30
0
0
42
14
0
37
7
7
6
13
3.4
20
25
ACC
68
83
91
85
15
0
0
24
18
36
4
18
1
(4)
16
3.8
25
31
India Cements Shree Cement JK Cement
9
9
37
45
55
0
0
0
0
92
8
0
20
13
6
8
22
16
97
97
97
0
0
100
0
100
0
0
0
0
21
1
9
2.9
12
14
83
97
97
10
0
90
0
62
0
38
0
0
13
18
15
5.5
24
8
Orient Paper
24
94
96.9
100
0
0
0
0
0
60
40
0
11
21
5
2.7
15
5
JK Lakshmi
70
95
95
0
0
90
10
88
0
0
12
0
14
(9)
12
5.1
19
5
Source: Company, Elara Securities Estimates
Volume growth: We also expect players who have recently completed capacity expansions such as OPI, Ambuja and JK Cement to be better off as volume growth will prevent a sharp erosion in absolute earnings of a company. Players who have not yet completed capacity expansions such as JK Lakshmi Cement are likely to witness a serious decline in earnings due to the subdued volume growth on account of capacity constraints. In the large cap space, Ambuja is expected to report a volume CAGR of 9.4% as in Q1CY10, the company has added two grinding units of 1.5mn tonnes each at Nalgarh (HP) and Dadri (UP). UltraTech is expected to report a CAGR of 8.2% while ACC is expected to report volume CAGR of 5.7% during the same period. Thus, we have assigned 3,2,1 rating to Ambuja, UltraTech and ACC respectively. In mid-cap space, JK Cement is expected to report a strong volume CAGR of 17% as its 3mn tonnes Karnataka plant has come on stream. JK Lakshmi Cement is expected to report lowest volume CAGR of ~1% due to capacity constraints.
EBITDA per tonne As UltraTech is in the process of restructuring, we have looked at FY12 EBITDA per tonne of cement players. In frontline cement companies, we expect Ambuja to earn the highest EBITDA per tonne (INR978) as compared to its peers due to its superior regional mix and operational efficiency. ACC is expected to have an EBITDA per tonne of INR892 due to its cost advantage while UltraTech is expected to earn an EBITDA per tonne of INR 769. Thus, we have assigned rating of 3, 2 and 1 for Ambuja, ACC and UltraTech respectively. Return ratios: Among the frontline players, ACC is expected to earn RoE of 18%-29% between in CY10-CY11 as compared to 17%- 26% earned by others. The superior RoE is enjoyed by ACC on the back of its cost advantage resulting from its higher dependence on domestic coal as a fuel and rail for dispatching cement. Ambuja is expected to have lower ROE than that UltraTech despite higher EBITDA/tonne because of the higher cash on the balance sheet which is earning a lower yield than the core cement business. Thus, we have assigned a 3, 2 and
Exhibit 46: Financial parameters Net debt equity ratio(x) Company UltraTech
CY09/ FY10
CY10/ FY11
RoE(%)
CY11/ FY12
EBITDA per tonne
CY09/ FY10
CY10/ FY11
CY11/ FY12
CY09/ FY10
CY10/ FY11
CY11/ FY12
Q1FY11
MCAP (bn)
0.3
0.3
0.1
26.1
20.9
18.4
979
832
769
792
310
Ambuja
(0.2)
(0.2)
(0.3)
20.1
18.8
16.8
993
1,061
978
1,108
226
ACC
(0.2)
(0.1)
(0.3)
29
18.5
17.9
1,117
888
892
1,115
200
0.7
0.5
0.4
10.5
5.2
7.8
758
494
833
376
36
India Cement Shree Cement
0.1
0.1
(0.3)
49.2
19.4
24.1
1,364
907
863
1,027
75
JK Cement
0.9
0.7
0.6
22.6
6.5
10.8
964
535
568
668
12
Orient Paper
0.6
0.1
(0.1)
22.6
23.2
19.7
892
879
785
887
12
JK Lakshmi
0.2
0.3
0.4
27.2
11.6
13.8
925
710
857
551
8
Source: Company, Elara Securities Estimates
16
Elara Securities (India) Private Limited
Cement
Cement
Exhibit 48: ACC: EV/EBITDA (x) and RoCE (%) EV/EBITDA is the highest when the return ratio is the lowest - which is a theoretical sign to sell shares 30
18
9
15
6
10
3
5
0
0
EV/EBITDA(LHS)
CY06
CY08
20
FY05
25
12
FY03
15
FY01
In frontline cement companies, Ambuja and ACC are expected to have net cash on balance sheets between CY09 to CY11. Thus, we have assigned Ambuja and ACC rating of 2. UltraTech, though is not likely to have a stretched balance sheet, with a comfortable net debt equity ratio of 0.3x in FY10, it is placed a notch below the rest. Considering the same, we have assigned UltraTech rating of 1.
Traditionally, earnings based valuation ratios have failed to time the cement cycles correctly. As is evident from the chart, the peak EV/EBITDA multiple made a good case to buy the stock and vice versa. Hence, we believe, the EV/tonne is a better representation of the valuations of companies in the volatile cement sector.
RoCE(%)
Balance sheet: We believe that as the industry enters the downturn phase, players having a healthy balance sheet will be better off than others. Lower debt equity ratio will not only reduce the interest and principal repayment burden on cash flows but will also enable the company to take advantage of any distress opportunities that might be available.
Earning based valuation irrelevant for industry
FY99
By the end of FY11, UltraTech will have capacity of ~52.4 mn tonnes (globally 9th largest) and will be 1.7x of ACC and 2.1x of Ambuja. Thus, we have assigned the highest rating to UltraTech on this parameter. We have assigned rating of 3, 2 and 1 to UltraTech, Ambuja and ACC respectively. In our midcap coverage universe, Shree Cement and India Cements are mid-size player who will have a capacity of close to 15.6mn tonnes and 13.5 mn tonnes by end of FY11.
FY97
Size: The larger size provides the benefit of economics of scale, pricing power and a bigger balance sheet to comfortably fund major projects.
FY95
In the midcap space, Shree Cement is expected to earn RoE of 19% in FY11 while Orient Paper is expected to earn 23%. These players are expected to have a superior ROE due to their low cost structure, diversfied revenue stream and volume growth due to completion of expansion. JK Lakshmi is expected to have lowest ROE i.e 11.6% (13.6% adjusted for CWIP) due to a sharp decline in earnings on account of subduded volume growth and funds getting blocked in CWIP.
Conclusion: Thus, in the environment of high energy prices, we believe that players dependent on rail for transport such as ACC and players dependent on domestic coal such as Orient Paper will be better off than players dependent on imported coal (such as India Cements ) and petcoke (such as JK Cement and Shree cement). We also believe that in the case of a downturn, players having a lower debt equity ratio such as ACC, Ambuja and Shree Cement will be better off than those with a higher ratio such as India Cements and JK cement. Lower debt equity ratio will help reduce the pressure on a companys opertaing cash flows to serve the interest and principal.
EV/EBITDA(x)
1 rating to ACC, UltraTech and Ambuja respectively.
RoCE(%)(RHS)
Source: Capitaline, Elara Securities Research
In the mid-cap space, only India Cements and JK Cement are likely to have debt equity ratio of more than 0.5x. Rest of the mid-cap spectrum is likely to have a healthy balance sheet. Exhibit 47: Vital statistics of frontline cement players Region
Fuel mix
CPP
Transport mix
Balance sheet
Earning sensitivity to price decline
Fixed cost
Volume growth
EBITDA per tonne
RoE
Size
Total
ACC
1
3
2
3
2
1
1
1
2
3
2
21
Ambuja
3
1
1
2
2
3
2
3
3
1
1
22
UltraTech
2
2
3
1
1
2
3
2
1
2
3
22
Note: 3 indicates the best. As we have given equal weight to all parameters we have just added the score At end of CY11 Acc and Ambuja both are expected to have same net debt equity ratio we have assigned 2 rating to both on balance sheet strength parameter Source: Company, Elara Securities Research
Elara Securities (India) Private Limited
17
Cement
EV/EBITDA(LHS)
50
40
40 30
30
20
20
10
(%)
(x)
50
10
0
0 CY08
CY06
FY05
FY03
FY01
FY99
FY97
FY95
(10)
RoE(RHS)
Source: Capitaline ,Elara Securities Research
Exhibit 51: ACC: Cash P/E (x) and Mcap (INR bn) 2.5
40
2.0
30
1.5
20
1.0
10
0.5
0
0.0 CY08
CY06
FY05
FY03
FY01
FY99
FY97
FY95
(INR bn)
P/CEPS(x)
50
Mcap (RHS)
Source: Capitaline ,Elara Securities Research
250
60
200
40
150
20
100
(%)
Exhibit 52: ACC: EV/tonne, RoE and RoCE (USD per tonne)
0
50 0 CY08
CY06
FY05
FY03
FY01
FY99
FY97
(20) FY95
0
0
EV/Tonne in USD (RHS)
Mid cap vs large cap: Valuation gap widens
Exhibit 50: ACC: Cash P/E (x)and RoE(%)
EV/Tonne in USD (LHS) RoCE (RHS)
50
Source: Capitaline, Elara Securities Estimates
Source: Capitaline ,Elara Securities Research
P/CEPS(LHS)
50
Market Cap (LHS)
Market Cap
P/CEPS(LHS)
100
CY10
CY08
CY06
FY05
FY03
FY01
0 FY99
0 FY97
1
FY95
3
100
CY08
6
150
CY06
1
150
FY05
9
200
FY03
(x)
2
(INR bn)
12
200
FY01
2
250
FY99
3
15
250
(USD)
18
EV per tonne is highest when stock has peaked out
EV per tonne bottom outs when stock bottom outs
FY97
If someone had brought ACC stock when EV/EBITDA was highest despite lower return ratio he would have made money at a CAGR of 22% over 5 years
FY95
If someone had brought ACC stock when EV/EBITDA was lowest he would have lost money at a CAGR of 22%
Exhibit 53: ACC: Market cap and EV/tonne
(INR bn)
Exhibit 49: ACC: EV/EBITDA (x) and MCAP (INR Bn)
RoNW (RHS)
Usually, mid cap cement companies have traded at a discount to their large cap peers. A major reason for the same is the pan-India presence of large cap peers which reduces the risk of regional concentration and lower free float. In terms of profitability, the mid-cap cement companies were less profitable in terms of EBITDA/tonne till FY07. But post FY07, when the pan-India witnessed a pricing increase in excess of ~25% coupled with cost cutting measures undertaken by cement companies, the profitability of mid-cap players has been aligned in line with that of large cap players. However, the gap of valuations in terms of EV/tonne has widened significantly, increasing from ~30% pre-FY07 to more than ~60% post FY07. The large cap players have consistently traded at a premium to their replacement costs in the past four years (excluding the period of subprime crises). In fact, they traded at nearly twice the replacement cost in FY07 and FY08 whereas mid-cap players have barely traded above their replacement cost. The maximum valuation that mid cap players managed was a ~10% to 15% discount to the replacement cost in FY06-FY07 period. Since then, these mid-cap players have traded well below their replacement cost. However, the valuation gap for mid-cap players has been consistently coming down which now lies in the range of ~50 -60% discount to large cap peers. We believe with improving cement pricing and bettering EBITDA/tonne for cement players, the valuation discount for mid-cap players will gradually narrow down. Therefore, we have valued mid-cap cement players at ~38% discount to the replacement cost. Our valuation of USD62/tonne assigned to mid-cap players indicates the distress case EV the cement plants deserve in case of a continued downturn.
Source: Capitaline, ,Elara Securities Research
18
Elara Securities (India) Private Limited
Cement
Source: CMIE, CMA, Elara Securities Estimates
(USD per tonne)
Exhibit 56: Better profitability justifies rich valuations 250
1,200
200
1,000 800
150
600
100
400
50
200 FY12E
FY11E
FY10
FY09
FY08
FY07
FY06
0 FY00
0
Cement
(%)
FY12E
FY10
FY11E
Average Large Caps EV per tonne (LHS) Capacity Utilization of the Industry (RHS)
(INR EBITDA/tonne)
The cement industry is likely to operate at capacity utilizations of 80% in FY11 and 81% in FY12; similar to the FY03-FY04 period. During FY03-FY04, large cap was trading at EV per tonne of USD67-80. Present valuations of cement players are 1.9x last down cycle. However there has also been corresponding improvement in EBITDA/tonne for cement players due to improvement in cost efficiency. Frontline cement players are expected to earn 1.9x higher EBITDA/tonne as compared to last down cycle. Thus we believe that present valuations for the frontline companies are fair.
FY09
FY00
Large cap valuations across business cycles
FY08
75 FY07
60 Source: Elara Securities Estimates
FY06
80 FY05
90 FY04
EBITDA/tonne disc
85
r=0.86
120
FY05
Valuation disc for mid caps
90
150
FY03
(100)
95
180
FY04
(80)
100
210
FY02
(60)
Run up in the stock prices much sharper than improvement in fundamentals of the industry
240
FY03
(40)
(USD Per tonne)
(%)
(20)
FY01
0
In last down cycle when industry operated at capacity utilizations of 80-81 the EV/tonne of large cap was USD67-80.With similar capacity utilizations expected for the industry valuations are 1.5x higher
FY02
20
Exhibit 55: All India capacity utilization, EV per tonne
FY01
FY12
FY11
FY10
FY09
FY08
FY07
FY06
FY05
FY04
FY03
FY02
FY01
Exhibit 54: Margin gaps narrows, valuation broadens
Average Large Caps EV per tonne (LHS) Average Large Caps EBITDA/tonne (RHS) Source: Capitaline, Elara Securities Estimates
Elara Securities (India) Private Limited
19
Cement
Valuation & Recommendation Earnings based valuation multiples not useful for cement stocks Large cap valued on discounted bull case EV per tonne multiple Mid cap valued on distress EV per tonne multiple, to factor in higher regional risks
Valuations With earnings based valuation multiples failing to provide a correct historical trend, we have used EV/tonne as our valuation multiple for all companies under our coverage. With the industry in the midst of a downturn and cement prices as well as profitability in a highly volatile zone, we have tried to value companies based on discounted upcycle valuations that these deserved. Considering the uncertain cement market scenario and given the outperformance of large cap cement players as well as the premium they command over mid-cap segment, we have tried to find whether large cap stocks still make value proposition at the current level.
In order to find a fair EV per tonne for frontline cement companies we have looked at the historical average upcycle valuation and theoretical bull cycle valuation. As mentioned earlier, our industry analysis indicates that the pace of capacity addition will slow down and the demand will grow at steady pace. We expect the demand to catch up with supply post FY12 and the pricing power to return to industry. However, in the intermediate period, we expect the profitability of the cement players to remain subdued. As we expect the bull cycle in the cement industry to be still 1 year away, we have discounted average up cycle valuation by 1 year using WACC of 13%. Upcycle average benchmark valuation for large caps We have used two approaches for the same viz. 1. Historical upcycle valuation and 2 Theoretical bull cycle valuation. 1.
Historical upcycle valuations
In this approach, we have considered average upcycle EV per tonne for Ambuja and ACC. As per our working, these players have traded at an average EV/tonne of USD155. However, as we anticipate the upycle for cement sector to be 1 year away from now, we have discounted the same for 1 year using WACC of 13%. The computation leads to an average benchmark valuation of USD137/tonne under this approach.
Exhibit 57: Historical upcycle valuations USD per tonne Ambuja
178
ACC
132
Average
155
PV multiple
0.88
PV EV per tonne
137
Source: Elara Securities Research
2.
Theoretical bull cycle value
This approach is based on the notion as to what should be the fair valuation for acquiring the existing company to reap benefits of an upcycle rather than going for a greenfield expansion. In our view, the industry player would pay replacement cost of ~USD100 per tonne + PV of profitability of three years (as it takes minimum three year to set up a greenfield plant) in order to reap the benefits of an upcycle in the cement industry. Exhibit 58: Bull case DCF Year (INR /tonne)
1
Capex cost INR mn
5,000
Debt INR mn
2,500
Capacity in tonne
2
3
1,000,000 1,000,000 1,000,000
Capacity Utilization (%)
100
Production in tonnes
100
100
1,000,000 1,000,000 1,000,000
EBITDA per tonne
1,200
1,200
1,200
Depreciation@ 5%
250
250
250
Interest
238
238
238
PBT per tonne
713
713
713
Tax per tonne
214
214
214
PAT per tonne
499
499
499
Increase WC per tonne Free cash flow per tonne
10
10
10
976
976
976
Free cash flow to firm INR mn
976
976
976
PV multiple
0.88
0.78
0.69
PV of Cash
864
765
677
Sum INR mn
2,305
Terminal value= replacement cost
5,000
EV per tonne in USD
162
PV multiple
0.9
PV EV per tonne
144
WACC (%)
13.0
Source: Elara Securities Research
20
Elara Securities (India) Private Limited
Cement
However as discussed earlier, we anticipate the up cycle for cement sector to be 1 year away. Hence, we have discounted the average up cycle valuation of USD162/tonne for 1 yr using WACC of 13%. According to this method, we get a valuation of USD144/tonne under this approach. In order to decide the target multiple for large cap stock, we have used the average of the above two methods. Exhibit 59: Bull case DCF USD per tonne
distress value of the company in an extended down cycle. 1.
DCF
We have tried to calculate the distress value for cement players by using DCF. We have assumed that cement players will earn an EBITDA/tonne of INR350 for the next 20 years and will operate at a capacity utilization of 75%. In this method, we have assumed that the industry is in a structural down cycle for a continuous period of twenty years and the profitability of cement players will not improve. We have assumed the terminal value for the plant to be zero. The DCF based target multiple works out to be USD40 per tonne. Exhibit 61: Bear Case DCF
Method 1
137
Year
1
Method 2
144
Capex cost (INR mn)
3,500
Average
140
Debt (INR)
1,750
2
….
20
Cement
As shown in the table, assuming the upcycle operating parameters (100% capacity utilization and EBITDA of INR1,200/ tonne), the fair valuation works out to be USD162 per tonne.
Source: Elara Securities Research
Target multiple for frontline cement players
Capacity (tonne)
Our comparative analysis have shown (kindly refer to exhibit no 47 on page no 17) steep valuation differences in frontline cement companies is unjustified. Thus, we have valued UltraTech and Ambuja at par to our discounted up cycle valuations (USD 140 per tonne). We have valued ACC at 5% discount to Ambuja and UltraTech taking into account its smaller size and lower profitability.
Capacity Utilization (%)
Exhibit 60: Target multiple
1,000,000 1,000,000
1,000,000
75
75
75
Production (tonne)
750,000
750,000
750,000
EBITDA (per tonne)
350
350
350
EBITDA (INR mn)
263
263
263
Depreciation@ 5%
175
175
175
Interest
166
166
166
PBT (per tonne)
9
9
9
Tax (per tonne)
3
3
3
PAT (per tonne)
6
6
6
10
10
10
Total
Target EV per tonne
UltraTech
22
140
Increase WC (per tonne)
Ambuja
22
140
Free cash flow (per tonne)
347
347
347
ACC
21
133
Free cash flow to firm (INR mn)
260
260
260
PV multiple
0.88
0.78
0.09
PV of Cash
230
204
23
Sum in mn
1,829
Source: Elara Securities Research
Target EV per tonne for mid-cap cement companies As is evident from the historical perspective, mid-cap companies have always traded at a discount to their large cap peers as well as to the replacement cost. The discount has prevailed despite having a minor difference between the profitability and return ratios for these players. The regional concentration and the lower free float are some of the reasons for the discount. However, over the past few years, though the discount has been consistently narrowing down, there exists a huge gap (~56%) between the large cap and small cap companies. We have valued mid-cap companies at a distress EV per tonne where we have factored in most of negative surprises. We have also used a uniform multiple for all mid-cap players irrespective of their profitability and size. Three methods have been applied for calculating the
Elara Securities (India) Private Limited
EV per tonne in USD
40
WACC (%)
13
Source: Elara Securities Research
2.
Lowest M&A deals in last two decades
The lowest M&A deal in the cement industry had taken place at an EV per tonne of USD41-42. However, these deals had taken place in 1998. The inflation adjusted value for the deal works out to be USD75-77 per tonne.
21
Cement Exhibit 63: PV of a plant assuming nil free cash flows
Exhibit 62: M&A deal valuations on an uptrend Year
Acquirer
Target
Capacity (Million tonne)
EV/ tonne (US$)
Inflation adjusted
1998
Guj Ambuja Modi
2.0
42
77
1998
Grasim
1.1
41
75
1999
Guj Ambuja ACC
12.0
144
248
2003
Grasim
L&T
17.0
82
119
2005
Holcim
ACC
18.0
110
143
2006
Holcim
Guj Ambuja
13.4
195
242
2007
Cimphor
Sri Digvijay
1.0
152
179
2008
CRH
My Home
3.0
220
247
2008
Vicat
Sagar
2.5
Shri Digvijay
Replacement cost USD
100
PV multiple
0.7
Fair value of replacement cost
69
Source:
The average of above three methods works out to be USD62 per tonne. We have used this multiple for valuing the mid-cap cement players in our coverage universe. Our target valuation for mid-cap is at a 38% discount to the replacement cost and 56% discount to our target multiple for UltraTech.
105
118
Exhibit 64: Average of three distress case valuations
Average for 20 years
121
161
Distress value by method (a)
40
Average for 5 years
168
197
Distress value by method (b)
76
Source: Elara Securities Research
Distress value by method d (c)
69
3.
Average
62
Discounted value of a plant in downturn
Source: Elara Securities Research
In this method, we have assumed that the profitability of mid-cap players will remain depressed for three years (3x of what assumed for large cap). Thus, we have assumed that for the next three years, midcap players will not be able to earn any operating cash flow. Even after three years, return ratios of the plant will be very close to the cost of capital. In such a case, the fair EV per tonne will be the present value of USD100.
22
Elara Securities (India) Private Limited
9 November 2010
India | Cement
Initiating Coverage
Restructuring priced in
Rating : Reduce
Merger with Samruddhi Cement creates a global giant
Target Price : INR1,139 Upside: 2% CMP : INR1,122 ( As on 2 November 2010)
UltraTech Cement Limited (UltraTech) has emerged as the world’s ninth largest cement manufacturer following the merger of Samruddhi Cement Limited (SCL) with itself. It will be the largest cement company in India, having a capacity of 52.4mn tonnes - almost double the capacity of the second and third players, viz: ACC and Ambuja. Apart from this, post the merger, UltraTech has a presence in all five major regions, thereby eliminating the regional risk. Furthermore, the merger is also expected to increase FY12 EPS of the company by 10.3%.(Kindly refer to Exhibit 4 on page no 27) Healthy balance sheet to ensure smooth capex deployment At the end of FY10, UltraTech’s net debt to equity ratio was 0.3 and gross cash and investment was INR17.5 bn. Lower debt equity ratio and bigger size of the balance sheet will enable the company to smoothly fund its next round of expansion. The company has already announced the second round of expansion to increase (consolidated) the capacity by 9.2mn tonnes to 61.6 mn tonnes.
Key data* Bloomberg /Reuters Code: Current /Dil. Shares O/S (mn) Mkt Cap (INRbn/USDmn) Daily Vol. (3M NSE Avg.) Face Value (INR)
ULTC.BO /UTCEM IN 276/276 310/6,976 240,353 10
1 USD= INR44.4 Source: Bloomberg ; * As on 2 November 2010
Price & Volume 1,200
2,000
1,100
1,500
1,000
1,000
900
500
800 700
Valuation discount to ACC, Ambuja to diminish UltraTech has historically traded at a discount of~18% to ACC and ~33% to Ambuja due to various reasons including lower free float, higher regional risk and dependence on expensive sources of power. Post the restructuring, UltraTech’s free float as well as regional mix has improved. Further, UltraTech has added 211MW of CPP capacities in the last two years. Due to an increase in CPP capacity, its dependence on the external source of power is expected to come down to ~5% in FY11 and FY12 from 75% prior to FY10. We expect the CPP to result in a saving of INR 137/tonne(INR 5.2 bn) from FY11 and INR165/ tonne (INR 7.8bn) in FY12 .Thus with the improving profitability and better free float, we expect the valuation gap between UltraTech and Ambuja to be bridged in the medium term.
Valuation
0
Oct-09 Mar-10 Vol. in '000s (RHS)
Jul-10 Nov-10 Ultratech Cement (LHS)
Source: Bloomberg
Share holding (%)
Q3FY10 Q4FY10 Q1FY11 Q2FY11
Promoter
54.8
54.8
54.8
64.1
Institutional Investors
21.3
22.6
22.2
18.7
Other Investors
8.6
7.8
8.0
8.6
General Public
15.3
14.8
15.0
8.5
Source: BSE
Price performance (%)
3M
6M
12M
Sensex
12.3
17.0
32.1
Ultratech
30.1
17.5
51.5
ACC
28.0
17.5
51.9
Ambuja Cements
26.4
23.1
74.7
Source: Bloomberg
UltraTech will enjoy benefits of higher scale of operations coupled with cost savings due to increased consumption of captive power. However, the stock is already trading at close to 38% premium to its replacement cost and close to our discounted upcycle EV/tonne. We have valued UltraTech’s grey cement business at EV/tonne of USD140 and the white cement business at a conservative valuation of USD186/tonne. Accordingly, we initiate our coverage on UltraTech with a Reduce and a target price of INR 1,139.
Stock performance 180 Rebased to 100
Global Markets Research
Ultratech Cement
160 140 120 100 80 Nov-09
Feb-10 May-10 Ultratech
Aug-10 Nov-10 Sensex
Source: Bloomberg
Key Financials Y/E Mar (INR mn) FY08 FY09 FY10 FY11E FY12E
Rev
YoY (%)
EBITDA
EBITDA (%)
Adj PAT
55,092 63,831 70,497 140,614 185,837
12.2 15.9 10.4 NA NA
17,201 17,064 19,711 30,659 36,334
31.2 26.7 28.0 21.8 19.6
10,076 9,770 10,696 15,298 20,216
YoY (%) Fully DEPS 28.8 (3.0) 9.5 NA NA
80.4 77.4 84.6 64.1 73.3
RoE (%) 45.2 31.0 26.1 20.9 18.4
P/E (x) EV/tonne (USD) EV/EBITDA (x) 14.0 14.5 13.3 17.5 15.3
189.6 153.8 135.1 143.9 138.5
9.0 8.9 7.1 10.4 8.5
Source: Company, Elara Securities Estimates Note: Financials for FY09 & FY10 are prior to restructuring of cement business of AV Birla group and hence not strictly comparable
Ravindra Deshpande • [email protected] • +91 22 4062 6805 Ravi Sodah • [email protected] • +91 22 4062 6817 Elara Securities (India) Private Limited
Ultratech Cement Valuation trigger
Recovery in cement prices
1,400 1,200
2
1
Investment summary
Pan India presence to reduce regional risks
Healthy balance sheet
Power cost to reduce
1,000
800
Valuation trigger
Target price reached
600
1. Recovery in cement prices
400 200
Key risks Oct-11
Jun-11
Aug-11
Apr-11
Feb-11
Oct-10
Dec-10
Jun-10
Aug-10
Apr-10
Feb-10
Oct-09
Dec-09
Jun-09
Aug-09
Apr-09
Feb-09
Oct-08
Dec-08
Jun-08
Aug-08
Apr-08
0
Source: Bloomberg, Elara Securities Estimates
Sharp decline in cement prices
Slow down in cement demand
Our assumptions
Valuation overview - EV/tonne based valuations FY12E
Cement Volume to grow at a CAGR of ~8.2%
Realizations to increase at a CAGR of 0.9%.
Grey Cement Capacity
mn tonnes
48.8
EV /tonne multiple
USD/tonne
140
Grey Cement business EV
INR Mn
307,440
White Cement Capacity
mn tonnes
0.6
EV /tonne multiple
USD/tonne
186
White Cement business EV
INR mn
5,022
EV
INR mn
312,462
Less: Net Debt
INR mn
(1,920)
Target Market Capitalization
INR mn
314,382
Diluted Shares outstanding
mn
Target Price
INR/ share
1,139
276
Current Market Price
INR/ share
1,122
Potential Upside/(downside)
(%)
1.5
Source: Company, Elara Securities Estimates
Valuation driver - EV/tonne , RoE and RoCE 60
160
120 40
100
(%)
(EV/tonne)
140
80 60
20
40 20
EV/Tonne(US$) (LHS))
RoNW(%) (RHS)
FY02
FY01
FY00
FY99
FY98
FY97
FY96
0 FY95
0
ROCE (%) (RHS)
Source: Elara Securities Research
24
Elara Securities (India) Private Limited
Ultratech Cement
Financials (Y/E Mar) FY10
FY11E
FY12E
63,831
70,497
140,614
185,837
EBITDA
17,064
19,711
30,659
36,334
1,036
1,227
2,409
4,333
18,100
20,938
33,068
40,667
3,230
3,881
7,668
8,451
14,870
17,057
25,400
32,216
1,255
1,175
2,903
2,485
13,615
15,882
22,498
29,730
OPBIDTA Less :- Depreciation & Amortization EBIT Less:- Interest Expenses PBT Less :- Taxes
3,844
5,185
7,199
9,514
Adjusted PAT
9,770
10,696
15,298
20,216
Reported PAT
9,770
10,696
15,298
20,216
Balance Sheet (INR mn)
FY09
FY10
FY11E
FY12E
Share Capital
1,262
1,265
2,760
2,760
10 5
0
0 FY09
FY10
FY11E
Net Revenues (LHS)
FY12E
EBITDA Margin (RHS)
Adjusted profits growth trend
34,759
44,822
97,830
116,029
16,045
41,473
37,973
Total Liabilities
57,437
62,132
142,063
156,762
Gross Block
74,010
80,781
176,559
199,059
Less:- Accumulated Depreciation
27,653
31,365
69,185
77,636
Net Block
46,357
49,417
107,374
121,423
5,000
6,773
2,594
20,000
12,930
0
10,348
16,696
16,696
16,696
1,189
1,733
15,481
23,201
Net Deferred Tax
(7,229)
(8,307)
(17,487)
(17,487)
Total Assets
57,437
62,132
142,063
156,762
FY09
FY10
FY11E
FY12E
Cash profit adjusted for non cash items
15,682
16,856
25,799
29,740
Add/Less : Working Capital Changes
(1,106)
(752)
(1,295)
895
Operating Cash Flow
14,576
16,104
24,504
30,635
Less:- Capex
(8,500)
(2,592)
(18,867)
(15,430)
Free Cash Flow
6,075
13,512
5,637
15,205
Financing Cash Flow
1,917
(7,410)
(4,921)
(8,004)
Investing Cash Flow
(7,954)
(6,300)
(6,300)
1,414
Net change in Cash
38
(198)
(5,584)
8,615
FY09
FY10
FY11E
FY12E
Ratio Analysis
15
50,000
21,416
Cash Flow Statement (INR mn)
25 20
100,000
Borrowings
Net Working Capital
19.6
150,000
Reserves
Investments
30 21.8
Source: Company, Elara Securities Estimates
Add/Less: - Extra-ordinaries
Add:- Capital work in progress
28.0
26.7
200,000
25,000
(INR mn)
20,000 15,000 10,000
FY09
15.9
10.4
NA
(0.8)
15.5
NA
NA
PAT Growth
(3.0)
9.5
NA
32.1
EBITDA Margin
26.7
28.0
21.8
19.6
Net Margin
15.3
15.2
NA
10.9
FY11E
FY12E
Source: Company, Elara Securities Estimates
Return ratios (%) 40 31.0 30
28.5 24.9
29.2
21.6 26.1
20
20.9
18.4
10 FY09
EBITDA Growth
FY10
Adjusted PAT
Income Statement Ratios(%) Revenue Growth
Cement
Add:- Non operating Income
Revenue & margins growth trend
(%)
FY09
Net Revenues
(INR mn)
Income Statement (INR mn)
FY10 ROE (%)
NA
FY11E
FY12E
ROCE (%)
Source: Company, Elara Securities Estimates
Return & Liquidity Ratios Net Debt/Equity (x)
0.5
0.3
0.3
0.1
ROE (%)
31.0
26.1
20.9
18.4
ROCE (%)
29.2
28.5
24.9
21.6
Diluted EPS (INR/Share)
77.4
84.6
64.1
73.3
EPS Growth (%)
(3.7)
9.2
(24.2)
14.3
DPS (INR/Share)
4.9
6.2
6.5
6.5
14.5
13.3
17.5
15.3
8.9
7.1
10.4
8.5
Comfortable debt equity ratio
Per Share data & Valuation Ratios
P/E Ratio (x) EV/EBITDA (x) EV/Sales (x) EV/tonne (USD)
2.4
2.0
2.3
1.7
153.8
135.1
143.9
138.5
0.4
0.6
0.6
0.6
Dividend Yield (%)
Trading at a premium to replacement cost
Source: Company, Elara Securities Estimates Note: Financials for FY09 & FY10 are prior to restructuring of cement business of AV Birla group and hence not strictly comparable
Elara Securities (India) Private Limited
25
Ultratech CementCement Ultratech
Investment rationale
Restructuring of AV Birla group cement business to eliminate regional risks Dependence on imported coal to increase cost pressures Lower dependence on expensive power to improve cost efficiency Overseas acquisitions to provide exposure to cement markets outside India
A global giant emerges post revamp
Exhibit 2: UltraTech sneaks into global top 10
Grasim and UltraTech have consolidated their cement business. The restructuring was carried out in two steps: Grasim demerged its cement business into a separate company viz: SCL and then, SCL was merged with UltraTech.
Lafarge - France Holcim - Switzerland CNBM - China Heidelberg - Germany Cemex - Mexico Anhui Conch - China ItalCementi - Italy Taheiyo - Japan UltraTech + Samruddhi CRH - Ireland Buzzi Unichem - Italy Eiro Cement Cimpor - Portugal Jdong- China Hauxin- China
The swap ratio for the merger was of four shares of UltraTech for every seven shares of SCL. After the restructuring, Grasim now owns ~60.3 % in UltraTech. The company has now emerged as the world’s ninth largest manufacturer having capacity of 52.4 mn tonnes almost double the capacity of distinct second and third players - ACC and Ambuja - in the Indian cement industry.
263 257 133 115 101 95 74 57 52 50 44 39 37 35 35
The larger size provides the benefit of economics of scale and a bigger balance sheet to comfortably fund major projects.
Source: Company, Elara Securities Research
Exhibit 1: Group structure: Pre and post restructuring
Exhibit 3: UltraTech leads by miles
Grasim Shareholders
(35%)
0
1)UltraTech + Samruddhi
Ultratech Public Shareholders 45%
Grasim
65%
2)ACC
26
3)Ambuja Cement
25
Samrudhhi
UltraTech
Cement
Cement
22
5) India Cement
55%
14
6) Shree Cement
12
7)Madras Cement
10 0
UltraTech Public Shareholders
Grasim VSF / Others 60.3% UltraTech + Samrudhhi
300
52
4) JP
VSF / Others
Grasim Shareholders
100 200 (mn tonne)
20 40 (mn tonne)
60
Source: Company, CMA ,Elara Securities Research
Apart from this, post merger, UltraTech will have a presence in all five major regions, thereby eliminating regional risk. Further, the merger is also expected to increase FY12 EPS of the company by 10.3% as proportion of the volume from low price Southern region will reduce.
Cement Source: Company, Elara Securities Research
26
Elara Securities (India) Private Limited
Ultratech Cement
Post Pre restructuring restructuring Sales volume (mn tonnes)
Var (%)
23
47
109.1
Realization per tonne
3,649
3,933
7.8
Costs per tonne
2,964
3,164
6.8
685
769
12.2
Net Sales(INR Mn)
82,474
185,837
125.3
EBITDA (INR Mn)
15,491
36,334
134.5
Net Profit(INR Mn)
8,398
20,216
140.7
126
276
118.2
66
73
10.3
EBITDA per tonne
No of share (mn) EPS Source: Elara Securities Estimates
Exhibit 5: UltraTech pre-merger: Region wise capacity East 18% South 35%
compared to 36% of ACC. Thus the regional risk of the UltraTech has also been substantially reduced. Prior to FY10, UltraTech used to meet about 75% of its electricity requirement through expensive source of power -: grid, DG sets and naphtha based power plants. However, with the company increasing its coal based CPP capacity by 211MW in last two years, UltraTech’s dependence on expensive source of power has been reduced to 10% in FY10 and is expected to reduce to 5% in FY11 &FY12.The CPP have resulted into savings of INR INR 127/tonne (INR 146 / tonne) in FY10. We expect company to save INR 221 bn (INR 167 per tonne ) in FY11 and INR 231bn ( INR 164/ tonne) in FY12. Thus, with an improvement in free float, cost structure and regional mix, we expect UltraTech to trade at par to Ambuja and close to 5% premium to ACC. Exhibit 7: EV/tonne gap reduces
Cement
Exhibit 4: Key financials for FY12
(USd per tonne)
300
West 48%
200 150 100 50 0
Source: CMA, Elara Securities Research
Exhibit 6: Post-merger: Region wise capacity break-up
North 26%
FY05 FY06 FY07 FY08 FY09 FY10 FY11E FY12E UltraTech
East 14%
Central 11%
250
ACC
Ambuja
Source: Company, Elara Securities Estimates
West 26%
South 23% Source: CMA, Elara Securities Research
Valuations discount to ACC, Ambuja to shrink Historically, UltraTech has traded at a discount of 18% to ACC and 33% to Ambuja, primarily on account of:
High regional risk
Dependence on expensive source of power
Lower free float
Acquisition of ETA Star Cement would provide exposure to cement market outside India though it is likely to adversely impact the profitability in the medium term. UltraTech has acquired the management control of ETA Star Cement at an EV INR1.7bn (at EV/tonne of USD120). ETA Star Cement’s manufacturing facilities include a 2.3mtpa clinkerisation plant, and 2.1mtpa of cement grinding capacity in the UAE, 0.4mtpa and 0.5mtpa of cement grinding capacity in Bahrain and Bangladesh respectively. The acquisition of ETA Star Cement has provided the company an opportunity to explore cement market outside India. However, due to low profitability in Middle East vis a vis India, the acquisition is likely to act as a drag. Nevertheless, due to small size of acquisition, we expect its impact on overall profitability to be marginal. We expect the acquisition will dilute FY12 EBITDA margins by 20 bps and RoCE by 30 bps.
Dependence on imported coal to heighten cost stress
Post restructuring, free float is no longer an issue for UltraTech who will be a pan India player, and will enjoy a better regional mix as compared to ACC. UltraTech will have 23% of its capacity in low price southern region as
Power and fuel costs constitute ~24% of cost of goods sold for UltraTech which meets 29% (on a consolidated basis) of its fuel requirements through imports. The prices
Elara Securities (India) Private Limited
27
Ultratech Cement of imported coal have increased by 42% YoY (7.6% QoQ) due to an improvement in the global sentiment. Thus the hike in power and fuel costs will partly lessen the benefit of saving from CPP. Exhibit 8: Fuel mix: Dependent on imported coal Company
Domestic Coal (%)
FY10 Net Debt Equity (x)
0.3
0.1
31,279
39,894
FY10
FY11E
FY12E
16,856
25,799
29,740
(752)
(1,295)
895
Operating Cash Flow
16,104
24,504
30,635
Less:- Capex
(2,592)
(18,867)
(15,430)
Free Cash Flow
13,512
5,637
15,205
Free Cash Flow as a % of Mcap
10
2
5
Free Cash Flow as a % of EV
10
2
5
Source: Company, Elara Securities Estimates
Imported Petcoke (%) Other (%) Coal (%)
Exhibit 10: Summary of free cash flow INR mn
15
0
0
UltraTech
62
29
9
0
Cash profit adjusted for non cash items
0
0
100
0
Add/Less : Working Capital Changes
45
55
0
0
JK Lakshmi
0
0
90
10
JK Cement
10
0
90
0
100
0
0
0
70
30
0
0
Orient Paper Ambuja
Source: Company, Elara Securities Research
Healthy balance sheet, capex to take off smoothly UltraTech had a comfortable net debt equity ratio, of 0.3x at the end of FY10. The company also had gross cash and equivalents of INR17.5bn. Lower debt equity ratio bigger and stronger balance sheet will enable the company to smoothly fund it’s next round of expansion. The company has announced brownfield expansions aggregating to 9.2mn tonnes at Chhattisgarh and Karnataka units with related grinding units and bulk terminals at the investments of INR56bn. Post the implementation of expansion UltraTech Cement (consolidated) capacity will increase to 61.6mn tonnes from 52.4mn tonnes at present. The aggressive expansion by the company will enable the AV Birla group to maintain its market share at close to 18% in domestic market.
FY12E
0.3
85
India Cement
FY11E
17,533
Gross Cash & Investments(INR mn)
ACC
Shree Cement
28
Exhibit 9: Key balance sheet ratios
Source: Company, Elara Securities Estimates
Key risk Increase in fuel prices More than expected increase in coal prices may adversely affect profitably of the company. Sharp decline in cement prices Cement prices may decline due to slow down in cement demand or bunching up of capacities addition.
Elara Securities (India) Private Limited
Ultratech Cement
Valuation & Recommendation At EV/tonne of USD139, restructuring gets priced in Initiating coverage with Reduce, target price of INR1,139 on limited upside visibility Valuing at EV/tonne of USD140 on FY12 capacity, at par with Ambuja
Traditionally UltraTech has traded at a discount to the other large cap peers viz. Ambuja and ACC. However, with the consolidation of Grasim’s cement business and steps to address operational inefficiencies, we believe, the valuation discount between these players will narrow down. We have valued the grey cement business of UltraTech at an upcycle EV/tonne valuation of USD140/tonne. We have used a conservative valuation multiple of USD186/tonne for its white cement business. The white cement business is characterized by significantly higher realizations (~4.6x as that of grey cement) as well as EBITDA. Accordingly we arrive at a valuation of INR 1,139 which leaves an upside of ~2% in the stock.
Exhibit 11: EV/tonne based valuations FY12E Grey Cement Capacity
mn tonnes
EV /tonne multiple
USD/tonne
Grey Cement business EV
INR Mn
48.8 140 307,440
White Cement Capacity
mn tonnes
0.6
EV /tonne multiple
USD/tonne
186
White Cement business EV
INR mn
5,022
EV
INR mn
312,462
Less: Net Debt
INR mn
(1,920)
Target Market Capitalization
INR mn
314,382
Diluted Shares outstanding
mn
Target Price
INR/ share
1,139
Current Market Price
INR/ share
1,122
Potential Upside/(downside)
(%)
Cement
Valuations
276
1.5
Source: Company, Elara Securities Estimates
Elara Securities (India) Private Limited
29
Ultratech Cement
Company description UltraTech Cement Limited, the erstwhile L&T Cement, is India’s leading cement player. It is also one of the largest exporters of cement clinker from India. Post the merger of Samruddhi Cement, UltraTech has emerge as the world ninth largest manufacturer having capacity of 52.4mn tonnes - more than double the capacity of distinct second and third players - ACC and Ambuja - in the cement industry. UltraTech will have presence in all five regions in India.
Board of Directors & Management Kumar Birla, Non-Executive Chairman
O Puranmalka - Whole-time Director
Kumar Mangalam Birla is Non-Executive Chairman of the Board of UltraTech. He obtained his MBA degree from London Business School.
O Puranmalka has been appointed the Group Executive President, Chief Marketing Officer and Whole-time Director of UltraTech, effective April 01, 2010.
K C Birla - Chief Financial Officer K C Birla is the Chief Financial Officer and Senior Executive President of UltraTech.
30
Elara Securities (India) Private Limited
Ultratech Cement
Coverage History 1,400 1,200
1
1,000 800 600
200
Not Covered
Date 1
Rating
02-Nov-2010 Reduce
Target Price
Closing Price
INR1,139
INR1,122
Covered
Nov-10
Oct-10
Sep-10
Aug-10
Jul-10
Jun-10
May-10
Apr-10
Mar-10
Feb-10
Jan-10
Dec-09
Nov-09
Oct-09
Sep-09
Aug-09
Jul-09
Jun-09
May-09
Apr-09
Mar-09
Feb-09
Jan-09
Dec-08
Nov-08
Oct-08
Sep-08
Aug-08
Jul-08
Jun-08
May-08
Apr-08
0
Cement
400
Guide to Research Rating BUY
Absolute Return >+20%
ACCUMULATE
Absolute Return +5% to +20%
REDUCE
Absolute Return -5% to +5%
SELL
Absolute Return < -5%
Elara Securities (India) Private Limited
31
Ultratech Cement
Notes
32
Elara Securities (India) Private Limited
9 November 2010
India | Cement
Initiating Coverage
Melody from clinker
Rating : Sell
Capacity expansion to drive volume growth
Target Price : INR119 Downside : 20% CMP : INR148 ( As on 2 November 2010)
Ambuja Cements Limited (Ambuja) would complete its expansion in CY10 to take the total cement grinding capacity to 27mn tonnes. In Q1CY10, the grinding capacity of the company rose to 25mn tonnes (from 22mn tonnes), and is expected to be 27 mn tonnes by end of CY11. However, the clinker capacity of the company will remain at 16.7mn tonnes enabling the company to produce up to 25mn tonnes of cement. We expect this to lead to a 9.4% volume CAGR over CY0911. On the back of volume growth, we expect earnings to grow at a CAGR of 4.6% despite the subdued pricing regime and higher cost of production.
Key data* Bloomberg /Reuters Code Current /Dil. Shares O/S (mn) Mkt Cap (INRbn/US$mn) Daily Vol. (3M NSE Avg.) Face Value (INR)
ACEM IN/ABUJ.BO 1,524/1,524 226/5,099 2,107,833 2
1 US$= INR44.4 Source: Bloomberg ; * As on 2 November 2010
Price & Volume
Lower clinker purchases to cushion margins
150
Ambuja’s CY09 earnings were depressed due to the purchase of clinker from the open market. With its 4.6mn tonnes clinker capacity that came on stream in Q1CY10, we expect the company to save ~INR165/tonne in CY10 and ~INR236/tonne in CY11. Hence EBITDA margins of Ambuja are expected to hold around 25-28% in CY10 as well as in CY11 despite an increase in cost per tonne (ex raw material) at a CAGR of 5.2% between CY09 and CY11.
15
130
10
110 5
90 70
0
Oct-09 Mar-10 Vol. in mn (RHS)
Dependence on imported coal to neutralize savings from clinker
Jul-10 Nov-10 Ambuja Cement (LHS)
Source: Bloomberg
Power and fuel costs constitute ~26% of Ambuja’s cost of goods sold. Ambuja meets 30% of its fuel requirements through imports. The prices of imported coal have increased by 42% YoY. Thus any increase in power and fuel cost will partly neutralize the benefit of saving from lower clinker purchase.
Share holding (%)
Q4CY09 Q1CY10 Q2CY10 Q3CY10
Promoter
46.4
46.4
46.4
46.4
Institutional Investors
39.8
40.7
41.5
42.4
Other Investors
4.7
4.3
3.6
3.3
General Public
9.1
8.6
8.6
7.9
Source: BSE
Favorable regional mix: Absence in South to be a boon
Price performance (%)
We like Ambuja’s regional mix as it does not have any presence in the Southern region - which is expected to have the worst demand supply equation. Ambuja has better a regional mix than the other large cap players hence will be better off as compared to the rest.
Valuation
3M
6M
12M
Sensex
12.3
17.0
32.1
Ambuja Cements
26.4
23.1
74.7
Ultratech
30.1
17.5
51.5
ACC
28.0
17.5
51.9
Source: Bloomberg
At the CMP of INR148, Ambuja is trading at 17.2x and 16.9x its CY10 and CY11 earnings, respectively. On an EV/tonne basis, it is trading at USD184/tonne and USD180/tonne of its CY10 and CY11 capacities, respectively. The stock is currently trading at a premium to its replacement cost as well as large cap peers having a pan India presence. Although, Ambuja has the benefits of efficient operations and possibilities of volume growth, we believe, the stock price has already factored in both. Current valuations are already close to the average peak EV/tonne that Ambuja has traded at. Therefore, considering the steel valuations and steep premium to its large cap peers as well as replacement cost, we initiate coverage of Ambuja Cements with a Sell rating and a target price of INR119.
Stock performance 180 Rebaed to 100
Global Markets Research
Ambuja Cements
160 140 120 100 80 Nov-09
Feb-10
May-10
Ambuja
Aug-10
Nov-10
Sensex
Source: Bloomberg
Key Financials Y/E Dec (INR mn) CY08 CY09 CY10E CY11E
Rev YoY (%) EBITDA 62,347 9.3 17,087 70,769 13.5 18,669 76,429 8.0 21,226 87,701 14.7 21,998
EBITDA (%) 27.4 26.4 27.8 25.1
Adj PAT 11,335 12,184 13,103 13,334
YoY (%) Fully DEPS (9.8) 7.4 7.5 8.0 7.5 8.6 1.8 8.8
RoE (%) 21.9 20.1 18.8 16.8
P/E (x) EV/tonne (USD) EV/EBITDA (x) 19.9 260.4 12.7 18.5 213.6 11.3 17.2 184.5 9.8 16.9 179.8 9.2
Source: Company, Elara Securities Estimate
Ravindra Deshpande • [email protected] • +91 22 4062 6805 Ravi Sodah • [email protected] • +91 22 4062 6817 Elara Securities (India) Private Limited
Ambuja Cements Valuation trigger
Investment summary
Cement expansion to drive volume growth
Lower clinker purchases to support margins
Favorable regional mix
Healthy balance sheet
Decline in cement prices
160 140 1
120
2
100 80 60 Target price reached
40
Valuation trigger
20
1. Decline in cement prices Oct-11
Jun-11
Aug-11
Apr-11
Feb-11
Oct-10
Dec-10
Jun-10
Aug-10
Apr-10
Feb-10
Oct-09
Dec-09
Jun-09
Aug-09
Apr-09
Feb-09
Oct-08
Dec-08
Jun-08
Aug-08
Apr-08
0
Key risks
Source: Bloomberg, Elara Securities Estimates
Valuation overview - EV/tonne based valuations CY11E Grey Cement Capacity
mn tonnes
25.0
EV /tonne multiple
USD/tonne
140
Target EV
INR mn
157,500
Less: Net Debt
INR mn
(23,649)
Target Market Capitalizations
INR mn
181,149
Diluted Shares outstanding
mn
Target Price
INR/ share
Current Market Price
INR/ share
Potential Upside/(downside)
(%)
1,524 119 148
Sharp decline in cement prices
Slow down in cement demand
Our assumptions
Cement Volume to grow at a CAGR of ~9.4%
Cost per tonne to increase at a CAGR of 2.6%
Realizations to increase at a CAGR of 1.7%.
(19.8)
Source: Company, Elara Securities Estimates
Valuation driver - EV/tonne , RoE and RoCE 300
60
200
40 (%)
(EV/tonne)
250
150 100
20
50 0 FY95 FY96 FY97 FY98 FY99 FY00 FY01 FY02 FY03 FY04 FY05 FY06 CY07 CY08 CY09 CY10E CY11E
0
EV/Tonne (USD) (RHS)
ROE(%) (LHS)
ROCE (%) (LHS)
Source: Elara Securities Research
34
Elara Securities (India) Private Limited
Ambuja Cements
Financials (Y/E Dec)
Cash Flow Statement (INR mn) Cash profit adjusted for non cash items Add/Less : Working Capital Changes Operating Cash Flow Less:- Capex Free Cash Flow Financing Cash Flow Investing Cash Flow Net change in Cash Ratio Analysis Income Statement Ratios (%) Revenue Growth EBITDA Growth PAT Growth@ EBITDA Margin Net Margin@ Return & Liquidity Ratios Net Debt/Equity (x) ROE (%) ROCE (%) Per Share data & Valuation Ratios Diluted EPS (INR/Share) EPS Growth (%) DPS (INR/Share) P/E Ratio (x) EV/EBITDA (x) EV/Sales (x) EV/tonne (USD) Dividend Yield (%)
CY11E 87,701 21,998 2,210 24,208 5,071 19,137 88 19,049 5,715 13,334 13,334
CY08
CY09
CY10E
CY11E
3,049 53,680 2,887 3,808 63,423 57,069 25,142 31,928 19,472 3,324 8,657 43 63,423
3,050 61,659 1,657 4,858 71,225 62,241 27,841 34,400 27,144 7,270 2,383 27 71,225
3,051 71,306 657 4,858 79,872 97,386 32,223 65,162 1,000 7,270 6,413 27 79,872
3,051 80,914 657 4,858 89,480 107,886 37,294 70,592 500 7,270 11,091 27 89,480
CY08
CY09
CY10E
CY11E
12,274 (2,612) 9,662 (16,415) (6,753) (4,821) 13,666 2,093
14,525 6,562 21,087 (12,844) 8,243 (4,859) (3,093) 291
16,531 (1,089) 15,442 (9,000) 6,442 (5,086) 1,585 2,941
17,057 609 17,665 (10,000) 7,665 (3,814) 1,436 5,287
CY08
CY09
CY10E
CY11E
Revenue & margins growth trend 27.8
100,000
28
27.4
90,000 80,000
27
26.4
(%)
CY10E 76,429 21,226 2,158 23,383 4,382 19,001 345 18,656 5,553 13,103 286 13,388
70,000
26
60,000
25.1
50,000
25
CY08 CY09 Net Revenues (LHS)
CY10E CY11E EBITDA Margin (RHS)
Source: Company, Elara Securities Estimates
Adjusted profits growth trend 7.5
15,000
7.5
10 1.8
14,000 13,000 12,000
0 (5)
(9.8)
11,000
(10)
10,000
(15) CY08
CY09
Adjusted PAT (LHS)
CY10E
CY11E PAT Growth (RHS)
Source: Company, Elara Securities Estimates
Return ratios 30
27.7
27.1 25.2
25
20
22.6 21.9 20.1
18.8
15
9.3 (16.4) (9.8) 27.4 18.2
13.5 9.3 7.5 26.4 17.2
8.0 13.7 7.5 27.8 17.1
14.7 3.6 1.8 25.1 15.2
(0.2) 21.9 27.7
(0.2) 20.1 27.1
(0.2) 18.8 25.2
(0.3) 16.8 22.6
7.4 (9.8) 2.2 19.9 12.7 3.5 260.4 1.5
8.0 7.4 2.4 18.5 11.3 3.0 213.6 1.6
8.6 7.5 2.1 17.2 9.8 2.7 184.5 1.4
8.8 1.8 2.1 16.9 9.2 2.3 179.8 1.4
5
Cement
Share Capital Reserves Borrowings Deferred Tax (Net) Total Liabilities Gross Block Less:- Accumulated Depreciation Net Block Add:- Capital work in progress Investments Net Working Capital Miscellaneous Expenses not written off Total Assets
CY09 70,769 18,669 2,558 21,227 2,970 18,257 224 18,033 5,849 12,184 12,184
(%)
Balance Sheet (INR mn)
CY08 62,347 17,087 1,754 18,841 2,598 16,243 321 15,923 4,588 11,335 2,688 14,023
(INR mn)
Net Revenues EBITDA Add:- Non operating Income OPBIDTA Less :- Depreciation & Amortization EBIT Less:- Interest Expenses PBT Less :- Taxes Adjusted PAT Add/Less: - Extra-ordinaries Reported PAT
(INR mn)
Income Statement (INR mn)
CY08
CY09 ROE (%)
CY10E
16.8 CY11E
ROCE (%)
Source: Company, Elara Securities Estimates
Strong balance sheet position with net cash per share of INR16 (CY11E)
Trading at steep premium to its peers, replacement cost
@ On adjusted bottomline Source: Company, Elara Securities Estimates
Elara Securities (India) Private Limited
35
Ambuja Cements Ambuja Cements
Investment rationale To grow faster than industry in CY11 on capacity addition Lower clinker purchases to cushion profitability Strategically placed in high-growth Northern, Central and Eastern regions
400
140
(400) (800) (1,200)
2
Ambuja does not have a presence in the Southern region which is expected to have worst demand supply equations. About ~63% of the company’s capacity is located in the fast growing Northern, Eastern and Central regions. As compared to the all India growth of 12.1%, Northern, Central and Eastern region grew by 17.7%, 15.8% and 13.6% respectively. Furthermore we expect these Central and Eastern regions to have better pricing environments as compared to other regions in India. The average capacity utilization of Eastern and Central region is likely to be 1,400 bps and 900 bps higher than pan India. The capacity utilization of the North and Western region is expected to be very close to pan India average. Exhibit 3: Key markets report better growth in FY10 20
(%)
Lower clinker purchases to cushion margins
15.8
13.6
12
12.1
10.1
8.7
8.6
8 4 0 North
Due to mismatch between cement and clinker capacity, Ambuja had to purchase 1.7 mn tonnes of clinker from the open market. In Q1CY10 Ambuja commissioned clinker capacity of 4.6mn tonnes (at Himachal Pradesh and Chhattisgarh), taking clicker capacity to 16.7mn tonnes (current grinding capacity stands at 25mn tonnes). We expect the company to save INR165 per tonne in CY10 and INR236 per tonne in CY11. Saving from the clinker purchase will cushion the margins of the company from fall in cement realizations. Thus in our coverage universe, only Ambuja and OPI are expected to report an improvement in EBITDA margins in CY10/FY11.
17.7
16
Sothern
However, Ambuja’s efforts to expand capacities would enable it to grow its cement volume better than the industry average. In Q1CY10, the company has added two grinding units of 1.5mn tonne each at Nalgarh (HP) and Dadri (UP), increasing the grinding capacity to 25mn tonnes. It also plans to add another grinding unit of 1mn tonne each at Maharashtra and Chhattisgarh by the end of CY10, taking the cement capacity to 27mn tonnes. Thus, we expect Ambuja to post volume growth of 12.5% as compared to 10.4% of the industry in CY11. On the back of volume growth, we expect earnings of the company to grow at a CAGR of 4.6%.
Western
Source: Company, CMA, Elara Securities Research
All India ( ex ACC & ACL India) All India ( Inc ACC & ACL India)
CY09 ACL
Eastern
CY08 Industry
OPI
Favorable regional mix CY07
36
Ambuja
Source: Company, Elara Securities Research
4
Central
(%)
8
UltraTech
10
ICL
(1,410) SCL
(1,600)
(1,050)
(670) (620) (620)
ACC
12
(870)
JKL
Exhibit 1: ACL had moderate volume growth in past
6
130
0
JKCEM
For past three years, Ambuja’s cement volume grew at a CAGR 6% (as compared to 8.7% for the industry) due to capacity constraints and mismatch in clinker and cement capacity.
Exhibit 2: Ambuja to show improvement in margins
(bps)
Capacity addition to enhance volume
Source: CMA, Elara Securities Research
Elara Securities (India) Private Limited
Ambuja Cements Exhibit 4: Central zone dominates utilization in FY10
INR mn
104
Cash profit adjusted for non cash items
(%)
100
Add/Less : Working Capital Changes Operating Cash Flow
90
90 80
CY09
84
84
Less:- Capex
84
70 Sothern Western Eastern All India
North
14,525
16,531
17,057
6,562
(1,089)
609
21,087
15,442
17,665
(9,000) (10,000)
8,243
6,442
7,665
Free Cash Flow as a % of Mcap
4
3
3
Free Cash Flow as a % of EV
4
3
4
Source: Company, Elara Securities Estimates
Central
Source: CMA,, Elara Securities Research
Thus, Ambuja has a better regional mix than other large cap players. Exhibit 5: Focal presence in high growth North Centeral, 7 %
However, we do not expect the company to earn cash yield of more than 8% on its investments. Cement business is expected to earn RoCE of ~28%. Thus increase in proportion of cash in the balance sheet is expected to pull down the blended return ratios of the company. We expect the RoCE of Ambuja to decline from 23.4% in CY09 to 25.2% in CY10 and further to 22.6% in CY11. Dependence on grid, generators set to reduce
North, 42% West, 37%
East, 14% Source: Company, Elara Securities Research
Healthy balance sheet Ambuja has the strongest balance sheet among its peers. At the end of CY09, it had a net debt equity ratio of -0.22. As the operating cash flows of the company are likely to be much higher than its capex , we expect the company to generate free cash flow of INR14.1 bn over the next two years. Thus the net cash and investment of the company would increase from INR14.4bn at end of CY09 to INR23.6bn (INR16 per share, i.e. 10% of CMP) by the end of CY11. Free cash to firm as a percentage of EV is expected to be 4% in CY11. Exhibit 6: Key balance sheet data Net Debt Equity (x)
CY11E
(12,844)
Free Cash Flow
75
CY10E
Cement
110
Exhibit 7: Summary of free cash flow
CY09
CY10E
CY11E
(0.22)
(0.25)
(0.28)
Gross Cash & Investments(INR mn)
16,077
19,018 24,306
Net Cash & Investments(INR mn)
14,420
18,361 23,649
Net Cash & Investments(per share)
9
12
16
Net Cash & Investments as a % of CMP
6
8
10
In past 15 months, Ambuja has commissioned 93MW of CPP(15MW at Bhatapara in Chhattisgarh, 15MW at Maratha in Maharashtra, 33MW at Bhatapara in Chhattisgarh and 30MW at Ambujanagar in Gujarat ). The total power capacity of the company now stands at 400MW (265MW thermal and 135MW DG). On account of new thermal capacity coming on stream, dependence on grid and DG sets is expected to reduce. We expect company to save INR342mn (INR17 per tonne) in CY10 and INR720mn (INR 29 per tonne) in CY11. Apart from this we expect company to earn EBITDA of INR 125.4 mn, INR 84.6 mn in CY11 from sale of power. Exhibit 8: Source of power (%) CY09
CY10E
CY11E
Grid
20
3
3
DG
15
2
2
Thermal-CPP
65
95
95
Source: Company, Elara Securities Estimates
Source: Company, Elara Securities Estimates
Elara Securities (India) Private Limited
37
Ambuja Cements Exhibit 12: Imported coal inflates power costs 315
3.6
310 305
3.6
300
3.5
295
3.5
290
3.4
285
3.4
280 CY10E
963
1,000 900
857
800
757
700
CY11E
600
Blended electricity cost (LHS) Electricity cost per tonne (RHS)
CY09
CY10E
CY11E
Source: Company, Elara Securities Estimates
Exhibit 10: Revenue, profit from merchant power
Exhibit 13: Imported coal prices remain firm
Mn KWh
CY09
CY10E
CY11E
75
79
83
INR mn
Baltick dry Index
Source: Company, Elara Securities Estimates
14,000 12,000 10,000 8,000 6,000 4,000 2,000 0
200 150
Revenue
425
394
372
Cost
248
269
288
EBITDA
177
125
85
42
33
29
Revenue
6
5
5
Baltick dry index (LHS)
Cost
3
3
3
Source: Bloomberg, Elara Securities Research
EBITDA
2
2
1
Key risk
Per Unit
Source: Company, Elara Securities Estimates
Ambuja meets 30% of its fuel requirements through imports. Prices of imported coal have gone up YoY by 42% due to recovery in the global economy. Prices of domestic coal on the other hand have increased by only 10%-11%. Thus despite decline in raw material cost at a CAGR of 22.7%, the total cost per tonne is expected to increase at a CAGR of 2.6%. Exhibit 11: Fuel Mix Domestic Coal (%)
Imported Coal (%)
Petcoke (%)
Other (%)
ACC
85
15
0
0
Ultra Tech Cement
62
29
9
0
Shree Cement
0
0
100
0
India Cement
45
55
0
0
0
0
90
10
JK Lakshmi JK Cement Orient Paper Ambuja Cement
0
Richards Bay Coal Spot (RHS)
Sharp increase in cement prices
Reliance on imported coal to intensify cost pressure
Company
50
Apr-07 Jun-07 Sep-07 Dec-07 Mar-08 May-08 Aug-08 Nov-08 Feb-09 May-09 Jul-09 Oct-09 Jan-10 Apr-10 Jun-10 Sep-10
EBITDA margins(%)
100
Internatinoal Coal Prices
CY09
1,100
(INR per tonne)
3.7
(INR per tonne)
(kWh)
Exhibit 9: CPP slashes electricity costs
10
0
90
0
100
0
0
0
70
30
0
0
A higher than anticipated improvement in cement prices may improve the profitability of the company. One per cent increase in cement prices will augment the earnings of the company by 3.4% Faster ramp-up of new plant Any significant ramp-up in cement volumes, higher than our current estimates, will put our earnings estimates at risk.
Source: Company, Elara Securities Research *Higher as compared to peers due to production of white cement
38
Elara Securities (India) Private Limited
Ambuja Cements
Valuation & Recommendation Stock trades at 80% premium to its replacement cost, steep premium to peers Initiating coverage with Sell, target price of INR119 for its unwarranted valuation Valuing company at EV/tonne of USD140 per tonne on CY11 capacity
At the CMP of INR 148, Ambuja is trading at 17.2x and 16.9x its CY10 and CY11 earnings, respectively. On an EV/tonne basis, it is trading at USD184/tonne and USD180/tonne of its CY10 and CY11 capacities, respectively. The stock is presently trading at a whopping 80% premium to its replacement cost. We believe that such huge premium is unjustified for any cement company in the downturn. In terms of relative valuations, Ambuja is trading at ~38% premium to other frontline cement companies. We believe going ahead, the valuation gap between Ambuja and other large cap companies will reduce, particularly post restructuring UltraTech. Thus, we are initiating coverage on Ambuja with a SELL rating and a target price of INR 119. We have valued the company at EV /tonne of USD 140 on CY11 capacity of 25mn tonnes (though company will have grinding capacity of 27mn tonnes, 2mn tonnes of grinding capacity will be purely for logistic purpose).
Elara Securities (India) Private Limited
Exhibit 14: EV/tonne based valuations CY11E Grey Cement Capacity
mn tonnes
25.0
EV /tonne multiple
USD/tonne
140
Target EV
INR mn
157,500
Less: Net Debt
INR mn
(23,649)
Target Market Capitalization
INR mn
181,149
Diluted Shares outstanding
mn
Target Price
INR/ share
Current Market Price
INR/ share
Potential Upside/(downside)
(%)
1,524 119 148
Cement
Valuation
(19.8)
Source: Company, Elara Securities Estimates
39
Ambuja Cements
Company Description Ambuja Cements Limited was set up in 1986. The company is controlled by the Holcim group, which owns ~46%. The total capacity of the company, as on CY09, is 25 mn tonne with a 400 MW of captive power capacity. Ambuja has a presence in the north, east and western regions of India. Its plants are situated in Gujarat, Maharashtra, Himachal Pradesh, Punjab, Rajasthan, Uttarakhand, Chhattisgarh and West Bengal. Ambuja has bulk cement terminals at Muldwarka (Gujarat), Panvel, Navi Mumbai,Kochi and Surat. Ambuja is one of the major exporters of cement in India. The company largely exports to the Middle East.
Board of Directors & Management Narotam Sekhsaria, Non-Executive Chairman Narotam Sekhsaria is the Non-Independent NonExecutive Chairman of the Board of Ambuja effective from September 24, 2009. Sekhsaria holds a Bachelor's Degree in Chemical Engineering from the University of Bombay. He was the founder promoter and the Chief Executive and Managing Director of the company since its inception in April 1983 till January 2006. Sekhsaria relinquished the post of Managing Director when the management control was transferred to Holcim. In September 2009, he was appointed as Non-executive Chairman after Suresh Neotia relinquished the post of Chairman. Paul Hugentobler - Vice Chairman Paul Heinz Hugentobler serves as Non-Independent Non-Executive Director of Ambuja and has been appointed this position effective from September 24, 2009. Hugentobler obtained a degree in civil engineering from the Swiss Federal Institute of Technology, ETH, Zurich, and a degree in economic science from the University of St. Gallen. He joined
40
Holcim Group Support Limited as CEO of Siam City Cement, Bangkok, Thailand. He has been a Member of the Executive Committee of Holcim since January 2002 with responsibility for South Asia and ASEAN excluding Philippines. He joined the Board in May 2006. Onne Van Der - Managing Director Onne Van Der Weijde serves as CEO - Designate, Whole Time Director of Ambuja since February 17, 2010, and has been appointed as Managing Director effective May 1, 2010. He joined the Board as Non-executive Director in January 2009. Onne holds a Bachelors' degree in Economics & Accounting from Rotterdam, the Netherlands and a Master's degree in Business Administration from the University of Bradford, UK. In the year 1996 he joined Holcim and after holding various positions, he was appointed Director and General Manager for Holcim (India) Private Limited. in March 2005. He was the CFO of ACC for around 2 years during 2006-2008. He possess more than 15 years of experience in cement industry including 5 years in Indian cement industry.
Elara Securities (India) Private Limited
Ambuja Cements
Coverage History 160
1
140 120 100 80 60
20
Not Covered
Date 1
Rating
02-Nov-2010 Sell
Target Price
Closing Price
INR119
INR148
Covered
Oct-10
Nov-10
Sep-10
Aug-10
Jul-10
Jun-10
May-10
Apr-10
Mar-10
Jan-10
Feb-10
Dec-09
Nov-09
Oct-09
Sep-09
Aug-09
Jul-09
Jun-09
May-09
Apr-09
Mar-09
Feb-09
Jan-09
Dec-08
Nov-08
Oct-08
Sep-08
Aug-08
Jul-08
Jun-08
May-08
Apr-08
0
Cement
40
Guide to Research Rating BUY
Absolute Return >+20%
ACCUMULATE
Absolute Return +5% to +20%
REDUCE
Absolute Return -5% to +5%
SELL
Absolute Return < -5%
41
Ambuja Cements
Notes
42
Elara Securities (India) Private Limited
9 November 2010
India | Cement
Initiating Coverage
In the region of comfort
Rating : Accumulate
Pan-India presence to reduce regional risks
Target Price : INR1,123 Upside : 6% CMP : INR1,062 ( As on 2 November 2010)
ACC Limited (ACC) has a presence in all five regions of India, hence runs a lower regional risk as compared to other major cement players. Out of the total ~27.5 mn tonnes of capacity, 36% is in South India, where, we believe due to the surplus situation, pricing power will be the lowest. However, we consider that the presence of the company in other regions with a better demand supply situation (23% in Eastern region and 19% in Central region) will improve its overall profitability. Thus, the pan-India presence of the company will insulate it from regional risks. Reliance on domestic coal to insulate margins from rising costs Power and fuel costs constitute ~27% of the ACC’s cost of goods sold. The company meets 85% (75% through linkages) of its fuel requirement through the domestic coal. Prices of domestic coal are not as volatile as that of imported coal. Thus dependence on domestic coal provides a greater cost visibility to ACC as compared to its peers. Prices of imported coal have increased ~42% YoY. We believe that ACC will have a cost advantage of ~INR 96/ tonne as compared to players depending on imported coal, and INR103/ tonne as compared to players dependent on petcoke.
Key data* Bloomberg /Reuters Code Current /Dil. Shares O/S (mn) Mkt Cap (INRbn/USDmn) Daily Vol. (3M NSE Avg.) Face Value (INR)
ACC IN/ACC.BO 188/188 200/4,495 432,034 10
1 USD= INR44.4
Source: Bloomberg ; * As on 2 November 2010
Price & Volume 1,100
4
1,000
3
900
2
800
1
700 600
0
Oct-09 Mar-10 Vol. in mn (RHS)
Jul-10
Nov-10 ACC (LHS)
Source: Bloomberg
Healthy balance sheet to support distress acquisitions
Share holding (%)
At the end of CY09, ACC had a net cash and investment of INR16.6bn and net debt equity ratio of -0.15. We expect ACC to generate free cash flow of INR11.3bn over next two years. Thus, the net cash and investment of the company is expected to increase to ~INR28.5 bn (INR 152 per share, i.e. 14% of CMP) by end of CY11. Strong balance sheet will also enable the company to capitalize on any distress opportunity that might be available in the down turn.
Q4CY09 Q1CY10 Q2CY10 Q3CY10
Promoter
46.2
46.2
46.2
46.2
Institutional Investors
32.0
32.4
32.8
33.1
Other Investors
6.3
6.2
5.9
6.1
General Public
15.5
15.2
15.1
14.6
Source: BSE
Price performance (%)
3M
6M
12M
Sensex
12.3
17.0
32.1
ACC
28.0
17.5
51.9
Ultratech
30.1
17.5
51.5
Ambuja
26.4
23.1
74.7
Source: Bloomberg
Valuation At the CMP of INR 1,062 per share, the stock is trading at 16.7x and 15x its CY10 and CY11 earnings, respectively. It is trading at EV/tonne of USD131 and USD122 of its CY10 and CY11 capacities, respectively. With narrowing of the gap in debt equity ratio and EBITDA per tonne between ACC and Ambuja, we expect that the valuations gap between the two also to narrow down further. (Kindly refer to Exhibit no. 12 and Exhibit no. 13 on page no 49). Thus we are initiating our coverage on ACC with Accumulate rating and a price target of INR1,123 per share. We have valued the company at USD133 on CY11 capacity.
Stock performance 160 Rebased to 100
Global Markets Research
ACC
140 120 100 80 Nov-09
Feb-10
May-10
ACC
Aug-10
Nov-10
Sensex
Source: Bloomberg
Key Financials Y/E Mar (INR mn) CY08 CY09 CY10E CY11E
Rev
YoY (%)
EBITDA
EBITDA (%)
Adj PAT
73,086 80,272 77,346 91,932
4.5 9.8 (3.6) 18.9
17,332 24,531 18,426 21,459
23.7 30.6 23.8 23.3
11,737 15,881 11,940 13,265
YoY (%) Fully DEPS (7.5) 35.3 (24.8) 11.1
62.5 84.5 63.5 70.6
RoE (%) 25.9 29.0 18.5 17.9
P/E (x) EV/tonne (USD) EV/EBITDA (x) 17.0 12.6 16.7 15.0
176.5 149.8 130.7 121.5
10.8 7.5 10.2 8.0
Source: Company, Elara Securities Estimates
Ravindra Deshpande • [email protected] • +91 22 4062 6805 Ravi Sodah • [email protected] • +91 22 4062 6817 Elara Securities (India) Private Limited
ACC
Valuation trigger
Ramp up of Maharashtra cement capacity
Ramp up of Karnataka cement capacity
1,200 1
3
2
Investment summary
Pan-India presence to reduce regional risks
Dependence on domestic coal to provide cost advantage
Healthy balance sheet
1,000 800 600
Target price reached
400
Valuation trigger
200
1. Ramp up of Karnataka cement capacity Oct-11
Jun-11
Aug-11
Apr-11
Feb-11
Oct-10
Dec-10
Jun-10
Aug-10
Apr-10
Feb-10
Oct-09
Dec-09
Jun-09
Aug-09
Apr-09
Feb-09
Oct-08
Dec-08
Jun-08
Aug-08
Apr-08
0
2. Ramp up of Maharashtra capacity
cement
Source: Bloomberg, Elara Securities Estimates
Key risks Valuation overview - EV/tonne based valuations CY11E Capacity
mn tonnes
30.5
EV /tonne multiple
USD/tonne
133
EV
INR mn
182,543
Less: Net Debt
INR mn
(28,487)
Target Market Capitalization
INR mn
211,030
Diluted Shares outstanding
mn
Sharp decline in cement prices
Slow down in cement demand
Our assumptions
Cement volume to grow at a CAGR of ~5.7%
Cost per tonne to increase at a CAGR of 6.4%
Realizations to increase at a CAGR of 1.5%.
188
Target Price
INR/ share
1,123
Current Market Price
INR/ share
1,062
Potential Upside/(downside)
(%)
5.7%
Source: Company, Elara Securities Estimates
250
50
200
40 30
150
%
USD/tonne
Valuation driver - EV/tonne , RoE and RoCE
20 100
10
50
0
0 FY95 FY96 FY97 FY98 FY99 FY00 FY01 FY02 FY03 FY04 FY05 CY05 CY06 CY07 CY08 CY09 CY10E CY11E
(10)
EV/Tonne in USD (LHS)
RoNW (RHS)
RoCE (RHS)
Source: Elara Securities Estimates
44
Elara Securities (India) Private Limited
ACC
Financials (Y/E Dec) 91,932
EBITDA
17,332
24,531
18,426
21,459
2,887
2,411
3,053
3,256
20,219
26,942
21,479
24,715
Add:- Non operating Income OPBIDTA Less :- Depreciation & Amortization EBIT
2,942
3,421
3,953
5,397
17,277
23,521
17,526
19,317
Less:- Interest Expenses PBT Less :- Taxes Adjusted PAT
400
843
579
367
16,878
22,678
16,948
18,950
5,140
6,797
5,008
5,685
11,737
15,881
11,940
13,265
Add/Less: - Extra-ordinaries
391
186
-
-
12,128
16,067
11,940
13,265
Balance Sheet (INR mn)
CY08
CY09
CY10E
CY11E
Share Capital
1,879
1,880
1,880
1,880
47,399
58,282
67,176
77,396
Borrowings
4,820
5,669
5,109
2,049
Deferred Tax (Net)
3,358
3,493
3,493
3,493
Total Liabilities
57,455
69,324
77,658
84,818
Gross Block
58,357
68,263
106,325
109,575
Reported PAT
Reserves
Less:- Accumulated Depreciation
23,660
26,680
30,633
36,030
Net Block
34,697
41,583
75,692
73,545
Add:- Capital work in progress
16,029
21,562
500
250
Investments
Revenue & margins growth trend 100,000
35 30.6
90,000
30
80,000 23.8
23.7
23.3
70,000 60,000
20 CY08
CY09
Net Revenues (LHS)
CY10E CY11E EBITDA Margin (RHS)
Source: Company, Elara Securities Estimate
Adjusted profits growth trend 35.3
20,000
40 30
15,000 10,000
11.1
10 0
5,000
(10)
(24.8)
(20)
0
(30) CY08
CY09
CY10E
CY11E
14,756
14,756
14,756
(61)
(8,578)
(13,291)
(3,733)
57,455
69,324
77,658
84,818
Source: Company, Elara Securities Estimate
CY08
CY09
CY10E
CY11E
16,081
21,857
15,419
17,815
1,003
2,504
(194)
3,667
17,083
24,362
15,225
21,481
(14,762)
(15,154)
(17,000)
(3,000)
2,321
9,208
(1,775)
18,481
(2,971)
(4,546)
(4,184)
(6,472)
Investing Cash Flow
3,058
(6,658)
1,052
1,215
Net change in Cash
2,408
(1,997)
(4,907)
13,224
Ratio Analysis
CY08
CY09
CY10E
CY11E
4.5
9.8
(3.6)
18.9
EBITDA Growth
(9.7)
41.5
(24.9)
16.5
PAT Growth@
(7.5)
35.3
(24.8)
11.1
EBITDA Margin
23.7
30.6
23.8
23.3
Net Margin@
16.1
19.8
15.4
14.4
Net Debt/Equity (x)
(0.3)
(0.2)
(0.1)
(0.3)
ROE (%)
25.9
29.0
18.5
17.9
ROCE (%)
32.8
37.1
23.8
23.8
Total Assets Cash Flow Statement (INR mn) Cash profit adjusted for non cash items Add/Less : Working Capital Changes Operating Cash Flow Less:- Capex Free Cash Flow Financing Cash Flow
Adjusted PAT (LHS)
PAT Growth (RHS)
Return ratios (%) 37.1
40 32.8 30
29.0 20
23.8
23.8
18.5
17.9
CY10E
CY11E
25.9
10
Income Statement Ratios(%)
CY08
Revenue Growth
20
(7.5)
6,791
Net Working Capital
25
Cement
CY11E
77,346
(%)
CY10E
80,272
(%)
CY09
73,086
(INR mn)
CY08
Net Revenues
(INR mn)
Income Statement (INR mn)
CY09 ROE (%)
ROCE (%)
Source: Company, Elara Securities Estimate
Return & Liquidity Ratios
Strong cash & investment book
Per Share data & Valuation Ratios Diluted EPS (INR/Share)
62.5
84.5
63.5
70.6
EPS Growth (%)
(7.5)
35.3
(24.8)
11.1
DPS (INR/Share)
37.5
43.2
26.0
26.0
P/E Ratio (x)
17.0
12.6
16.7
15.0
EV/EBITDA (x)
10.8
7.5
10.2
8.0
2.6
2.3
2.4
1.9
176.5
149.8
130.7
121.5
3.5
4.1
2.5
2.5
EV/Sales (x) EV/tonne (USD) Dividend Yield (%)
Trading at a discount to its peers
Source: Company, Elara Securities Estimate
Elara Securities (India) Private Limited
45
ACC ACC
Investment rationale Presence in all major regions to temper larger exposure to South Dependence on domestic coal to shield against volatility in imported fuel prices Healthy balance sheet
Pan-India presence assuages regional risks ACC, through its 16 plants, has a presence in all five regions of India. Out of total cement capacity of 26 mn tonnes, 23% is in the North, 36% in South, 19% in East, 4% in West and 18% in Central India. Though as of now, the share of the Western region is marginal, it is expected to increase post commissioning of the Chanda plant in Maharashtra. Exhibit 1: Lowest exposure to Western region East 19%
North 23%
West 4%
Central 18% South 36% Source: Company, Elara Securities Research
Exhibit 2: CY11 to improve Western presence East 16%
North 21%
However, we believe that the presence of the company in Eastern and Central regions would improve its overall profitability. We expect these regions to have a better pricing environment as compared to other regions in India. The average capacity utilization of Eastern and Central region is likely to be 1,400 bps and 900 bps (respectively) higher than the pan India average. We expect players having a presence in Central and Eastern regions to earn 21% higher EBIT per tonne as compared to players with a pan India presence. Even data indicates that historically, magnitude and timing of the price decline have been different for various regions of India. Thus with its presence in all five regions, ACC runs a lower regional risk. Lower fuel risk due to dependence on domestic coal
West 15%
South 32%
On a regional basis, ACC has the highest exposure in the Southern region where we expect average capacity utilizations between FY11-FY13 to be 900 bps below the all India average. We also expect prices in the Southern players to earn 36% lower EBIT per tonne than those having a presence in other regions.
Power and fuel costs constitute ~27% of ACC’s the cost of goods sold. It meets 85% (75% through linkage) of its fuel requirement through domestic coal.
Central 16%
Source: Company, Elara Securities Research
Exhibit 3: Relevance of pan-India presence: Magnitude, timing of price declines different for various regions 30
(% Change)
20 10 0 (10) (20) FY96
FY97
FY98 Northern
FY99 FY00 Central
FY01 FY02 FY03 Eastern Western
FY04 FY05 Southern
FY06 FY07 FY08 All India average
FY09
Source: Company, Elara Securities Research
46
Elara Securities (India) Private Limited
ACC
Imported Coal (%)
Petcoke (%)
Other (%)
ACC
85
15
0
0
UltraTech
Company
62
29
9
0
Shree Cement
0
0
100
0
India Cement
45
55
0
0
JK Lakshmi
0
0
90
10
JK Cement
10
0
90
0
100
0
0
0
70
30
0
0
Orient Paper Ambuja
Source: Elara Securities Research
Prices of domestic coal are not as volatile as that of imported coal. Coal India and its subsidiary have increased coal prices by 10% to 11% in Q3FY10, first time since Q3FY08. Thus, the dependence on domestic coal provides a greater cost visibility to ACC as compared to its peers. We believe that ACC will have a cost advantage of ~INR 96/ tonne as compeered to players dependent on imported coal. It would be INR 103 / tonne as compared to players dependent on petcoke.
effective long-term energy supply assurances. ACC has also entered into a joint venture (~14% stake) with five other partners, and has been allotted a coal mine in West Bengal with a geological reserve of ~685mt. Hence, in long run, we expect the cost leadership of ACC to strengthen further as some of the coal blocks that have already been allocated to ACC will start production. However, as the mine is unlikely to begin production prior to CY11, we have not factored in any benefit from these mines. Capacity constraints restrict volume growth In CY10 (Jan-Sep’10), ACC has reported a decline volume of on 3.3% (as compared to 6.2% increase for the industry) due to capacity constraints. Exhibit 6: ACC grows slower than industry 20 15 10
(5) (15)
Coal Receipts as % of Coal production
1992-93
11
238
4
1993-94
10
246
4
1994-95
10
254
4
1995-96
10
270
4
1996-97
11
286
4
1997-98
10
296
3
1998-99
8
291
3
1999-00
9
299
3
2000-01
10
310
3
2001-02
11
323
3
2002-03
12
324
4
2003-04
13
356
4
2004-05
15
377
4
2005-06
15
407
4
2006-07
14
431
3
2007-08
15
456
3
2008-09
15
493
3
Source: CMA, Elara Securities Research
With the coal production in India not matching cement output, the share of coal received by cement sector has been gradually declining. It has become increasingly difficult for new players to obtain coal linkages Coal block allocations to hike fuel security in long run ACC has entered into a JV with the Madhya Pradesh State Mining Corporation to mine four coal blocks with mineable reserves of ~200mt. The mines are expected to become operational in 4-5 years, and will provide cost-
Elara Securities (India) Private Limited
0
May-09 Jun-09 Jul-09 Aug-09 Sep-09 Oct-09 Nov-09 Dec-09 Jan-10 Feb-10 Mar-10 Apr-10 May-10 Jun-10 Jul-10 Aug-10 Sep-10
Year
5
(10)
Exhibit 5: Sectoral coal allocation on a decline Receipts Coal production against linkage mn tonnes mn tonnes
Cement
Domestic Coal (%)
(%)
Exhibit 4: Dependent mainly on domestic coal
Industry
ACC
Source: CMA, Elara Securities Research
However, with the ramping up of the Karnataka plant and a new green field plant at Chanda expected to come on stream by end of CY10, we expect ACC to report a volume growth of ~15.8% in CY11. Healthy balance sheet At the end of CY09, ACC had a strong balance sheet with a net debt equity ratio of -0.15, with net cash and cash equivalents of INR16.6 bn. With operating cash flows of the company for next two years being much higher than the capex, we expect the net cash and investment of the company to INR ~28.5 bn (INR 152 per share, i.e 14% of CMP) by end of CY11. Exhibit 7: Key balance sheet data CY09
CY10E
CY11E
(0.15)
(0.07)
(0.27)
Gross Cash & Investments(INR mn)
22,220
17,313
30,536
Net Cash & Investments(INR mn)
16,551
12,203
28,487
88
65
152
8
6
14
Net Debt Equity (x)
Net Cash & Investments(per share) Net Cash & Investments as a % of CMP Source: Company, Elara Securities Estimates
47
ACC
INR mn
Exhibit 10: Energy efficiency improves
CY10E
CY11E
Cash profit adjusted for non cash items
21,857
15,419
17,807
Add/Less : Working Capital Changes
2,504
(194)
3,668
Operating Cash Flow
24,362
15,225
21,476
(15,154)
(17,000)
(3,000)
Free Cash Flow
9,208
(1,775)
18,476
Free Cash Flow as a % of Mcap
5
NA
9
Free Cash Flow as a % of EV
5
NA
11
Less:- Capex
Source: Company, Elara Securities Estimates
Lower power, fuel costs improve efficiency The blended electricity cost per unit for ACC has declined from INR 3.4 per kwh in CY08 to INR2.9 kwh due an increase in the use of CPP. Apart from this, ACC has been gradually reducing electricity and energy consumption per tonne of cement. Thus, despite a 4% increase in landed price of coal for ACC, its power and fuel cost had declined by 4.6% (INR34 per tonne)in CY09.
4.3
80
3.8
70
3
3.3 3 2.8
3
3
3
2
3
40
2.3 1.8 FY01
FY03
FY05
50
CY06
CY08
% of Power meet through CPP(RHS) Blended CPU(LHS) CPP cost per unit(LHS) Grid cost per unit(LHS)
95
800
90
780
85
760
80
740 720
75 FY01
FY03
FY05
CY06
KWH/tonne(LHS)
CY08
Kcal/kg of Clinker(RHS)
Source: Company, Elara Securities Research
Acquiring smaller cement companies ACC has acquired 45% stake in Asian Cement and 100% stake in Encore Cement. Asian Cement has a 0.3mt grinding unit in HP, and is adding a 1mt grinding unit. Encore Cement has a 0.2mt slag grinding unit at Vishakapatnam, thereby strengthening its presence in Coastal AP. As ACC has a strong balance sheet, we believe it will be able to capitalize on any distress opportunity that might be available in downturn.
Slowdown in cement demand Slow down of cement demand may worsen oversupply and could lead to a sharp decrease in cement prices.
60 3
3
3
820
Key risk
(%)
(INR per KWH)
Exhibit 9: Reliance on CPP to increase
100
(Kcal/kg of Clinker)
CY09
(kwh per tonne)
Exhibit 8: Summary of free cash flow
Delay in capacity addition
30
Delay in capacity additions could result in lower than expected volume growth for the company.
20
Decline in linkages Decline in coal linkages may increase the dependence of the company on imported coal.
Source: Company, Elara Securities Research
48
Elara Securities (India) Private Limited
ACC
Valuation & Recommendation Stock trades at EV/tonne of USD122, discount to frontline players Valuing at EV/tonne of USD133 on CY11 capacity, 5% discount to Ambuja Initiating coverage with Accumulate rating, target price of INR1,123
0.0
CY11
CY10
CY09
CY08
Exhibit 13: EBITDA per tonne gap to narrow down
We also expect the net debt equity ratio for both companies to be almost at par at the end of CY11. Thus, we believe that valuation gap between two to come down to 5%.
1,200 INR per tonne
1,000 800 600 400 200
ACC
CY11
CY10
CY09
CY08
CY07
CY06
CY05
FY05
FY04
FY03
FY00
0
Ambuja Cement
Source: Company, Elara Securities Research
Exhibit 14: EV/tonne based valuations
290
CY11E
240
(USD per tonne)
CY07
CY06
CY05
FY05
FY03
FY04
Ambuja Cement
Source: Company, Elara Securities Research
1,400
Exhibit 11: Present valuation gap unjustified
FY02
ACC
(b) Dependences on domestic coal
We are initiating our coverage on ACC with an Accumulate rating and a price target of INR1,123 per share. We have valued the company at EV/tonne of USD133 (5% discount to Ambuja) on CY11 capacity of 30.5 mn tonne.
FY01
(0.5)
Cement
0.5
FY02
(a) Cost cutting initiatives undertaken by the company,
1.0
FY01
Historically, EBITDA per tonne gap between ACC and Ambuja has been ~37%. We believe that going ahead, the gap in EBITDA per tonne would reduce to 9% due to:-
1.5
FY00
Historically ACC has traded at 25% discount to Ambuja due to weaker balance sheet and lower profitability. However, going ahead we expect a gap in both debt equity and the EBITDA per tonne to reduce.
Exhibit 12: Debt equity of ACC, Ambuja to be at par
(x)
At the CMP of INR 1,062 per share, the stock is trading at 16.7x and15x its CY10 and CY11 earnings, respectively. It is also trading at EV/tonne of USD131 and USD122 of its CY10 and CY11 capacities, respectively.
190 140 90
ACC
Ambuja Cement
Source: Company, Elara Securities Research
CY11
CY10
CY09
CY08
CY07
CY06
CY05
FY05
FY04
FY03
FY02
FY01
FY00
40
Capacity
mn tonnes
30.5
EV /tonne multiple
USD/tonne
EV
INR mn
182,543
Less: Net Debt
INR mn
(28,487)
Target Market Capitalizations
INR mn
211,030
Diluted Shares outstanding
mn
133
188
Target Price
INR/ share
1,123
Current Market Price
INR/ share
1,062
Potential Upside/(downside)
(%)
5.7%
Source: Company, Elara Securities Estimates
Elara Securities (India) Private Limited
49
ACC
Company description Established in 1936 by the merger of ten cement companies, ACC Limited is one of India’s oldest cement manufacturers. The company’s current capacity stands at 26mt. Swiss cement major Holcim has taken over the control and management of ACC through Ambuja Cement India Pvt Ltd (ACIL). With its stakes in Ambuja Cement and ACC, Holcim controls about 51mt of cement capacity (approximately ~19% of India’s capacity). ACC has a presence in all major regions. Since the entry of Holcim, ACC has decided to focus on its core cement business, and has divested most of its noncore businesses including its refractory and asbestos business. The company has also transferred its RMC business to a wholly-owned subsidiary, ACC Concrete Ltd, with effect from January 1, 2008.
Board of Directors & Management Narotam Sekhsaria, Non-Executive Chairman NS Sekhsaria serves is the Non-Executive Chairman of ACC He is also the founder-promoter and current Chairman of Ambuja. Paul Hugentobler - Non-Executive Deputy Chairman Paul Hugentobler serves as Non-Executive Deputy Chairman of the Board of ACC. He has a degree in Civil Engineering from the ETH, Zurich, and a degree in Economic Science from the University of St. Gallen. He joined Holcim Group Support Ltd in 1980 as Project Manager and in 1994, he was appointed as Area
50
Manager for Holcim. From 1999 until 2000, he also served as CEO of Siam City Cement, Bangkok, Thailand. He has been a Member of the Executive Committee since January 1, 2002 with the responsibility for South Asia and ASEAN excluding Philippines. He has been appointed as Vice Chairman of Ambuja Cements Ltd with effect from September 24, 2009. Sunil K Nayak - Chief Financial Officer Sunil K. Nayak serves as Chief Financial Officer. He has B.Com, LLB degrees, and is FCS, FCA, and AICWA. His last employment was with Clariant Chemicals (India) Limited.
Elara Securities (India) Private Limited
ACC
Coverage History 1,200 1 1,000 800 600
200
Not Covered
Date 1
Rating
02-Nov-2010 Accumulate
Target Price
Closing Price
INR1,123
INR1,062
Covered
Oct-10
Nov-10
Sep-10
Aug-10
Jul-10
Jun-10
May-10
Apr-10
Mar-10
Jan-10
Feb-10
Dec-09
Nov-09
Oct-09
Sep-09
Aug-09
Jul-09
Jun-09
May-09
Apr-09
Mar-09
Feb-09
Jan-09
Dec-08
Nov-08
Oct-08
Sep-08
Aug-08
Jul-08
Jun-08
May-08
Apr-08
0
Cement
400
Guide to Research Rating BUY
Absolute Return >+20%
ACCUMULATE
Absolute Return +5% to +20%
REDUCE
Absolute Return -5% to +5%
SELL
Absolute Return < -5%
Elara Securities (India) Private Limited
51
ACC
Notes
52
Elara Securities (India) Private Limited
9 November 2010
India | Cement
Initiating Coverage
Warming South winds
Rating : Accumulate
High exposure to South a concern; hopes pinned on better prices
Target Price : INR131 Upside : 13% CMP : INR116 (* As on 2 November 2010)
Out of total 14mn tonnes of cement capacity of India Cements Limited (ICL), about 92% of the capacity is in the Southern region. Due to lower consolidation and lower capacity utilizations, we expect south based players to earn 36% lower EBIT per tonne than players in other regions. However, in the recent past, South cement players have shown signs of maturity and better coordination. In past few weeks, cement prices in the region have increased by INR 75-100/bag.
Key data* Bloomberg /Reuters Code Current /Dil. Shares O/S (mn) Mkt Cap (INRbn/US$mn) Daily Vol. (3M NSE Avg.) Face Value (INR)
Cost rationalization in progress; return ratios to reflect the effort
ICEM IN/ICMN.BO 307.2/307.2 36 /803 1,800,771 10
1 US$= INR44.4
In order to rationalize the cost structure, ICL has acquired a coal mine in Indonesia, and is in the process of setting up CPP of 100 MW. We believe that the mine acquisition will result in savings of ~INR 200/tonne from FY12 onwards. The CPP is expected to generate additional savings of INR 50/tonne from Q3FY12. Historically return ratios of ICL have been below industry average due to lower profitability and inefficient utilization of capital. However, with the cost rationalization steps undertaken by the company and the recent rise in cement prices in South, we believe that return ratios will gradually improve going ahead.
Source: Bloomberg ; * As on 2 November 2010
Price & Volume 150
20
140
15
130 120
10
110
5
100 90
0
Oct-09 Mar-10 Vol. in mn (RHS)
IPL not factored in total valuation scoreboard
Jul-10 Nov-10 India Cement (LHS)
Source: Bloomberg
India Cements owns franchise rights of an IPL team (Chennai Super Kings). We believe that the present stock price does not reflect the valuations of IPL team. With few of the IPL teams expected to list in near future we believe that market will gradually start factoring IPL valuations in stock price. We have valued the investment in IPL at USD225mn which was the base price for the bidding of new franchises. Any increase in the valuation of IPL franchise will add to the potential upside in the stock. (Please refer to Exhibit 13 on Page 59 for target valuations at different IPL valuations).
Share holding (%)
Q3FY10 Q4FY10 Q1FY11 Q2FY11
Promoter
27.4
25.2
25.2
25.2
Institutional Investors
44.3
48.1
46.4
44.5
Other Investors
18.0
17.9
20.0
22.4
General Public
10.4
8.9
8.4
8.0
Source: BSE
Price performance (%)
Valuation
3M
6M
12M
Sensex
12.3
17.0
32.1
India Cements
13.2
(5.6)
18.3
Ultratech
30.1
17.5
51.5
ACC
28.0
17.5
51.9
Source: Bloomberg
At the CMP of INR116 per share, the stock is trading at 18.4x and 10.7x its FY11E and FY12E earnings, respectively. It is trading at adjusted EV/tonne of USD62 and USD56 of its FY11 and FY12 capacities respectively. We have assigned our distress case valuation of USD62/tonne for the cement business considering the unfavorable regional presence and relative cost disadvantage. We have valued the investment in IPL at USD225mn which was the base price for the bidding of new franchises. We recommend Accumulate on ICL with target price of INR 131.
Stock performance 140 Rebased to 100
Global Markets Research
India Cements
120 100 80 Nov-09
Feb-10
May-10
India Cement
Aug-10
Nov-10
Sensex
Source: Bloomberg
Key Financials Y/E Mar (INR mn) FY09 FY10 FY11E FY12E
Rev
YoY (%)
34,974 38,293 42,565 46,738
14.8 9.5 11.2 9.8
EBITDA EBITDA (%) 9,898 8,153 6,417 11,367
28.3 21.3 15.1 24.3
Adj PAT
YoY (%)
Fully DEPS
RoE (%)
4,835 3,171 1,942 3,344
40.7 (34.4) (38.9) 72.5
16.8 10.5 6.3 10.9
16.1 10.4 5.2 7.8
P/E (x) EV/tonne (USD) EV/EBITDA (x) 6.9 11.0 18.4 10.7
65.0 67.1 62.4 55.7
4.6 6.2 7.9 4.2
Source: Company, Elara Securities Estimate
Ravindra Deshpande • [email protected] • +91 22 4062 6805 Ravi Sodah • [email protected] • +91 22 4062 6817 Elara Securities (India) Private Limited
India Cements Valuation trigger
CPP’s coming on stream
Any disinvestment or listing of IPL franchise in future
Ramping up of the coal production from mine
250 200 150
Oct-11
Jun-11
Aug-11
Apr-11
Feb-11
Oct-10
Dec-10
Jun-10
Aug-10
Apr-10
Feb-10
Oct-09
Dec-09
Jun-09
Aug-09
Apr-09
Feb-09
Oct-08
Dec-08
Jun-08
0
Aug-08
Market leader in South India
IPL valuations key to upside
1. Ramping up of the coal production from mine
Target price reached
Apr-08
New CPP’s and coal mine acquisition to reduce power and fuel cost
Valuation trigger
100 50
3 4
2
1
Investment summary
Source: Bloomberg, Elara Securities Estimates
Valuation overview - SOTP Based valuations FY12E 15.6
2. CPP’s coming on stream 3. Any disinvestment or listing of IPL franchise in future
Key risks
Sharp decline in cement price
Slower than expected ramp up of coal mine and CPP’s
Capacity
mn tonnes
EV /tonne multiple
USD/tonne
Grey Cement business EV
INR mn
43,580
Base price for the bids
INR mn
10,125
Total EV
INR mn
53,705
Our assumptions
Less: Net Debt
INR mn
13,588
Target Market Capitalization
INR mn
40,117
Diluted Shares outstanding
mn
Cement realization to increase at a CAGR of 1.6%
Target Price
INR/ share
131
Current Market Price
INR/ share
116
Cement volumes CAGR of 9.4%
Potential Upside/(downside)
(%)
12.5
62
Value of IPL Business
307.2
to increase at a
Source: Company, Elara Securities Estimates
Valuation driver - EV/tonne with change in RoCE & RoNW 60
180
40
140 20
120
0
100 80
%
EV/tonne
160
(20)
60 (40)
40 20 FY95 FY96 FY97 FY98 FY99 FY00 FY01 FY02 FY03 FY04 FY05 FY06 FY07 FY08 FY09 FY10 FY11E FY12E
(60)
EV/Tonne(USD)
ROE(RHS)
ROCE (RHS)
Source: Elara Securities Estimates
54
Elara Securities (India) Private Limited
India Cements
Consolidated Financials (Y/E Mar)
14.8 3.5 40.7 28.3 21.0
9.5 (17.6) (34.4) 21.3 8.4
11.2 (21.3) (38.9) 15.1 4.6
9.8 77.1 72.5 24.3 7.2
0.7 16.1 33.4
0.7 10.4 11.3
0.5 5.2 17.6
0.4 7.8 33.8
16.8
10.5 (37.6) 2.0 11.0 6.2 1.4 67.1 1.7
6.3 (39.8) 0.3 18.4 7.9 1.3 62.4 0.2
10.9 72.2 0.5 10.7 4.2 1.1 55.7 0.4
Revenue & margins growth trend 50,000
40
33.6
40,000
30
24.3
21.3
30,000
15.1
20
20,000
10
10,000 0
0 FY09
FY10
Net Revenues (LHS)
FY11E
FY12E
EBITDA Margin (RHS)
Source: Company, Elara Securities Estimates
Adjusted profits growth trend 72.5
6,000
80
40.7
5,000
60 40
4,000
20
3,000
0
2,000
(34.4)
(38.9)
Cement
FY12E 46,738 11,367 269 11,636 3,547 8,089 3,442 4,647 1,303 3,344 1 0 3,343 0 3,343 FY12E 3,073 47,989 114 21,808 2,903 75,887 72,238 24,366 47,872 7,337 3,195 17,287 196 75,887 FY12E 10,516 10,469 20,985 (1,855) 19,130 (7,475) 11,655 FY12E
(%)
FY11E 42,565 6,417 468 6,885 2,711 4,174 1,455 2,719 781 1,938 (3) 0 1,942 0 1,942 FY11E 3,073 44,628 113 25,676 2,903 76,393 69,188 20,818 48,370 8,532 3,195 16,101 196 76,393 FY11E 11,717 6,079 17,796 (6,029) 11,767 1,115 1,953 14,835 FY11E
(%)
FY10 38,293 8,153 422 8,575 2,345 6,231 1,428 4,802 1,632 3,171 0 57 3,228 (291) 3,518 FY10 3,073 37,381 15 23,006 2,903 66,378 57,400 18,011 39,388 14,291 5,148 7,345 206 66,378 FY10 6,919 7,865 14,784 (10,238) 4,546 3,885 (1,623) 6,808 FY10
(INR mn)
FY09 34,974 9,898 544 10,442 2,045 8,397 1,123 7,274 2,439 4,835 8 (73) 4,754 529 4,224 FY09 2,825 32,518 31 19,888 2,744 58,006 53,360 15,121 38,239 9,040 3,556 6,828 158 185 58,006 FY09 9,132 6,816 15,948 (9,446) 6,502 (1,041) 289 5,750 FY09
(INR mn)
Income Statement (INR mn) Net Revenues EBITDA Add:- Non operating Income OPBIDTA Less :- Depreciation & Amortization EBIT Less:- Interest Expenses PBT Less :- Taxes Adjusted PAT Minority interest Profit from Associates Adj. after Minority interest & asso. Add/Less: - Extra-ordinaries Reported PAT Balance Sheet (INR mn) Share Capital Reserves Minority Interest Borrowings Deferred Tax (Net) Total Liabilities Gross Block Less:- Accumulated Depreciation Net Block Add:- Capital work in progress Investments Net Working Capital Miscellaneous Expenses not written off Deferred Tax Assets Total Assets Cash Flow Statement (INR mn) Cash profit adjusted for non cash items Add/Less : Working Capital Changes Operating Cash Flow Less:- Capex Free Cash Flow Financing Cash Flow Investing Cash Flow Net change in Cash Ratio Analysis Income Statement Ratios (%) Revenue Growth EBITDA Growth PAT Growth@ EBITDA Margin Net Margin@ Return & Liquidity Ratios Net Debt/Equity (x) ROE (%) ROCE (%) Per Share data & Valuation Ratios Diluted EPS (INR/Share) EPS Growth (%) DPS (INR/Share) P/E Ratio (x) EV/EBITDA (x) EV/Sales (x) EV/tonne (USD) Dividend Yield (%)
(20)
1,000
(40)
0
(60) FY09
FY10
Adjusted PAT (LHS)
FY11E
FY12E PAT Growth (RHS)
Source: Company, Elara Securities Estimates
Return ratios 40
33.8
33.4
30 17.6
20 10
11.3 16.1 10.4
0 FY09
FY10 ROE (%)
5.2
7.8
FY11E
FY12E
ROCE (%)
Source: Company, Elara Securities Estimates
Debt-equity ratio to come down
2.0 6.9 4.6 1.4 65.0 1.7
Available at distress valuations despite sharp increase in prices in South India
@ On adjusted bottomline Source: Company, Elara Securities Estimates
Elara Securities (India) Private Limited
55
India Cements India Cements Investment rationale Higher exposure to South worrisome; profitability to remain below industry average Indonesian coal mine acquisition, new captive power plants to improve cost efficiency Lower return ratios to perk up on better pricing and cost efficiency
ICL is the market leader in the Southern region. It controls about 14% of the South Indian capacity. Out of total 14 mn tonnes of cement capacity, about 92% of the capacity of ICL is in the Southern region. It is gradually trying to diversify in other regions. The company will be adding 1.5 mn tonnes of cement capacity in the state of Rajasthan. Even post commissioning of Rajasthan plant in Q2FY11, it will have a whopping 83% of the capacity in South India, the region which is expected to have the lowest capacity utilizations. During the last three years, about 39mn tonnes of capacity were added in the Southern region at a CAGR of 20%. Demand, on the other hand has grown at a CAGR of 12%. Thus capacity utilizations of the region have declined from 93% in FY06 to 74% in FY10 (i.e 1,200 bps below pan-India average). Exhibit 1: Higher concentration of capacity in South
of the South region is expected to be 900 bps lower than the all India average. Due to surplus in the Southern region, we expect the average lead distance for ICL to increase which will further put pressure on margins. Furthermore, due to lower consolidation and lower capacity utilization, we expect south based players to earn 36% lower EBIT per tonne than players in other regions. However in the recent past cement players in the Southern region have shown signs of maturity and better co-ordination. The players have undertaken production cuts to reduce supply and thereby, affect a hike in prices. Thus, the Southern region has been the first to hike cement prices at the end of the lean season. In past few weeks, cement prices have increased by INR 75-100 per bag (the highest among five major regions of India). Exhibit 3: South leads industry capacity addition 20
15
15
West 8%
18
High exposure to a fragmented market
3 3 4 2 2
2 2
0
2
3
3 3 3
2 2
5
5
6
6
7
10
10
10
3
(mn tonne)
15
0 North Western FY09 FY10
South 92%
Central Eastern Southern FY11E FY12E FY13E
Source: Company, Elara Securities Estimates
Exhibit 4: Capacity utilization to stay low in South
82 82
89 86
74 72 75
80
89
87 86 89 89
89 87 86 82
85
84
90
86
(%)
95
80
100
94
105
94
North West 10% 7%
104 100
Exhibit 2: Southern exposure to come down in FY11
93
Source: Company, Elara Securities Research
75 70
North Western Central Eastern Southern All India FY09 FY10 FY11E FY12E
South 83%
56
Source: Company, Elara Securities Research
Source: CMA .Company, Elara Securities Estimates
Going ahead, we expect capacity utilizations of Southern region to continue to remain below all India average. Between FY11 to FY13, the average capacity utilizations
Elara Securities (India) Private Limited
India Cements
30 20 10 0 (10)
ICL
ACC
Ambuja
Cement
Source: Company, Elara Securities Estimates
Exhibit 7: Lower asset turnover ratio vs peers 1.8 1.5 1.2 0.9 0.6
The company is also in the process of setting up a CPP of 50 MW each in Andhra Pradesh and Tamil Nadu. The TN plant is expected to come on stream by the end of Q1FY11 and TN plant in Q3FY12. The new CPPs are expected to meet 60% of the power requirement and would result in savings of INR 50/tonne.
0.3
ACC
India Cement
Ambuja Cement
Lower return ratios compared to industry peers
Source: Company, Elara Securities Estimates
In FY10, ICL had reported net profit margins of 8.4% and asset turnover of 0.7 x as compared to industry average of 16% and 1.1x respectively. Due to lower profitability and inefficient utilizations of capital, the company has below industry average return ratios. ICL reported a RoE of 10.4% and RoCE of 11% in FY10 as compared to industry average RoE of 28% and RoCE of 27%.
Exhibit 8: Cost rationalization to better margins 40 (EBITDA margin %)
ICL
ACC
Ambuja
Ambuja Cement
Exhibit 9: NPM to remain lower than peers
ACC
India Cement
FY12E
FY10
FY09
FY08
FY07
FY06
FY05
FY04
FY03
FY02
FY01
FY00
FY99
FY98
40 30 20 10 0 (10) (20) (30) FY11E
FY95 FY96 FY97 FY98 FY99 FY00 FY01 FY02 FY03 FY04 FY05 FY06 FY07 FY08 FY09 FY10 FY11E FY12E
(50)
India Cement
Source: Company, Elara Securities Estimates
FY97
0
10
ACC
(%)
(%)
50
20
0
Exhibit 5: ICL RoE to remain lower than peers 100
30
FY97 FY98 FY99 FY00 FY01 FY02 FY03 FY04 FY05 FY06 FY07 FY08 FY09 FY10 FY11E FY12E
However, with the initiative undertaken by the company to improve cost efficiency, the return ratios of the company are expected to improve. The RoCE of ICL is expected to improve from 11.3% in FY10 to 17.6% in FY11 and further to 33.8% in FY12. Improvement in RoE is likely to be much gradual due to QIP and redemption FCCB The RoE is expected to drop from 10.4% in FY10 to 5.2% in FY11 and to improve marginally to 7.8% in FY12.
FY12E
FY10
FY11E
FY09
FY08
FY07
FY06
FY05
FY04
FY03
FY02
FY01
FY00
FY99
FY97
0.0 FY98
Apart from this, ICL is entirely dependent on external sources for power. Higher dependence on external sources for power has not only increased the cost but also hampered the production due to power cuts in Andhra Pradesh and Tamil Nadu.
40
FY95 FY96 FY97 FY98 FY99 FY00 FY01 FY02 FY03 FY04 FY05 FY06 FY07 FY08 FY09 FY10 FY11E FY12E
ICL has recently acquired coal mining rights in Indonesia to meet its fuel requirements. The mine has reserves of 30mt of coal with 5,800Kcal/kg. ICL’s investment in this mine is estimated to be ~USD20mn. The benefits of the mine are expected to flow in from FY12. We expect the mine acquisition to result in savings of ~INR 200/tonne from FY12.
50
(%)
Power and fuel costs constitute ~31% of ICL’s cost of goods sold. ICL meets 70% of its fuel requirement through imports. Due to the dependence on imported coal, we expect ICL to have a cost disadvantage of INR62/tonne of cement produced as compared to players dependent on domestic coal.
Exhibit 6: RoCE to improve on higher cement prices
(x)
Reliance on foreign coal, grid limits cost competency
Ambuja Cement
Source: Company, Elara Securities Estimates
Source: Company, Elara Securities Estimates
Elara Securities (India) Private Limited
57
India Cements Higher debt equity ratio, FCCBs to burden cash flows
IPL valuation not fully reflected in share price
ICL has raised INR2.95 bn in Q1FY11. Post the QIP, the net debt equity ratio of the company now stands at 0.7, much higher compared to its peers. Apart from this higher debt equity ratio, pending FCCBs at USD 75 mn remain an overhang on the stock. . The FCCBs are due for redemption in May 2011 to be converted at a price of INR305 per share (163% higher than CMP) or redeemable at 147.7% of its face value. As the FCCBS are deep out of money, we expect its redemption to result in cash outflow of INR4.96bn, representing 47% of FY12 operating cash flow or 44% of FY12 EBITDA. Apart from this, the company is also expected to book unrecognized interest expenses of INR1.58bn in FY12. The unrecognized interest expenses will take away 32% of the incremental EBITDA of FY12.
India Cements has acquired the Chennai franchise of the Indian Premier League (IPL) for USD91mn in January 2008. The investment in IPL was done by the company from the point of view of advertising its brands across the country.
Exhibit 10: Higher debt equity ratio vs industry
Pune
Bid Amount (USD mn) 370
Kochi
333
Rendezvous Sports World Limited
Mumbai
112
Reliance Industries
Bangalore
112
UB Group
Hyderbad
107
Deccan Chronicle
0.8 0.6
(x)
0.4 0.2 (0.0) (0.2) (0.4) (0.6) ICL
ACC
FY09
FY10
Ambuja
FY11E
In our coverage universe, ICL has the highest earnings sensitivity to price changes. Higher cost structure as a result of dependence on imported coal and grid power are the key reasons for higher sensitivity to price movements. We believe that recent price hikes as well as improvement in cost structure with coal mine acquisition and captive power will favorably impact the earnings of the company. Exhibit 11: Most sensitive to price changes (%) 10
8.0
8 4
2.9
3.4
3.8
Franchise
5.1
5.5
5.5
Chennai
91
India Cements
Delhi
84
GMR Holding
Mohali
76
Preity Zinta,Ness Wadia, Mohi Burmanl
Kolkata
75
Shahrukh Khan, Juhi Chawla
Jaipur
67
Emerging Media Group,Raj Mudhra,
With listing of few of IPL teams on cards, we believe market will gradually start factoring IPL valuations in stock price.
Key risks
India Cem
JK Cem
JK Lakshmi
ACC
Ultratech
Ambuja
Shree Cement
Orient paper
143
However, the company management indicated that it does not want to either list or offload any stake in the franchise in the short to medium term. Therefore, we have valued its investment in the franchise at the base IPL bid price of USD225mn. Any upside in this valuation will increase the target price and potential upside accordingly. We have summarized a sensitivity of target price to the various franchise values as in Exhibit no 13.
0
58
Sahara Adventure Sports Group
Slower ramp up of coal mine and CPPs
2
Source: Elara Securities Research
Owner
Source: Elara Securities Research
Highest earnings sensitivity to price changes
2.7
Exhibit 12: Franchise details
Average
FY12E
Source: Company, Elara Securities Estimates
6
We have valued the Chennai Super Kings using the recent IPL auction minimum base price that was fixed at USD225mn. In the recent auction, franchises were sold at average price of USD351.5mn (Kochi and Pune). Considering the actual franchise deals happening in the IPL, ICL has already more than tripled its investments.
Slower ramp up of coal mine and CPP may result in lower than expected savings
Sharp fall in cement prices in South India
Sharp fall in prices in South India, the key market for the company, may adversely impact the earnings of the company
Elara Securities (India) Private Limited
India Cements
Valuation & Recommendation Trades at 44% discount to replacement cost despite its reasonable size, improving fundamentals Valuing cement business at distress EV/tonne of USD62, IPL franchise remains key for upside Initiating coverage with Accumulate rating, target price of INR131
At the CMP of INR 116 per share, the stock is trading at 18.4x and 10.7x its FY11 and FY12 earnings, respectively. It is trading at an EV/tonne of USD62 and USD56 its FY11 and FY12 capacities, respectively. On EV-based multiples (EV/tonne and EV/EBITDA), ICL is available at valuations lower than the last down cycle when it had incurred losses due to higher leverage.
Exhibit 13: SOTP Based valuations (INR mn)
FY12E
USD:INR Exchange Rate
45.0
Capacity
15.6
15.6
15.6
15.6
15.6
62
62
62
62
62
EV /tonne multiple Grey Cement business EV
43,580 43,580 43,580 43,580 43,580
Value of IPL Business USD mn
175
225
275
325
375
In terms of relative valuations, ICL is available at ~62% discount to frontline cement companies. We believe that worst has already been factored in the stock price.
INR mn
7,875 10,125 12,375 14,625 16,875
Total EV
51,455 53,705 55,955 58,205 60,455
Thus, we are initiating coverage on the stock with an Accumulate rating and a price target of INR131 per share.
Less: Net Debt
13,588 13,588 13,588 13,588 13,588
Target Market Capitalization
37,867 40,117 42,367 44,617 46,867
We have valued the company on Sum of Parts Valuation (SOTP) basis. We have valued the cement business of the company at EV/tonne of USD 62, equivalent to distress value for cement plant. We have valued Chennai Super Kings at the recent IPL auction minimum base price that was fixed at USD 225 mn (INR 34 per share).
Diluted Shares outstanding
307
307
307
307
307
Target Price
123
131
138
145
153
Current Market Price
116
116
116
116
116
Potential Upside/(downside)
6.2
12.5
18.8
25.1
31.4
Cement
Valuation
Source: Company, Elara Securities Estimates
Elara Securities (India) Private Limited
59
India Cements
Company Description Established in 1946, India Cements Limited (ICL) is among the largest players in South India with a cement capacity of ~14mn tonnes. The company has seven plants of which four are in Andhra Pradesh and three in Tamil Nadu. India Cements key markets are Andhra Pradesh, Tamil Nadu, Kerala, parts of Karnataka and Maharashtra. ICL has historically been a South-based player. However, going forward, it is in the process of diversifying its presence by venturing into North India. India Cements sells its cement under the brand name of ’Sankar Super Power’, ‘Coromandel Super Power’ and ‘Raasi Super Power’. India Cements had acquired the Chennai franchise in the Indian Premier League (IPL), the 20:20 format tournament started by the Board of Control of Cricket in India (BCCI) for USD91million in January 2008. The investment in IPL was done by the company from the point of view of advertising its brands all across the country.
Board of Directors & Management
60
N Srinivasan, Vice Chairman, Managing Director
Rupa Gurunath, Non-Executive Director
N.Srinivasan is the Vice Chairman and Managing Director of India Cements. Over the last decade and a half, he has been the President of the Cement Manufacturers' Association between 1991 and 2006 and Chairman of the Board of Governors of the National Council for Cement and Building Materials (NCBM) for four terms between 1991 and 2006). He was also the Chairman of Development Council for Cement Industry (DCCI) constituted by the Government of India for two terms (1992-96). During the year 2000-2001, N.Srinivasan was President of the All India Organization of Employers. He was also an active Member of the Prime Minister's High Profile Council of Trade and Industry (1996-2001). He is a post graduate in Chemical Engineering from the Illinois Institute of Technology, US.
Rupa Gurunath serves as Non-Executive Director. She is BSC. and holds a Post Graduate Diploma in Computer Applications.
K Nair, Director Krishna Prasad Nair, a Director, has received his BCom and MBA degrees. He is Chief General Manager and Human Resource head of IDBI Bank Limited. G.Balakrishnan, President, Company Secretary
Compliance
Officer,
G.Balakrishnan, serves as a President, Compliance Officer, Company Secretary of India Cements Limited.
Elara Securities (India) Private Limited
India Cements
Coverage History 250
200
150 1 100
Not Covered
Date 1
Rating
02-Nov-2010 Accumulate
Target Price
Closing Price
INR131
INR116
Covered
Oct-10
Nov-10
Sep-10
Aug-10
Jul-10
Jun-10
May-10
Apr-10
Mar-10
Jan-10
Feb-10
Dec-09
Nov-09
Oct-09
Sep-09
Aug-09
Jul-09
Jun-09
May-09
Apr-09
Mar-09
Feb-09
Jan-09
Dec-08
Nov-08
Oct-08
Sep-08
Aug-08
Jul-08
Jun-08
May-08
Apr-08
0
Cement
50
Guide to Research Rating BUY
Absolute Return >+20%
ACCUMULATE
Absolute Return +5% to +20%
REDUCE
Absolute Return -5% to +5%
SELL
Absolute Return < -5%
61
India Cements
Notes
62
Elara Securities (India) Private Limited
9 November 2010
India | Cement
Company Update/Target price/Rating changed
Regional champ at reasonable value
Rating : Accumulate
Foray into merchant power to stabilize cyclical cement earnings
Target Price : INR2,501 Upside : 16% CMP : INR2,165 ( As on 2 November 2010)
Shree Cement Limited (SCL) has ventured into the profitable merchant power business. It has a CPP capacity of 265MW which is expected to increase to 565MW by the end of Q3FY12. The company expects to sell the excess power in the open market on merchant rates. On account of the increase in the CPP capacity, we expect the EBITDA from power business to increase from INR1.3bn in FY10 to INR4.4bn in FY12. The share of the power EBITDA in the total EBITDA is expected to increase from 8% in FY10 to ~30% in FY12. Apart from providing earnings growth, we believe the merchant power business will provide stability to the cyclical cement business cash flows.
Key data* Bloomberg /Reuters Code Current /Dil. Shares O/S (mn) Mkt Cap (INRbn/USDmn) Daily Vol. (3M NSE Avg.) Face Value (INR)
SRCM IN/SHCM.BO 35/35 75/1,698 25,509 10
1 USD= INR44.4 Source: Bloomberg ; * As on 2 November 2010
Price & Volume
Capacity addition to push up volume to CAGR of~ 5%
300
2,450
SCL is in the process of increasing its clinker and grinding capacity by 1mn tonne and 1.5mn tonnes respectively. The expansion is expected to be complete by the end of FY11. The capacity addition is likely to provide volume growth from FY12 for the cement business of the company. Due to the capacity addition, we expect cement volumes to increase at a CAGR of ~5% between FY10 to FY12.
2,200 200
1,950 1,700
100
1,450 0
1,200 Oct-09 Mar-10 Vol. in '000s (RHS)
Lowest cost producer, highest margin earner in North Despite its dependence on pet coke, SCL enjoys a cost advantage over peers due to its efficient operations and captive power unit. In Q1FY11, it had cost of INR2,323/tonne as compared to INR2,712/tonne for other North Indian cement players. Due to lower production cost, SCL enjoys the highest margins in the Northern region. The cement division of SCL had earned EBITDA margins of 31% as compared to ~17% of other cement players.
Jul-10 Nov-10 Shree Cement (LHS)
Source: Bloomberg
Share holding (%)
Q3FY10 Q4FY10 Q1FY11 Q2FY11
Promoter
65.6
65.6
65.5
64.8
Institutional Investors
15.1
13.7
13.3
12.8
Other Investors
14.7
16.1
16.5
18.3
General Public
4.7
4.6
4.6
4.1
Source: BSE
Price performance (%)
Strong cash flows to further fortify balance sheet At the end of FY10, the company had a net debt equity ratio of 0.05x and gross cash and investments of INR20 bn. We expect the company to generate free cash flow to firm of INR 36.8bn over next two years.
Valuation
3M
6M
12M
Sensex
12.3
17.0
32.1
Shree Cement
20.1
0.8
40.4
Ultratech
30.1
17.5
51.5
ACC
28.0
17.5
51.9
Source: Bloomberg
At the CMP of INR 2,165 per share, Shree Cement is trading at 19.2x and 12.6x its FY11 and FY12 earnings, respectively. On an EV/tonne basis, it is trading at USD98/tonne and USD82/tonne of its FY11 and FY12E capacities, respectively. Despite having a low cost structure, diversified revenue stream and a healthy balance sheet, the stock is trading at ~44% discount to frontline cement companies. Thus, we have assigned Accumulate rating on the stock with revised target price of INR 2,501 per share. We have valued cement business of the company at USD100/tonne (equivalent to replacement cost) and power division on DCF basis.
Stock performance 160 Rebased to100
Global Markets Research
Shree Cement
140 120 100 80 Nov-09
Feb-10
May-10
Sree Cement
Aug-10
Nov-10
Sensex
Source: Bloomberg
Key Financials Y/E Mar (INR mn) FY08 FY09 FY10 FY11E FY12E
Rev
YoY (%)
EBITDA
EBITDA (%)
Adj PAT
20,659 27,150 36,321 42,630 51,876
51.0 31.4 33.8 17.4 21.7
8,624 9,508 15,117 11,750 14,249
41.7 35.0 41.6 27.6 27.5
2,604 5,780 7,483 3,918 5,962
YoY (%) Fully DEPS 47.1 122.0 29.5 (47.7) 52.2
74.7 165.9 214.8 112.5 171.1
RoE (%) 46.2 61.4 49.2 19.4 24.1
P/E (x) EV/tonne (USD) EV/EBITDA (x) 29.0 13.0 10.1 19.2 12.6
190 189 130 98 82
9.1 8.1 5.1 6.6 4.8
Source: Company, Elara Securities Estimates
Ravindra Deshpande • [email protected] • +91 22 4062 6805 Ravi Sodah • [email protected] • +91 22 4062 6817 Elara Securities (India) Private Limited
Shree Cement Valuation trigger
Power expansion to accelerate volume growth
Completion of expansion project to drive cement volume growth
2,700 2
1
2,200
3
Investment summary
Low cost structure to insulate the company from losses in the downturn.
Healthy balance sheet and investment book
1,700 Target price reached
1,200
Valuation trigger 1. Completion of expansion project to drive cement volume growth
700
Oct-11
Jun-11
Aug-11
Apr-11
Feb-11
Oct-10
Dec-10
Jun-10
Aug-10
Apr-10
Feb-10
Oct-09
Dec-09
Jun-09
Aug-09
Apr-09
Feb-09
Oct-08
Dec-08
Jun-08
Aug-08
Apr-08
200
2. Power expansion to accelerate volume growth
Key risks
Source: Bloomberg, Elara Securities Estimates
Valuation overview - Sum of Parts Valuation Grey Cement
FY12E
Sharp decline in cement prices
Slow down in cement demand
Capacity
mn tonnes
13.6
EV /tonne multiple
USD/tonne
100
Our assumptions
Grey Cement business EV
INR mn
61,200
DCF value
INR mn
18,413.7
Total EV
INR mn
79,614
Less: Net Debt
INR mn
(7,522)
Target Market Capitalization
INR mn
87,136
Diluted Shares outstanding
mn
Target Price
INR/ share
2,501
Current Market Price
INR/ share
2,165
Potential Upside/(downside)
(%)
Cement volume to grow at a CAGR of ~5%
Cement realizations to increase at a CAGR of 3.3%.
Value of power business
34.8
15.5
Source: Company, Elara Securities Estimates
Valuation driver - EV/tonne , RoE and RoCE 300
70
250
60
30
100
20
EV/Tonne(USD)
RoE(RHS)
FY12E
FY11E
FY10E
FY09
FY08
FY07
FY06
FY05
FY04
0 FY03
0 FY02
10
FY01
50
FY00
(EV/tonne)
40
150
(%)
50
200
RoCE (RHS)
Source: Elara Securities Estimates
64
Elara Securities (India) Private Limited
Shree Cement
Financials (Y/E Mar) 9,508
15,117
11,750
14,249
829
1,284
1,469
2,092
10,337
16,400
13,218
16,341
Add:- Non operating Income OPBIDTA Less :- Depreciation & Amortization
2,363
5,902
6,509
7,000
EBIT
7,973
10,498
6,718
9,341
744
950
1,813
1,889
7,229
9,548
4,906
7,452
Less:- Interest Expenses PBT Less :- Taxes
1,449
2,066
979
1,490
Adjusted PAT
5,780
7,483
3,918
5,962
-
(722)
-
-
Reported PAT
5,780
6,761
3,926
5,962
Balance Sheet (INR mn)
FY09
FY10
FY11E
FY12E
348
348
348
348
Add/Less: - Extra-ordinaries
Share Capital Reserves
11,752
17,984
21,631
27,180
Borrowings
14,962
21,062
20,492
18,562
Total Liabilities
27,062
39,395
42,471
46,090
Gross Block
22,559
29,509
36,139
52,939
Less:- Accumulated Depreciation
16,291
21,989
28,489
35,489
Net Block
6,269
7,520
7,650
17,450
Add:- Capital work in progress
4,789
9,674
12,790
-
Investments
8,448
15,922
15,922
15,922
Net Working Capital
7,452
6,155
5,985
12,594
Deferred Tax Assets
104
124
124
124
27,062
39,395
42,471
46,090
FY09
FY10
FY11E
FY12E
7,801
12,601
10,762
12,758
219
(61)
(1,332)
890
8,020
12,540
9,430
13,649
(5,330)
(11,710)
(9,746)
(4,010)
Total Assets Cash Flow Statement (INR mn) Cash profit adjusted for non cash items Add/Less : Working Capital Changes Operating Cash Flow Less:- Capex Free Cash Flow
2,690
830
(316)
9,639
573
3,786
(2,654)
(4,232)
(3,215)
(5,174)
1,469
2,092
Financing Cash Flow Investing Cash Flow Net change in Cash Ratio Analysis
48
(559)
(1,501)
7,499
FY09
FY10
FY11E
FY12E
31.4
33.8
17.4
21.7
Revenue & margins growth trend 60,000
EBITDA Growth
10.2
59.0
(22.3)
21.3
29.5
(47.7)
52.2
EBITDA Margin
35.0
41.6
27.6
27.5
Net Margin
21.3
20.6
9.2
11.5
27.5
30 20
20,000 0
0
FY09 FY10 Net Revenues (LHS)
FY11E FY12E EBITDA Margin (RHS)
Source: Company, Elara Securities Estimate
Adjusted profits growth trend 8,000
122.0
150
6,000
100
52.2
29.5
50
4,000
0
(47.7)
2,000
(50) (100)
0 FY09 FY10 Adjusted PAT (LHS)
FY11E
FY12E PAT Growth (RHS)
Source: Company, Elara Securities Estimate
Return ratios (%) 70 60 50 40 30 20 10 0
61.4 49.2
35.2
19.4
24.1
32.2 16.4
FY09
122.0
PAT Growth
40 27.6
40,000
10
Income Statement Ratios (%) Revenue Growth
50
41.6 35.0
Cement
FY12E 51,876
(%)
FY11E 42,630
(%)
FY10 36,321
(INR mn)
EBITDA
FY09 27,150
(INR mn)
Net Revenues
(%)
Income Statement (INR mn)
FY10 ROE
FY11E
21.1 FY12E
ROCE
Source: Company, Elara Securities Estimate
Return & Liquidity Ratios Net Debt/Equity (x)
0.1
0.1
0.1
(0.3)
ROE (%)
61.4
49.2
19.4
24.1
ROCE (%)
35.2
32.2
16.4
21.1
Diluted EPS (INR/Share)
165.9
214.8
112.5
171.1
EPS Growth (%)
122.0
29.5
(47.7)
52.2
DPS (INR/Share)
10.0
12.6
7.3
11.1
P/E Ratio (x)
13.0
10.1
19.2
12.6
EV/EBITDA (x)
8.1
5.1
6.6
4.8
EV/Sales (x)
2.8
2.1
1.8
1.3
189
130
98
82
0.5
0.6
0.3
0.5
Revenue to grow at a CAGR of 19.5% on the back of higher power and cement volumes
Per Share data & Valuation Ratios
EV/tonne (USD) Dividend Yield (%)
Trading at a discount to its replacement cost despite strong return ratios
Source: Company, Elara Securities Estimate
Elara Securities (India) Private Limited
65
Shree Cement Shree Cement
Valuation & Recommendation Trades at 18% discount to its replacement cost despite a healthy balance sheet, return ratios Valuing cement business at EV/tonne of USD100, factoring in superior fundamentals Reiterating our Accumulate rating, upgrading target price to INR2,501 At the CMP of INR 2,165 per share, the stock is trading at 19.2x and 12.6x its FY11 and FY12 earnings, respectively. It is trading at an EV/tonne of USD 98 and USD 82 its FY11 and FY12 capacities, respectively. Despite having impressive return ratios & margins, low earning risk, SCL is trading at a discount to its peers and replacement cost. Thus, we have assigned Accumulate rating and target price of INR 2,501. We have arrived at a target price for the company on SOTP basis. We have valued cement business of the company on EV/tonne basis. We have assigned EV/tonne of USD100 for FY12 year end capacity of the company. We have valued merchant power business of the company of DCF basis.
Exhibit 1: Sum of Parts Valuation Grey Cement
FY12E
Capacity
mn tonnes
13.6
EV /tonne multiple
USD/tonne
100
Grey Cement business EV
INR mn
61,200
INR mn
18,413.7
Value of power business DCF value Total EV
INR mn
79,614
Less: Net Debt
INR mn
(7,522)
Target Market Capitalization
INR mn
87,136
Diluted Shares outstanding
mn
Target Price
INR/ share
2,501
Current Market Price
INR/ share
2,165
Potential Upside/(downside)
(%)
34.8
15.5
Source: Company, Elara Securities Estimates
66
Elara Securities (India) Private Limited
Shree Cement
Company Description Shree Cement Limited is one of the largest cement manufacturer in North India and among the top five cement manufacturing company in the country. At the end of FY10, the company has total cement capacity of 12.6 mn tonnes and its cement manufacturing operations is spread across northern region. The company also had power capacity of 215 MW. The company is also one of the most profitable cement players in the industry at the operating level.
Board of Directors & Management B. G. Bangur, Executive Chairman B.G. Bangur is Executive Chairman of the Board of SCL. He holds a Bachelors of Commerce (Hons.) from Calcutta University. He is also the director in The Didwana Industrial Corporation Limited, NBI Industrial Finance Company Limited, Shree Capital Services Limited, Khemka Properties Private Limited and Digvijay Finlease Limited. He is actively associated with various Philanthropic and Charitable Institutions and trusts. Prashant Bangur, Executive Joint President Prashant Bangur, Executive Joint President is the Executive Joint President of SCL. He has done his MBA in Finance and Logistic from Indian School of Business. Ashok Bhandari, CFO & Joint President Ashok Bhandari is the Chief Financial Officer and Joint President of SCL. H. Bangur, Managing Director H. M. Bangur is Managing Director of SCL. He is a Chemical Engineer from IIT, Mumbai and he brings to
Elara Securities (India) Private Limited
the board technical insights which are a driving force of the technical excellence achieved by the Company. Bangur is also a Director in the Kamla Company Limited. He was the President of Cement Manufacturers' Association (CMA), the prime body for co-ordination, policy making and co-operation of the cement industry in India.
Cement
Shree Cement sells its products across Rajasthan, Uttar Pradesh, Uttarakhand, Delhi, Haryana and Punjab. The cement is marketed under the three brand names, Shree Ultra Jung Rodhak Cement, Bangur Cement and Tuff Cement.
M. K. Singhi, Executive Director M. K. Singhi is an Executive Director of SCL. He is a fellow Chartered Accountant and a Science and Law Graduate. He joined the Company as President in January 1995 and has 31 years experience of working at senior positions. He is the leader of Indian Cement Sector Task Force for Energy Conservation, appointed by Bureau of Energy Efficiency, Ministry of Power, Government of India. He is a member of Cement Sustainability Initiative (CSI) of World Business Council for Sustainable Development. He is also a member of Cement Task Force of Asia Pacific Partnership on Clean Development and Climate. He is the President of Rajasthan Cement Manufacturers Association. He is also on the Board of Shree Cement Marketing Limited.
67
Shree Cement
Coverage History 2,500
1
4 3
2,000 2 1,500
1,000
500
Not Covered
Date
Rating
Target Price
Closing Price
1
29-Apr-2010 Accumulate
INR2,432
INR2,240
2
21-May-2010 Accumulate
INR2,335
INR1,997
3
16-Aug-2010 Buy
INR2,300
INR1,809
4
02-Nov-2010 Accumulate
INR2,501
INR2,165
Oct-10
Nov-10
Sep-10
Aug-10
Jul-10
Jun-10
May-10
Apr-10
Mar-10
Jan-10
Feb-10
Dec-09
Nov-09
Oct-09
Sep-09
Aug-09
Jul-09
Jun-09
May-09
Apr-09
Mar-09
Feb-09
Jan-09
Dec-08
Nov-08
Oct-08
Sep-08
Aug-08
Jul-08
Jun-08
May-08
Apr-08
0
Covered
Guide to Research Rating
68
BUY
Absolute Return >+20%
ACCUMULATE
Absolute Return +5% to +20%
REDUCE
Absolute Return -5% to +5%
SELL
Absolute Return < -5%
Elara Securities (India) Private Limited
9 November 2010
India | Cement
Company Update
Grey eminence
Rating : Buy
Grey cement capacity up 67%, to prop up earnings
Target Price : INR220 Upside : 31% CMP : INR168 ( As on 2 November 2010)
JK Cement Limited (JKCEM) has increased its grey cement capacity by 67% from 4.5mn tonnes to 7.5mntonnes, through a greenfield expansion in Karnataka. The capacity expansion is likely to spur the volume growth in FY11 as well as in FY12. On account of the capacity addition, we expect JKCEM’s grey cement volume to go up at a CAGR of 16.8%, cushioning earnings of the company from a decline in margins.
Key data* Bloomberg /Reuters Code Current /Dil. Shares O/S (mn) Mkt Cap (INRbn/US$mn) Daily Vol. (3M NSE Avg.) Face Value (INR)
White cement to provide stable cash flow
JKCE IN/JKCE.BO 70/70 12/264 107,900 10
1 US$= INR44.4
JKCEM has a capacity of 0.4mn tonnes in the white cement segment, characterized by the presence of just two players and a relatively steady demand (with higher realizations and margins). White cement realizations are ~4.6x higher than grey cement (INR13,301/tonne as compared to INR 2,873 tonne for grey). In Q2FY11 while white cement earned an EBITDA/tonne of INR 2,494, grey cement earned a negative EBITDA/tonne of INR 112. Thus we believe the white cement business will continue to provide the company stable cash flows to comfortably service its interest expenses.
Source: Bloomberg ; * As on 2 November 2010
Price & Volume 200
4
180
3
160
2
140
1
120 100
0
Oct-09 Mar-10 Vol. in mn (RHS)
Plans to hike capacity in North India by 2.5mn tonnes JKCEM is planning to increase its cement capacity in North region by way of a brownfield expansion. The expansion is likely to be complete by end of Q2FY13 post which, the total grey cement capacity in the North would touch 7mn tonnes while the overall capacity, 10mn tonnes. The capacity expansions will provide the company with a sustained volume growth in the coming years.
Jul-10 Nov-10 JK Cement (LHS)
Source: Bloomberg
Share holding (%)
Q3FY10 Q4FY10 Q1FY11 Q2FY11
Promoter
65.3
65.3
65.3
65.3
Institutional Investors
20.0
18.9
19.7
20.0
Other Investors
3.8
4.2
3.8
4.2
General Public
10.9
11.6
11.2
10.5
12M
Source: BSE
Karnataka plant to reduce regional risk
Price performance (%)
JKCEM had a restrictive presence only in the Northern region prior to commissioning of the Karnataka plant which has slashed the regional risk. The company will become partly insulated from the slowdown in demand in Northern region post the Common Wealth Games.
3M
6M
12.3
17.0
32.1
5.9
(10.0)
37.4
Ultratech
30.1
17.5
51.5
ACC
28.0
17.5
51.9
Sensex JK Cement
Valuation
Source: Bloomberg
At the CMP of INR 168 per share, the stock is trading at 16.1x and 8.9x its FY11 and FY12 earnings, respectively. It is trading at EV/tonne of USD54 and USD51 of its FY11 and FY12 capacities, respectively. Considering the volume growth from the greenfield plant, stable cash flow from white cement business and a steep discount at which the stock is trading to its replacement cost we are reiterating a Buy rating on the stock with priced target of INR 220/share.
Stock performance 180 Rebased to100
Global Markets Research
JK Cement
160 140 120 100 80 Nov-09
Feb-10
May-10
JK Cement
Aug-10
Nov-10
Sensex
Source: Bloomberg
Key Financials Y/E Mar (INR mn) FY08 FY09 FY10 FY11E FY12E
Rev 14,583 14,968 18,268 21,308 25,214
YoY (%) 18.2 2.6 22.0 16.6 18.3
EBITDA 4,157 3,240 4,391 2,881 3,525
EBITDA (%) 28.5 21.6 24.0 13.5 14.0
Adj PAT 2,652 1,423 2,260 726 1,319
YoY (%) Fully DEPS 48.5 37.9 (46.3) 20.4 58.8 32.3 (67.9) 10.4 81.6 18.9
RoE (%) 41.5 17.0 22.6 6.5 10.8
P/E (x) EV/tonne (USD) EV/EBITDA (x) 4.4 81 3.5 8.2 96 6.4 5.2 65 4.3 16.1 54 6.7 8.9 51 5.2
Source: Company, Elara Securities Estimate
Ravindra Deshpande • [email protected] • +91 22 4062 6805 Ravi Sodah • [email protected] • +91 22 4062 6817 Elara Securities (India) Private Limited
JK Cement Valuation trigger
Financial closure of new projects
Investment summary
Robust volume growth to cushion the earnings of the company
White cement business to provide stable cash flow
Ramping up of Karnataka plant.
250 3
2
200
1
150
Valuation trigger Target price reached
100
1. Ramping up of Karnataka plant. 2. Financial closure of new projects
50
Oct-11
Jun-11
Aug-11
Apr-11
Feb-11
Oct-10
Dec-10
Jun-10
Aug-10
Apr-10
Feb-10
Oct-09
Dec-09
Jun-09
Aug-09
Apr-09
Feb-09
Oct-08
Dec-08
Jun-08
Aug-08
Apr-08
0
Source: Bloomberg, Elara Securities Estimates
Valuation overview - EV/tonne based valuations Grey Cement mn tonnes
EV /tonne multiple
USD/tonne
Grey Cement business EV
INR Mn
Key risks
Slower ramp up of Karnataka plant
Sharp decline in cement prices
FY12E
Capacity
Our assumptions
Grey cement volumes to grow at CAGR of ~16.8%
White cement volumes to grow at CAGR of 15%
7.5 62 20,847
White Cement Capacity
mn tonnes
0.4
EV /tonne multiple
USD/tonne
125.0
White Cement business EV
INR Mn
2,250
EV
INR mn
23,097
Less: Net Debt
INR mn
7,695
Target Market Capitalization
INR mn
15,401
Diluted Shares outstanding
mn
70
Target Price
INR/ share
220
Current Market Price
INR/ share
168
Potential Upside/(downside)
(%)
31.4
Source: Company, Elara Securities Estimates
Valuation driver: EV/tonne , RoE and RoCE 45
100
35 %
EV/tonne
120
80 25 60 15
40 20
EV/Tonne in USD(LHS)
RoE(RHS)
FY12E
FY11E
FY10E
FY09
FY08
FY07
FY06
5
ROCE (RHS)
Source: Elara Securities Research
70
Elara Securities (India) Private Limited
JK Cement
Financials (Y/E Mar)
Cash Flow Statement (INR mn) Cash profit adjusted for non cash items Add/Less : Working Capital Changes Operating Cash Flow Less:- Capex Free Cash Flow Financing Cash Flow Investing Cash Flow Cash Balance transferred from Jaycem Net change in Cash Ratio Analysis Income Statement Ratios (%) Revenue Growth EBITDA Growth PAT Growth EBITDA Margin Net Margin Return & Liquidity Ratios Net Debt/Equity (x) ROE (%) ROCE (%) Per Share data & Valuation Ratios Diluted EPS (INR/Share) EPS Growth (%) DPS (INR/Share) P/E Ratio (x) EV/EBITDA (x)* EV/Sales (x)* EV/Tonne (USD)* Dividend Yield (%)
FY12E 25,214 3,525 273 3,797 1,160 2,637 697 1,940 621 1,319 1,319
FY09
FY10
FY11E
FY12E
699 11,161 5,644 17,505 14,411 2,254 12,158 351 107 5,871 24 (1,006) 17,505
699 12,838 10,737 24,275 23,767 3,245 20,522 2,253 60 3,271 27 (1,858) 24,275
699 13,569 9,887 24,156 26,267 4,344 21,923 1,000 60 3,004 27 (1,858) 24,156
699 14,807 8,387 23,893 27,767 5,504 22,263 1,100 60 2,302 27 (1,858) 23,893
FY09
FY10
FY11E
FY12E
2,506 (93) 2,412 (916) 1,496 (1,793) 92
2,687 240 2,927 (1,247) 1,680 (1,707) -
3,095 63 3,158 (1,600) 1,558 (2,197) -
(204)
3,400 (820) 2,580 (1,989) 591 (796) 65 204 65
(26)
(639)
FY09
FY10
FY11E
FY12E
2.6 (22.1) (46.3) 21.6 9.5
22.0 35.5 58.8 24.0 12.4
16.6 (34.4) (67.9) 13.5 3.4
18.3 22.3 81.6 14.0 5.2
0.5 17.0 16.9
0.9 22.6 17.9
0.7 6.5 8.1
0.6 10.8 11.0
20.4 (46.3) 3.5 8.2 6.4 1.4 95.6 2.1
32.3 58.8 6.0 5.2 4.3 1.0 64.7 3.6
10.4 (67.9) 1.0 16.1 6.7 0.9 53.6 0.6
18.9 81.6 1.0 8.9 5.2 0.7 51.1 0.6
Revenue & margins growth trend 30,000
30
24.0
21.6 20,000
14.0
13.5
10,000
20 (%)
FY11E 21,308 2,881 180 3,061 1,099 1,962 857 1,106 379 726 87 813
10 0
0 FY09
FY10
Net Revenues (LHS)
FY11E
FY12E
EBITDA Margin (RHS)
Source: Company, Elara Securities Estimate
Adjusted profits growth trend 81.6
2,500
58.8
2,000
50
1,500 1,000
100
0
(46.3)
(67.9)
500
Cement
Share Capital Reserves Borrowings Total Liabilities Gross Block Less:- Accumulated Depreciation Net Block Add:- Capital work in progress Investments Net Working Capital Miscellaneous Expenses not written off Net Deferred Tax Total Assets
FY10 18,268 4,391 193 4,584 855 3,729 616 3,113 853 2,260 2,260
(%)
Balance Sheet (INR mn)
FY09 14,968 3,240 79 3,319 524 2,795 455 2,340 916 1,423 1,423
(INR mn)
Net Revenues EBITDA Add:- Non operating Income OPBIDTA Less :- Depreciation & Amortization EBIT Less:- Interest Expenses PBT Less :- Taxes Adjusted PAT Add/Less: - Extra-ordinaries Reported PAT
(INR mn)
Income Statement (INR mn)
(50)
0
(100) FY09
FY10
Adjusted PAT (LHS)
FY11E
FY12E
PAT Growth (RHS)
Source: Company, Elara Securities Estimate
Return ratios (%) 22.6
25 20 15
17.0 16.9
11.0
17.9
10
8.1
5
6.5
10.8
0 FY09
FY10 ROE
FY11E ROCE
FY12E
Source: Company, Elara Securities Estimate
Revenues to grow at a CAGR of 17% on the back of strong volume
Debt equity to remain comfortable despite capacity additions
*JKCEM had set up a green field plant in a subsidiary which was merged with parent in FY10. For comparison purpose EV based ratios are taken on consolidated basis for FY09 Source: Company, Elara Securities Estimate
Elara Securities (India) Private Limited
71
JK Cement JK Cement
Valuation & Recommendation Trades at 49% discount to its replacement cost, market overlooks stable white cement business Valuing grey cement at distress EV/tonne of USD62,white cement at conservative USD185 Restating our Buy rating, target price unchanged at INR220
Valuation
Exhibit 1: EV/tonne based valuations
At the CMP of INR 168 per share, the stock is trading at 16.1x and 8.9x its FY11 and FY12 earnings, respectively. It is trading at EV/tonne of USD54 and USD51 of its FY11 and FY12 capacities, respectively. Despite stable cash flow in the white cement business and robust volume growth in grey cement the stock is trading at sharp discount to its replacement cost. Thus we are reiterating our Buy rating on the stock with unchanged target price of INR 220 per share
Grey Cement
We have valued the company on SOTP basis. We have valued the grey cement business of the company at EV/tonne of USD 62 (equivalent to distress case value) and white cement business at EV/tonne of USD 185. We have assigned higher valuations to white cement business due to the fact that profitability (3.9x of grey cement in Q1FY11) and replacement cost (3x of grey cement) for white cement plant is much higher than grey cement.
Less: Net Debt
INR mn
7,695
Target Market Capitalization
INR mn
15,401
Diluted Shares outstanding
mn
FY12E Capacity
mn tonnes
EV /tonne multiple
USD/tonne
Grey Cement business EV
INR Mn
7.5 62 20,847
White Cement Capacity
mn tonnes
0.4
EV /tonne multiple
USD/tonne
125.0
White Cement business EV
INR Mn
2,250
EV
INR mn
23,097
70
Target Price
INR/ share
220
Current Market Price
INR/ share
168
Potential Upside/(downside)
(%)
31.4
Source: Company, Elara Securities Estimates
72
Elara Securities (India) Private Limited
JK Cement
Company Description
Board of Directors& Management Gaur Hari Singhania, Chairman Dr. Singhania, our Chairman, holds a Master of Arts degree in Economics and a PhD degree in Economics from Agra University. He has corporate experience spanning 50 years. He has been associated with the Company as its Promoter Director and has led our Company since its inception in 1994. He is also the Chairman of JKSL, Juggilal Kamlapat Cotton Spg. & Wvg. Mills Company Limited and J.K. Traders Limited. He has held the position of Chairman of the Merchant Chambers of Uttar Pradesh and Employers Association of Northern India. He has also been the president of Uttar Pradesh Stock Exchange Association Limited. He has been a director of Pradeshiya Industrial Investment Corporation of Uttar Pradesh, UttarPradesh State Industrial Development Corporation and the Uttar Pradesh State Sugar Corporation. Currently, he is also the Chancellor of Dayanand Shiksha Sansthan and the President of Kanpur Education Society.
Elara Securities (India) Private Limited
Yadupati Singhania, Managing Director and Chief Executive Officer Singhania, Managing Director and Chief Executive Officer, holds a Bachelor of Technology (B.Tech.) degree from Indian Institute of Technology, Kanpur. He has experience spanning 25 years in the cement industry. He has been associated with the Company as its Promoter Director and has led our Company since its inception in 1994. He was appointed Managing Director of the Company with effect from April 1, 2004. He was instrumental in setting up the JKSL Cement Division.
Cement
JK Cement Limited, a part of the JK group, was incorporated by acquiring the cement division assets of JK Synthetics in November 2004. It is an affiliate of the J.K. Organization, which was founded by Lala Kamlapat Singhania in the year 1994. Currently, JK Cement has grey cement capacity of 7.5 mn tonnes(in the state of Rajasthan and Karnataka) and white cement capacity of 0.4 mn tones (in the state of Rajasthan). The company is the second largest manufacturer of white cement in India. JK Cement sells cement under brand names Sarvashaktiman (43 grade OPC), JK Super (Blended cement) JK White Cement and JK Wall Putty. During FY10, the company had reported revenue of INR 18,268mn million (20% from white cement and 80% from grey cement) and a net profit of INR 2,260 mn million.
He is the Director of the Employers Association of Northern India, President of Kanpur Productivity Council, and member of the Board of Governors of the National Council for Cement and Building Material and Jodhpur Chamber of Commerce. He is also a member of the managing committee of Cement Manufacturers Association. He has held the position of District Governor of Rotary International and President of Foreign Trade Development (India) Association.
73
JK Cement
Coverage History
1
2
Jun-10
200
May-10
250
150
100
50
Not Covered
Date
Rating
Target Price
Closing Price
1
29-Apr-2010 Buy
INR245
INR185
2
1-Jun-2010
INR220
INR182
Buy
Oct-10
Nov-10
Sep-10
Aug-10
Jul-10
Apr-10
Mar-10
Jan-10
Feb-10
Dec-09
Nov-09
Oct-09
Sep-09
Aug-09
Jul-09
Jun-09
May-09
Apr-09
Mar-09
Feb-09
Jan-09
Dec-08
Nov-08
Oct-08
Sep-08
Aug-08
Jul-08
Jun-08
May-08
Apr-08
0
Covered
Guide to Research Rating BUY
Absolute Return >+20%
ACCUMULATE
Absolute Return +5% to +20%
REDUCE
Absolute Return -5% to +5%
SELL
Absolute Return < -5%
74
Elara Securities (India) Private Limited
9 November 2010
India | Cement
Company Update/Target price changed
Lord of low cost, master in a downturn
Rating : Buy
Brownfield expansion to steer volume growth
Target Price : INR87 Upside : 42% CMP : INR61(* As on 2 November 2010)
Orient Paper & Industries Limited (OPI) has increased its cement capacity from 3.4mn tonnes at the end of FY09 to 5mn tonnes at the end of FY10. On account of capacity additions, OPI has been growing 7.5x faster than the industry. Till August 2010, it has reported a dispatch growth of 40% compared to 4.7% for the industry. On the back of the strong volume growth, we expect EBITDA of the cement division to grow YoY by 20% in FY11 despite low cement prices. Low cost structure to guard earnings in downturn
Key data* Bloomberg /Reuters Code Current /Dil. Shares O/S (mn) Mkt Cap (INRbn/USDmn) Daily Vol. (3M NSE Avg.) Face Value (INR)
OPI IN/ORPP.BO 193/193 12/265 299,832 1
1 USD= INR44.4
OPI is the lowest cost producer (40% lower than industry average) of cement in India due to its efficient plants and logistical advantages. OPI is able to obtain all raw materials within a radius of 70 kms from its plant. The average lead distance to market for OPI is only 350 km as compared to 600 km for its peers. Furthermore, OPI is 100% dependent (out of which 75% is linkage coal) on domestic coal, prices of which are less volatile as compared to imported coal and petcoke. Domestic coal (post adjusted for differences in calorific value of coal) is cheaper than imported coal and petcoke by ~17% and ~13% respectively. We believe that low cost structure will guard earnings of the company in the downturn.
Source: Bloomberg ; * As on 2 November 2010
Price & Volume 70
8 6
60
4 50
2
40
0
Oct-09 Mar-10 Vol. in mn (RHS)
Jul-10 Nov-10 Orient Paper (LHS)
Source: Bloomberg
Investment accounts for 11% of market cap OPI holds 1.55 mn shares of Century Textiles and 0.9 mn shares of Hyderabad Industries. The market value of the company’s investment is approximately INR1.4bn (i.e 11% of MCAP). Apart from this, OPI has a paper plant at Brajrajnagar in Orissa where operations remain suspended since 1999. OPI currently has around 850 acres of land in this unit along with fully developed townships, educational institutions and recreational centers.
Valuation
Share holding (%)
Q3FY10 Q4FY10 Q1FY11 Q2FY11
Promoter
33.9
33.5
33.7
33.6
Institutional Investors
31.8
33.0
34.2
34.8
Other Investors
15.7
15.6
15.4
17.7
General Public
18.6
17.9
16.7
14.0
Source: BSE
Price performance (%)
3M
6M
12M
Sensex
12.3
17.0
32.1
Orient Paper
12.9
3.8
42.0
Ultratech
30.1
17.5
51.5
ACC
28.0
17.5
51.9
Source: Bloomberg
Despite having strong return ratios and margins, OPI is trading at a steep discount to its frontline cement companies and the replacement cost. At the CMP of INR 61 per share, the stock is trading at 6x and 5.8x its FY11 and FY12 earnings, respectively. It is trading at an implied EV/tonne of USD 50 and USD 40 its FY11 and FY12 capacities, respectively. We are reiterating a BUY rating on the stock with a revised priced target of INR 87/share. We have valued the company on SOTP basis and the company’s paper and fan division at EV/EBITDA multiple of 1.5X and 3x respectively. We have valued the cement division at an EV/tonne of USD62/tonne which we believe should be the fair value of the cement company in the down cycle.
Stock performance 160 Rebased to 100
Global Markets Research
Orient Paper
140 120 100 80 Nov-09
Feb-10
May-10
Orient Paper
Aug-10
Nov-10
Sensex
Source: Bloomberg
Key Financials
Y/E Mar (INR mn) Rev YoY (%) EBITDA FY08 12,958 17.6 3,488 FY09 15,032 16.0 3,913 FY10E 16,198 7.8 3,074 FY11E 19,130 18.1 3,886 FY12E 21,935 14.7 3,786 Source: Company, Elara Securities Estimates
EBITDA (%) 26.9 26.0 19.0 20.3 17.3
Adj PAT 2,099 2,315 1,593 1,981 2,030
YoY (%) Fully DEPS 51.3 10.9 10.3 12.0 (31.2) 8.3 24.3 10.3 2.5 10.5
RoE (%) 66.9 41.3 22.6 23.2 19.7
P/E (x) EV/tonne (USD) EV/EBITDA (x) 5.6 75 3.8 5.1 96 4.1 7.4 68 5.4 6.0 50 3.4 5.8 40 2.9
Ravindra Deshpande • [email protected] • +91 22 4062 6805 Ravi Sodah • [email protected] • +91 22 4062 6817 Elara Securities (India) Private Limited
Orient Paper Valuation trigger
Turnaround in paper division
Volume growth in cement division due to completion of brownfield expansion
100 90
Investment summary
Low cost structure to insulate the company from losses in downturn.
Healthy book
3
80
balance
sheet,
investment
2 1
70
60
Valuation trigger
50 Target price reached
40
1. Volume growth in cement division due to completion of brownfield expansion
30 20 10
2. Turnaround in paper division Oct-11
Jun-11
Aug-11
Apr-11
Feb-11
Oct-10
Dec-10
Jun-10
Aug-10
Apr-10
Feb-10
Oct-09
Dec-09
Jun-09
Aug-09
Apr-09
Feb-09
Oct-08
Dec-08
Jun-08
Aug-08
Apr-08
0
Source: Bloomberg, Elara Securities Estimates
Valuation overview - Sum of Parts Valuation FY12E Grey Cement Capacity
mn tonnes
5.0
EV /tonne multiple
USD/tonne
62
Grey Cement business EV
INR Mn
14,062
INR mn
253.6
Paper EBITDA EV /EBITDA
x
Paper business EV
INR mn
380
EBITDA
INR mn
523
EV /EBITDA
x
Fan business EV
INR mn
1,568
Total EV
INR mn
16,011
Less: Net Debt
INR mn
(691)
Target Market Capitalization
INR mn
16,702
Diluted Shares outstanding
mn
Key risks
Sharp decline in cement prices
Slow down in cement demand
Our assumptions
Cement Volume to grow at a CAGR of ~13%
Realizations to increase at a CAGR of 0.5%.
1.5
Fan 3.0
193
Target Price
INR/ share
Current Market Price
INR/ share
Potential Upside/(downside)
(%)
87 61 41.7
Source: Company, Elara Securities Estimates
Valuation driver - P/BV, MCap/sales, P/CEPS, EV/EBITDA 14
20 15
10 8
10
6 4
5
2 0 FY12E
FY11E
FY10E
FY09
FY08
FY07
FY06
FY05
FY04
FY03
FY02
FY01
FY00
0
EV/EBITDA & P/CEPS
P/BV & Mcap/ Sales
12
P/BV(RHS)
MCap/Sales(RHS)
P/CEPS(LHS)
EV/EBITDA(LHS)
Source: Elara Securities Estimates
76
Elara Securities (India) Private Limited
Orient Paper
Financials (Y/E Mar)
Cash Flow Statement (INR mn) Cash profit adjusted for non cash items Add/Less : Working Capital Changes Operating Cash Flow Less:- Capex Free Cash Flow Financing Cash Flow Investing Cash Flow Net change in Cash Ratio Analysis (INR mn) Income Statement Ratios (%) Revenue Growth EBITDA Growth PAT Growth EBITDA Margin Net Margin Return & Liquidity Ratios Net Debt/Equity (x) ROE (%) ROCE (%) Per Share data & Valuation Ratios Diluted EPS (INR/Share) EPS Growth (%) DPS (INR/Share) P/E Ratio (x) EV/EBITDA (x) EV/Sales (x) EV/tonne (USD) Dividend Yield (%)
FY12E 21,935 3,786 181 3,967 789 3,178 149 3,029 1,000 2,030 2,030
FY09
FY10
FY11E
FY12E
203 6,326 4,623 11,153
203 7,564 5,163 12,930
193 9,319 4,575 14,087
193 11,123 4,015 15,331
8,503 4,658 3,845 6,587 92 1,107 (502) 23 11,153
16,365 5,206 11,159 567 471 1,834 (1,103) 12,930
17,365 5,982 11,383 3,00 171 3,335 (1,103) 14,087
17,465 6,770 10,695 900 171 4,668 (1,103) 15,331
FY09
FY10
FY11E
FY12E
3,152 (520) 2,632 (5,026) (2,394) 2,426 40 73
2,756 (137) 2,619 (1,919) 700 (256) (315) 129
3,080 1,318 4,398 (732) 3,666 (1,229) 383 2,819
2,967 87 3,054 (700) 2,354 (1,144) 210 1,420
FY09
FY10
FY11E
FY12E
16.0 12.2 10.3 26.0 15.4
7.8 (21.5) (31.2) 19.0 9.8
18.1 26.4 24.3 20.3 10.4
14.7 (2.6) 2.5 17.3 9.3
0.7 41.3 43.1
0.6 22.6 22.5
0.1 23.2 24.5
(0.1) 19.7 21.7
12.0 10.3 1.5 5.1 4.1 1.1 95.6 2.5
8.3 (31.2) 1.5 7.4 5.4 1.0 68.3 2.5
10.3 24.3 1.0 6.0 3.4 0.7 50.1 1.6
10.5 2.5 1.0 5.8 2.9 0.5 39.8 1.6
25,000
26.0
30 19.0
20.3
17.3
20,000
20
15,000
10
10,000
0
FY09 FY10 Net Revenues (LHS)
FY11E FY12E EBITDA Margin (RHS)
Source: Company, Elara Securities Estimate
Adjusted profits growth trend 24.3
2,500
30 20
2,000 1,500
2.5
(2.2)
10 0
1,000
(10)
(20.4)
500
(20) (30)
0 FY09 FY10 Adjusted PAT (LHS)
FY11E FY12E PAT Growth (RHS)
Source: Company, Elara Securities Estimate
Return ratios (%) 50
43.1
40 30
41.3
20
22.6
24.5
22.5
23.2
FY10
FY11E
21.7 19.7
10 0 FY09
ROE
FY12E ROCE
Source: Company, Elara Securities Estimate
Strong return ratios
Source: Company, Elara Securities Estimate
Revenue & margins growth trend
(%)
FY11E 19,130 3,886 179 4,066 776 3,290 334 2,956 976 1,981 1,981
Cement
Share Capital Reserves Borrowings Total Liabilities Applications Gross Block Less:- Accumulated Depreciation Net Block Add:- Capital work in progress Investments Net Working Capital Deferred Tax (Net) Miscellaneous Expenses not written off Total Assets
FY10 16,198 3,074 163 3,237 550 2,686 345 2,341 748 1,593 1,593
(%)
Balance Sheet (INR mn)
FY09 15,032 3,913 212 4,126 347 3,779 191 3,588 1,273 2,315 314 2,001
(INR mn)
Net Revenues EBITDA Add:- Non operating Income OPBIDTA Less :- Depreciation & Amortization EBIT Less:- Interest Expenses PBT Less :- Taxes Adjusted PAT Add/Less: - Extra-ordinaries Reported PAT
(INR mn)
Income Statement (INR mn)
Elara Securities (India) Private Limited
Trading at a discount to its peers despite having strong return ratios
77
Orient PaperPaper Orient
Valuation & Recommendation Stock at 60% discount to its replacement cost albeit superior margins and return ratios Cement business valued at distress EV/tonne of USD62 for its adverse regional mix Reiterate our Buy rating, revise target price to INR87 At the CMP of INR61 per share, the stock is trading at 6x and 5.8x its FY11 and FY12 earnings, respectively. It is trading at an implied EV/tonne of USD 50 and USD 40 its FY11 and FY12 capacities, respectively. Despite having a healthy balance sheet and return ratios, OPI is trading at a steep discount to its peers and replacement cost. Thus we reiterate our Buy rating on the stock with a revised target price of INR 87 per share. We have valued the company on SOTP basis and the company’s paper and fan division at EV/EBITDA multiple of 1.5X and 3x respectively. We have valued the cement division at an EV/tonne of USD62/tonne. We have not assigned any value for investments which have a current market value of INR1.4bn We also have not assigned any value to the surplus land.
Exhibit 1: Sum of Parts Valuation FY12E Grey Cement Capacity
mn tonnes
EV /tonne multiple
USD/tonne
5.0
Grey Cement business EV
INR Mn
14,062
EBITDA
INR mn
253.6
EV /EBITDA
x
Paper business EV
INR mn
380
EBITDA
INR mn
523
EV / EBITDA
x
62
Paper 1.5
Fan 3.0
Fan business EV
INR mn
1,568
Total EV
INR mn
16,011
Less: Net Debt
INR mn
(691)
Target Market Capitalization
INR mn
16,702
Diluted Shares outstanding
mn
Target Price
INR/ share
193 87
Current Market Price
INR/ share
61
Potential Upside/(downside)
(%)
41.7
Source: Company, Elara Securities Estimates
78
Elara Securities (India) Private Limited
Orient Paper
Company Description Orient Paper & Industries Limited is the flagship company of CK Birla Group with cement, paper and electrical business segments. In FY10 company derived 55% of its revenue from cement, 30% from electrical and 15% from paper business.
OPI has two paper manufacturing plants at Amlai (in Madhya Pradesh) and Brajrajnagar (in Orissa). The operations at the Brajrajnagar plant, which has an installed capacity to produce 76,000 TPA of paper, have been suspended since 1999. The plant had made a loss of INR 71.6 mn at the EBIT level in FY10. OPI currently has around 850 acres of land in this unit along with fully developed townships, educational institutions and recreational centers. The Amlai plant has a capacity of 95,000 TPA (including 10,000 tonnes of tissue paper capacity). It produces writing, printing and tissue paper. The company sells paper under the brands ‘Orient’ and ‘Peacock’. OPI electrical division is located in Kolkata (in West Bengal) and Faridabad (in Haryana) with an installed capacity of 3.58 mn units per annum. The division sells ceiling fans, portable fans and exhaust fans under the brand name of ‘Orient Fan’ and ‘Orient PSPO’ and also exports to countries in the Middle East and the US.
Cement
OPI’s cement division has a 5mn tonnes capacity with manufacturing facilities at Devapur in Andhra Pradesh and Jalgaon in Maharastra. The locations of cement plants give access to key consumer markets in Maharashtra, Andhra Pradesh and Gujarat.
Board of Directors & Management CK Birla, Non-Executive Chairman CK Birla is Non-Executive Chairman of the Board of OPI. He is an industrialist having vast business experience. He holds directorship in companies like Hindustan Motors Limited., National Engineering Industries Limited., AVTEC Limited, Hyderabad Industries Limited., Birlasoft (India) Limited., The Indian Smelting & Refining Company Limited, Birla Associates Private Limited (Singapore), Nigeria Engg.Works Limited (Nigeria), Birlasoft Inc. USA, Birlasoft (U.K.) Limited London, Birla Brothers Private Limited. Manohar Pachisia, Managing Director M L Pachisia is Managing Director and Executive Director of OPI. He has an experience of over 47 years and controls the affairs of the Company as
Elara Securities (India) Private Limited
a whole. His directorships include GMMCO Limited., National Engg. Industries Limited.., Birla Buildings Limited.., Soorya Vanijya & Investment Limited., Gwalior Finance Corp. Limited., Birlasoft (India) Limited., National Bearing Company (Jaipur) Limited.., Birlasoft Enterprises Limited., Nigeria Engineering Works Limited. (Nigeria), Rivers Vegetable Oil Company Limited. Michael Bastian, Additional Director Michael Bastian has been appointed as an Additional Director of OPI. Mr. Michael Bastian’s directorship includes Hindustan Copper Limited., Elder Pharmaceuticals Limited, Artson Engineering Limited.., National Textile Corporation Limited, Indian Oil Corporation Limited.
79
Orient Paper
Coverage History 70
1
60 2 50 40 30 20 10
Not Covered
Date
Rating
Target Price
Closing Price
1
29-Apr-2010 Buy
INR80
INR64
2
02-Nov-2010 Buy
INR87
INR61
Oct-10
Nov-10
Sep-10
Aug-10
Jul-10
Jun-10
May-10
Apr-10
Mar-10
Jan-10
Feb-10
Dec-09
Nov-09
Oct-09
Sep-09
Aug-09
Jul-09
Jun-09
May-09
Apr-09
Mar-09
Feb-09
Jan-09
Dec-08
Nov-08
Oct-08
Sep-08
Aug-08
Jul-08
Jun-08
May-08
Apr-08
0
Covered
Guide to Research Rating
80
BUY
Absolute Return >+20%
ACCUMULATE
Absolute Return +5% to +20%
REDUCE
Absolute Return -5% to +5%
SELL
Absolute Return < -5%
Elara Securities (India) Private Limited
9 November 2010
India | Cement
Company Update/Target price changed
Cementing its true place
Rating : Buy
Capacity to go up by 67%, debottlenecking to boost volume
Target Price : INR78 Upside : 24% CMP : INR63 (as on 2 November 2010)
JK Lakshmi Limited (JKL) is in the process of increasing its cement capacity by 67% from existing 4.75mn tonnes to 7.95mn tonnes by end of FY13 through a new greenfield plant and debottlenecking of the existing plant. The debottlenecking would enhance cement volume of JKL at a CAGR of ~1% (FY10-12) while the benefit from the greenfield plant is expected to be visible only from end of FY13. Savings from captive power to partly mitigate margin pressure The company is also expanding its captive power capacity to 66 MW by setting up a 12 MW waste heat recovery plant (WHR) and an 18 MW thermal power plant at Sirohi, Rajasthan. For the WHR plant, which will generate carbon credits, the variable cost will be INR0.3-0.4 per unit. Savings from captive power (INR130/tonne) is expected to partly cushion the margins for the company.
Key data* Bloomberg /Reuters Code Current /Dil. Shares O/S (mn) Mkt Cap (INRbn/USDmn) Daily Vol. (3M NSE Avg.) Face Value (INR)
Source: Bloomberg ; * As on 2 November 2010
Price & Volume
Enough cash to fund capex, sound debt equity ratio too At the end of FY10, JKL had gross cash and investments of INR7bn (INR 57 per share,) and a comfortable net debt equity ratio of 0.2x. We believe that the cash balance and internal accruals will be sufficient to fund capex plan of the company for the next 1.5 years. Thus we expect the company’s gross debt (~INR9.2bn) to remain at current levels up to end of FY12. Not to make losses in current cycle on lower leverage Unlike the last down cycle, we do not expect JK Lakshmi to incur losses (on an annual basis) in the current down cycle as it has lower leverage, and has undertaken cost cutting measures. Despite strong fundamentals and an increase in replacement cost, the stock is trading at a discount to the last down cycle.
90
4
80
3
70
2
60
1
50
0
Oct-09
Feb-10 Vol. in mn (RHS)
Jun-10
Oct-10 JK Laxmi (LHS)
Source: Bloomberg
Share holding (%)
Q3FY10 Q4FY10 Q1FY11 Q2FY11
Promoter
44.5
44.2
44.2
44.2
Institutional Investors
20.9
21.2
22.7
19.4
Other Investors
9.5
9.5
9.6
15.3
General Public
25.2
25.1
23.5
21.1
Source: BSE
Price performance (%)
3M
6M
12M
12.3
17.0
32.1
4.3
(9.7)
3.7
Ultratech
30.1
17.5
51.5
ACC
28.0
17.5
51.9
Sensex JK Lakshmi Cement
Valuation
JKLC IN/JKLC.BO 122/122 8/174 201,113 5
1 USD= INR 44.4
Source: Bloomberg
At the CMP of INR63, JKL is trading at 6.4x and 4.8x its FY11 and FY12 earnings respectively. On an EV/tonne basis, it is trading at USD47 and USD55 at its FY11 and FY12 capacities respectively. Despite much stronger fundamentals and an increase in replacement costs, the stock is trading at a discount to the last down cycle. The stock is trading at close to half of its replacement cost and 20% discount to the FY10 book value. Thus we are reiterating our Buy rating on the stock with a revised priced target of INR78/share. We have valued the company at EV/tonne of USD62 on FY12 capacity.
Stock performance 140 Rebased to 100
Global Markets Research
JK Lakshmi Cement
120 100 80 Nov-09
Feb-10
May-10
JK Laxmi
Aug-10
Nov-10
Sensex
Source: Bloomberg
Key Financials Y/E Mar (INR mn) FY08 FY09 FY10 FY11E FY12E
Rev 11,077 12,245 14,905 14,420 17,392
YoY (%) 31.3 10.6 21.7 (3.3) 20.6
EBITDA EBITDA (%) 3,513 31.7 3,106 25.4 4,246 28.5 2,852 19.8 3,505 20.2
Adj PAT 2,237 1,786 2,411 1,205 1,606
YoY (%) Fully DEPS 25.6 18.3 (20.2) 14.6 35.0 19.7 (50.0) 9.8 33.3 13.1
RoE (%) 43.5 25.2 27.2 11.6 13.8
P/E (x) 3.5 4.3 3.2 6.4 4.8
EV/tonne (USD) EV/EBITDA 68.2 3.1 49.7 3.3 46.6 2.3 47.0 3.8 54.7 3.6
Source: Company, Elara Securities Estimates
Ravindra Deshpande • [email protected] • +91 22 4062 6805 Ravi Sodah • [email protected] • +91 22 4062 6817 Elara Securities (India) Private Limited
JK Lakshmi Cement Valuation trigger
Brownfield cement expansion coming on stream
CPPs coming on stream
Investment summary
Cement capacity to increase by 67%
CPP capacity to increase by 83%
90 80
3 2
70
1
60 50 40
Target price reached
30
Valuation trigger 1. Brownfield cement expansion coming on stream 2. CPPs coming on stream
20
10
Key risks Oct-11
Jun-11
Aug-11
Apr-11
Feb-11
Oct-10
Dec-10
Jun-10
Aug-10
Apr-10
Feb-10
Oct-09
Dec-09
Jun-09
Aug-09
Apr-09
Feb-09
Oct-08
Dec-08
Jun-08
Aug-08
Apr-08
0
Source: Bloomberg, Elara Securities Estimates
Sharp decline in cement prices
Slow down in cement demand
Our assumptions
Valuation overview - EV/tonne based valuations FY12E Capacity
mn tonnes
EV /tonne multiple
USD/tonne
EV
INR mn
62 14,890
INR mn
5,296
Target Market Capitalization
INR mn
9,594
Diluted Shares outstanding
mn
Target Price
INR/ share
78
Current Market Price
INR/ share
63
Potential Upside/(downside)
(%)
122
24.0
Source: Company, Elara Securities Estimates
Valuation driver - EV/tonne , RoE and RoCE 140
50
25
100 80
0
60 40
(25)
20 0
82
RoE(RHS)
FY05
FY04
FY02
FY01
FY00
FY99
FY98
FY97
FY96
FY95
FY94
(50)
RoCE (RHS)
(%)
EV per tonne (USD)
120
Source: Elara Securities Research
Cement Volume to grow at a CAGR of ~1%
Realizations to increase at a CAGR of 3.7%.
5.3
Less: Net Debt
EV/Tonnein USD(LHS)
JK Lakshmi Cement
Financials (Y/E Mar) FY11E
FY12E
14,420
17,392
3,106
4,246
2,852
3,505
61
93
94
101
3,167
4,339
2,946
3,606
Add:- Non operating Income OPBIDTA Less :- Depreciation & Amortization EBIT
691
800
952
1,071
2,476
3,539
1,994
2,535
Less:- Interest Expenses PBT
209
230
387
393
2,267
3,309
1,606
2,141
Less :- Taxes Adjusted PAT
481
897
402
535
1,786
2,411
1,205
1,606
-
-
-
-
Add/Less: - Extra-ordinaries
Revenue & margins growth trend 20,000
0
2,411
1,205
1,606
FY11E
FY12E
612
612
612
612
Reserves
7,701
9,595
10,619
12,065
3,000
Borrowings
7,027
9,217
9,217
9,217
2,500
351
921
921
921
2,000
Total Liabilities
15,690
20,346
21,369
22,815
Gross Block
17,605
19,036
22,546
22,646
7,474
8,406
9,358
10,429
10,131
10,630
13,189
12,218
970
1,820
2,400
6,600 3,305
Net Working Capital Total Assets Cash Flow Statement (INR mn) Cash profit adjusted for non cash items
Less:- Capex
(INR mn)
1,500
33.3
40 20 0
(20.2)
(20)
1,000
(50.0)
500
(40) (60)
0 FY09 FY10 Adjusted PAT (LHS)
4,805
4,805
3,091
975
692
15,690
20,346
21,369
22,815
FY09
FY10
FY11E
FY12E
2,864
3,664
2,544
3,070
253
(98)
865
(54)
Return ratios (%)
3,117
3,566
3,409
3,016
30
(2,246)
(2,307)
(4,091)
(4,300)
25
871
1,259
(681)
(1,284)
20
(670)
1,229
(862)
(818)
FY11E FY12E PAT Growth (RHS)
Source: Company, Elara Securities Estimate
15
Investing Cash Flow
(410)
(3,550)
294
1,764
10
Net change in Cash
(209)
(1,063)
(1,249)
(338)
5
Ratio Analysis
FY09
FY10E
FY11E
FY12E
0
10.6
21.7
(3.3)
20.6
EBITDA Growth
(11.6)
36.7
(32.8)
22.9
PAT Growth
(20.2)
35.0
(50.0)
33.3
EBITDA Margin
25.4
28.5
19.8
20.2
Net Margin
14.6
16.2
8.4
9.2
25.2
19.3
27.2
21.9
11.6 11.1
FY09
Income Statement Ratios (%) Revenue Growth
35.0
889
Free Cash Flow Financing Cash Flow
Adjusted profits growth trend
3,700
Add/Less : Working Capital Changes Operating Cash Flow
(%)
Investments
FY11E FY12E EBITDA Margin (RHS)
Source: Company, Elara Securities Estimate
FY10E
Add:- Capital work in progress
0
FY09 FY10 Net Revenues (LHS)
FY09
Net Block
10
5,000
1,786
Less:- Accumulated Depreciation
20
10,000
Balance Sheet (INR mn)
Deferred Tax (Net)
30 20.2
19.8
15,000
Reported PAT Share Capital
28.5
25.4
Cement
FY10 14,905
(%)
EBITDA
FY09 12,245
(%)
Net Revenues
(INR mn)
Income Statement (INR mn)
FY10 ROE
FY11E
13.8 12.8
FY12E
ROCE
Source: Company, Elara Securities Estimate
Return & Liquidity Ratios Net Debt/Equity (x)
0.4
0.2
0.3
0.4
ROE (%)
25.2
27.2
11.6
13.8
ROCE (%)
19.3
21.9
11.1
12.8
Comfortable debt equity ratio
Per Share data & Valuation Ratios Diluted EPS (INR/Share)
14.6
19.7
9.8
13.1
EPS Growth (%)
(20.2)
35.0
(50.0)
33.3
DPS (INR/Share)
2.0
2.5
1.8
1.6
P/E Ratio (x)
4.3
3.2
6.4
4.8
EV/EBITDA (x)
3.3
2.3
3.8
3.6
EV/Sales (x)
0.9
0.7
0.8
0.7
49.7
46.6
47.0
54.7
3.2
4.0
2.8
2.5
EV/tonne (USD) Dividend Yield (%) Source: Company, Elara Securities Estimate
Elara Securities (India) Private Limited
Trading at a steep discount to the large cap peers as well as to its replacement cost 83
JK Lakshmi Cement Cement JK Lakshmi
Valuation & Recommendation Available at subdued valuation, trading at 45% discount to its replacement cost Valuing cement business at distress EV/tonne of USD62, pricing in all negatives Reiterating our Buy rating, revising target price to INR78 At the CMP of INR63, JKL is trading at 6.4x and 4.8x its FY11 and FY12 earnings respectively. On an EV/tonne basis, it is trading at USD47and USD55 at its FY11 and FY12 capacities respectively. The stock is trading at 13% discount to the distress value of a cement plant (USD 62) despite having strong balance sheet. The stock is trading at 5% discount to its own last down cycle valuations despite much stronger fundamentals. Thus we are reiterating our Buy rating on the stock with revised target price of INR 78 per share.
Exhibit 1: EV/tonne based valuations FY12E Capacity
Mn tonnes
5.3
EV /tonne multiple
USD/tonne
62
EV
INR Mn
Less: Net Debt
INR Mn
5,296
Target Market Capitalization
INR Mn
9,594
Diluted Shares outstanding
mn
Target Price
INR/ share
78
Current Market Price
INR/ share
63
Potential Upside/(downside)
(%)
Source: Company, Elara Securities Estimates
84
14,890
122
24.0
JK Lakshmi Cement
Company Description JK Lakshmi Cement Limited, a mid-sized cement company, is the flagship company of Hari Shankar Singhania group and was earlier known as JK Corp. The company started its cement business in 1982 with a total installed capacity of 5lakhs tonnes pa in Sirohi district of Rajasthan which at present stands at 4.75mn tonnes. The company is planning to increase it to 7.95mn tonnes by end of FY13. The company also has a 36 MW CPP at Sirohi, Rajasthan and 11 RMC units of capacity 0.75mn cubic meters. The major selling markets of the company include Rajasthan, Gujarat, Maharashtra and other North Indian states (viz: J&K, Himachal Pradesh, Punjab, Haryana, Delhi and West UP).
Hari Shankar Singhania, Non-Executive Chairman
Shailendra Chouksey, Director
Hari Shankar Singhania is the Non-Executive Chairman of JK Lakshmi Cement
Shailendra Chouksey, is the Whole Time Director of JK Lakshmi Cement
Vinita Singhania, Managing Director, Vinita Singhania is the Managing Director of JK Lakshmi Cement
Elara Securities (India) Private Limited
Cement
Board of Directors & Management
85
JK Lakshmi Cement
Coverage History 90 80
1
70 60
3
2
50 40 30 20
Not Covered
Date
Rating
Target Price
Closing Price
1
29-Apr-2010 Buy
INR100
INR72
2
28-Jul-2010
Buy
INR90
INR63
3
02-Nov-2010 Buy
INR78
INR63
Guide to Research Rating
86
BUY
Absolute Return >+20%
ACCUMULATE
Absolute Return +5% to +20%
REDUCE
Absolute Return -5% to +5%
SELL
Absolute Return < -5%
Covered
Oct-10
Nov-10
Sep-10
Aug-10
Jul-10
Jun-10
May-10
Apr-10
Mar-10
Jan-10
Feb-10
Dec-09
Nov-09
Oct-09
Sep-09
Aug-09
Jul-09
Jun-09
May-09
Apr-09
Mar-09
Feb-09
Jan-09
Dec-08
Nov-08
Oct-08
Sep-08
Aug-08
Jul-08
Jun-08
May-08
Apr-08
10
Elara Securities (India) Private Limited
The Note is based on our estimates and is being provided to you (herein referred to as the “Recipient”) only for information purposes. The sole purpose of this Note is to provide preliminary information on the business activities of the company and the projected financial statements in order to assist the recipient in understanding / evaluating the Proposal. Nothing in this document should be construed as an advice to buy or sell or solicitation to buy or sell the securities of companies referred to in this document. Each recipient of this document should make such investigations as it deems necessary to arrive at an independent evaluation of an investment in the securities of companies referred to in this document (including the merits and risks involved) and should consult its own advisors to determine the merits and risks of such an investment. Nevertheless, Elara or any of its affiliates is committed to provide independent and transparent recommendation to its client and would be happy to provide any information in response to specific client queries. Elara or any of its affiliates have not independently verified all the information given in this Note and expressly disclaim all liability for any errors and/or omissions, representations or warranties, expressed or implied as contained in this Note. The user assumes the entire risk of any use made of this information. Elara or any of its affiliates, their directors and the employees may from time to time, effect or have effected an own account transaction in or deal as principal or agent in or for the securities mentioned in this document. They may perform or seek to perform investment banking or other services for or solicit investment banking or other business from any company referred to in this Note. Each of these entities functions as a separate, distinct and independent of each other. This Note is strictly confidential and is being furnished to you solely for your information. This Note should not be reproduced or redistributed or passed on directly or indirectly in any form to any other person or published, copied, in whole or in part, for any purpose. This Note is not directed or intended for distribution to, or use by, any person or entity who is a citizen or resident of or located in any locality, state, country or other jurisdiction, where such distribution, publication, availability or use would be contrary to law, regulation or which would subject Elara or any of its affiliates to any registration or licensing requirements within such jurisdiction. The distribution of this document in certain jurisdictions may be restricted by law, and persons in whose possession this document comes, should inform themselves about and observe, any such restrictions. Upon request, the Recipient will promptly return all material received from the company and/or the Advisors without retaining any copies thereof. The Information given in this document is as of the date of this report and there can be no assurance that future results or events will be consistent with this information. This Information is subject to change without any prior notice. Elara or any of its affiliates reserves the right to make modifications and alterations to this statement as may be required from time to time. However, Elara is under no obligation to update or keep the information current. Neither Elara nor any of its affiliates, group companies, directors, employees, agents or representatives shall be liable for any damages whether direct, indirect, special or consequential including lost revenue or lost profits that may arise from or in connection with the use of the information. This Note should not be deemed an indication of the state of affairs of the company nor shall it constitute an indication that there has been no change in the business or state of affairs of the company since the date of publication of this Note. The disclosures of interest statements incorporated in this document are provided solely to enhance the transparency and should not be treated as endorsement of the views expressed in the report. Elara Securities (India) Private Limited generally prohibits its analysts, persons reporting to analysts and their family members from maintaining a financial interest in the securities or derivatives of any companies that the analysts cover. The analyst for this report certifies that all of the views expressed in this report accurately reflect his or her personal views about the subject company or companies and its or their securities, and no part of his or her compensation was, is or will be, directly or indirectly related to specific recommendations or views expressed in this report.
Global Markets Research
Disclosures & Confidentiality
Any clarifications / queries on the proposal as well as any future communication regarding the proposal should be addressed to Elara Securities (India) Private Limited / the company.
Disclaimer The information contained in this note is of a general nature and is not intended to address the circumstances particular individual or entity. Although we endeavor to provide accurate and timely information, there can guarantee that such information is accurate as of the date it is received or that it will continue to be accurate in the No one should act on such information without appropriate professional advice after a thorough examination particular situation.
of any be no future. of the
87 87
Elara Securities (India) Private Limited India
Europe
USA
Asia / Pacific
Elara Securities (India) Pvt. Ltd. Kalpataru Synergy, 6th Level, East Wing, Opp Grand Hyatt, Santacruz East, Mumbai – 400 055, India Tel : +91 22 4062 6868
Elara Capital Plc. 29 Marylebone Road, London NW1 5JX, United Kingdom Tel : +44 20 7486 9733
Elara Capital Inc. 535 Fifth Avenue 29th Floor New York, NY 10017 Tel : 646-884-7130
Elara Capital (Singapore) Pte. Ltd. 30 Raffles Place #20-03, Chevron House Singapore 048622 Tel : +65 6536 6267
Harendra Kumar
Head - Institutional Equities & Global Research
[email protected]
+91 22 4062 6871
[email protected]
+44 20 7467 5578
Sales Joseph K. Mammen
Global Head Sales & Trading London
+44 78 5057 7329
Jonathan Camissar
London
+44 79 1208 7272
[email protected]
+44 20 7299 2575
Vishal Pattani
London
+44 77 0220 1384
[email protected]
+44 20 7467 5452
Prashin Lalvani
India
+91 98334 77685
[email protected]
+91 22 4062 6844
Koushik Vasudevan
India
+91 98676 96668
[email protected]
+91 22 4062 6841
Amit Mamgain
India
+91 98676 96661
[email protected]
+91 22 4062 6843
Nirav Shah
India
+91 90040 27862
[email protected]
+91 22 4062 6842
Ananthanarayan Iyer
India
+91 98334 99217
[email protected] +91 22 4062 6856
Vishal Thakkar
India
+91 98694 07973
[email protected]
+91 22 4062 6857
Manoj Murarka
India
+91 99675 31422
[email protected]
+91 22 4062 6851
Abhinav Bhandari
Analyst
Construction, Infrastructure
[email protected]
+91 22 4062 6807
Aliasgar Shakir
Analyst
Mid caps
[email protected]
+91 22 4062 6816
Alok Deshpande
Analyst
Oil & Gas
[email protected]
+91 22 4062 6804
Amol Bhutada
Analyst
Auto & Auto Ancillaries
[email protected]
+91 22 4062 6806
Sales Trading & Dealing
Research
Analyst
FMCG, Hotels, Hospitals
[email protected]
+91 22 4062 6801
Analyst
Media & Retail
[email protected]
+91 22 4062 6802
Pankaj Balani
Analyst
Derivative Strategist
[email protected]
+91 22 4062 6811 +91 22 4062 6808
Himani Singh Mohan Lal Pralay Das
Analyst
Information Technology
[email protected]
Ravindra Deshpande
Analyst
Metals & Cement
[email protected] +91 22 4062 6805
Ravi Sodah
Analyst
Cement
[email protected]
+91 22 4062 6817
Sumant Kumar
Analyst
FMCG
[email protected]
+91 22 4062 6803
Surajit Pal
Analyst
Pharmaceuticals, Real Estate
[email protected]
+91 22 4062 6810
Kavitha Rajan
Associate
Telecom, Information Technology
[email protected]
+91 22 4062 6814
Pooja Sharma
Associate
Construction, Infrastructure
[email protected]
+91 22 4062 6819
Saira Ansari
Associate
Pharmaceuticals, Real Estate
[email protected]
+91 22 4062 6812
Sreevalsan Menon
Editor
[email protected]
+91 22 4062 6813
Gurunath Parab
Production
[email protected]
+91 22 4062 6815
Access our reports on Bloomberg: Type ESEC
Also available on Thomson & Reuters
Member (NSE, BSE) Regn Nos: CAPITAL MARKET SEBI REGN. NO.: BSE: INB 011289833, NSE: INB 231289837 DERIVATIVES SEBI REGN. NO.: NSE: INF 231289837 CLEARING CODE: M51449. Website: www.elaracapital.com Investor Grievance Email ID: [email protected]
88
Related Documents

Cement Elra
January 2021 3
Understanding Cement
January 2021 1
Acc Cement
February 2021 0
Cement Mannual
February 2021 0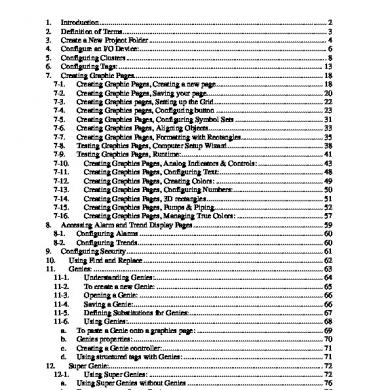
Cement Citect Training
January 2021 1
Attock Cement Maintenance
February 2021 0More Documents from "danialme089"