Pq Inductn Melting Tc114625
This document was uploaded by user and they confirmed that they have the permission to share it. If you are author or own the copyright of this book, please report to us by using this DMCA report form. Report DMCA
Overview
Download & View Pq Inductn Melting Tc114625 as PDF for free.
More details
- Words: 5,215
- Pages: 8
Loading documents preview...
techcommentary Power Quality for Induction Melting in Metals Production Introduction Fast, efficient batch melting using the modern induction furnace can improve operating flexibility and production yield, as well as reduce the cost of environmental protection. The compelling advantages of induction batch melting have encouraged foundries to change the way they handle their melting operations. Among the chief advantages is cost. The operational cost of a typical induction-melt furnace is in the neighborhood of $130 per ton for steel, which compares favorably with the operational cost of a typical electric arc furnace.
compete because of control and efficiency limitations. Highfrequency systems, which operate at greater than 3 kHz, are relatively small and limited to special applications.
Despite the appeal of the medium-frequency induction furnace, the same advances that make it so effective also engender problems with the power interface. For example, consider harmonic distortion. Today, the most efficient furnaces run at full power and vary the frequency to optimize Figure 1. Modern variable-frequency induction enables the melt. The furnace generates efficient batch-melting processes. The furnace is poured fixed- and variable-frequency empty after each melt, and successive melts are started using harmonics that may lead to unheated or preheated metal. Because there is no need to adverse interactions between the maintain a molten heel, smaller furnaces can be used, Since the 1970s, induction has furnace and the utility system. electrical energy goes further, alloy changes are easier, and loading safety is enhanced. Induction batch melting has This is particularly true of the been the number one method brought about meaningful increases in both the efficiency popular high-power-density of melting in non-ferrous and productivity of the modern melt shop. coreless-induction furnaces, metal foundries and an which typically operate as a important tool in iron foundries. New technology is improving relatively large load at distribution-level intended to help both furnace users and induction power supplies, furnace voltage. their energy providers better anticipate refractory linings, heat recovery, and and resolve power quality problems related overall system control. In the last ten to induction melting. The Furnace Circuit years, the use of induction melting has Electrically, an induction-melt furnace is increased by as much as 20% per year, Electrical Characteristics of simply a loosely coupled transformer. As making it the fastest growing electric Induction Furnaces shown in Figure 2, current in the power technology in metals production. Over coil surrounding a ceramic crucible The growth in use of induction melting time, induction may even surpass generates a magnetic field. Laminated iron has come about primarily because of conventional use of electric arc furnaces significant technology in both tons of production and kilowattadvances in the furnace hours of energy use. power supply and its resonant circuit. This growth Only a fraction the size of an electric arc is primarily in mediumfurnace, the induction-melt furnace may frequency systems, sized from still cause power quality problems in the 0.2 to 16 MW and operating electric utility system. Power quality at frequencies from 150 to problems are more likely when an 3000 Hz. These mediuminduction-melt furnace is connected at frequency furnaces have distribution-level voltages, where the proven to be versatile and furnace current is relatively large efficient at a relatively large compared to the utility supply. In a few scale. The older lowcases, new installations of mediumfrequency models, which frequency induction-melt furnaces have connect directly to the lead to difficult-to-resolve power interface Figure 2. Components of a Large Induction-Melt Furnace 60-Hz utility source, cannot problems. This TechCommentary is
forms a magnetic yoke that also surrounds the crucible. The crucible helps to distribute and contain the field, which induces current in the conductive metal to be melted. The current that penetrates the metal is controlled to ensure proper stirring of the metal and prevent overstirring. A concentrated current on the outer layer of metal to be melted generates the melting power as it quickly heats to the melting point. The refractory lining and cooling jacket separate the hot metal from the furnace power coil. The power supply of an induction-melt furnace provides both the power and control required to properly melt metal. Early induction melting was carried out at line frequency, with power provided by a special transformer and tuning circuits. Switching capacitors provided powerfactor adjustment, and changing transformer taps regulated the power level. For maximum melting power, the resonant frequency of a tuned LC circuit had to be matched to the line frequency. This condition limited the coil current and therefore the efficiency of the furnace because the 60-Hz line frequency results in relatively high penetration into the melt and excessive stirring. Also, early induction-melt furnaces were single-phase loads, which draw heavily from only one phase of a three-phase system and limit the power available from the utility service. The advent of large-scale solid-state power supplies has greatly improved induction melting. Three-phase converters, can be operated at a high power factor, thereby increasing the practical power ratings in a typical application. These power supplies also precisely control frequency and the depth of penetration to efficiently melt the material without over-stirring. The process is more efficient because the variablefrequency power supplies are able to match the varying electrical characteristics of different metals during melting. The electronic power supply that is used on the modern furnace has opened the way for batch operation by eliminating the need to maintain a molten heel. Figure 3 shows a typical furnace and its electronic power supply. To achieve an efficient and fast melt, more power per unit weight of the metal being melted is desired. Typical power densities in the medium-frequency furnace range 2
Figure 3. Typical Electronic Power Supply and Medium-Frequency Induction-Melt Furnace
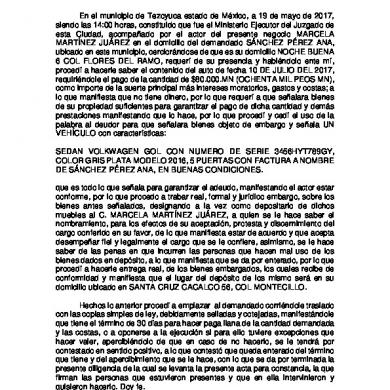
from 600 to 1000 kW per ton, compared to 200 to 400 kW per ton in the linefrequency furnace. Electric arc furnaces also operate at high power densities. However, the arc melting temperatures are significantly higher than induction melting-in the neighborhood of 6000°F (3300°C), compared to 2600°F (1400°) for induction-melt furnaces. The higher temperature in an electric arc furnace enables the melting of somewhat dirtier metal but also leads to a few percent higher losses of metal to ionization and creation of ash. Figure 4 illustrates recorded electrical parameters of an actual medium-frequency furnace during a typical batch cycle. 1. Metal is loaded into the furnace using a heavy duty conveyor. The melting process forms a molten bath in the bottom of the ceramic crucible. In this case loading continues until the crucible is filled with 10 tons (9 Mg) of molten metal, at about 2600°F (1400°C).
2. After all of the metal has melted, the batch is superheated to the desired tap temperature of about 2800°F (1500°C). 3. Then, the power is removed so that the molten metal can be poured into a ladle. Depending on the relative size and configuration, furnace operation can affect power quality at the point of common coupling (PCC) or at the interface with the public power supply. Many different electronic power supply configurations are available. The choice of configuration will have a big impact on both furnace performance and electrical compatibility. The following is a summary of practical power supply options that may help to avoid costly corrective actions or operating curtailments when they are considered before furnace installation. The Electronic Power Supply Circuit Electronic power supplies control current and frequency for efficient induction melting. Most electronic power supplies
Figure 4. Electrical Parameters During a Typical Batch Cycle for a 6-MW, 2400-Volt Furnace (scrap iron loaded at 10 tons/hour (9 Mg/h); power supply running at 200 to 275 Hz, 36,000 Amps)
rectify the AC line current to provide a DC source of energy. This DC is then inverted at a frequency to obtain the desired induction from the furnace resonant circuit. The two main types of solid-state power supplies are the currentfed power supply (parallel furnace resonant circuit) and the voltage-fed power supply (series furnace resonant circuit), both of which are used in mediumfrequency induction melting systems. These different power supply designs have different impacts on the furnace performance, as indicated in Table 1. Voltage-Fed Power Supplies The voltage-fed power supply, which is the newer of the two designs, takes advantage of switching technology that is capable of handling high currents. As shown in Figure 5, it employs a simple input diode rectifier to produce DC, and a parallelconnected DC capacitor for energy storage and filtering. The output inverter controls melting power by its commutation frequency and can fully regulate the current to the series tuning capacitor and the furnace. Consequently, the inverter is exposed to the full current and partial voltage of the furnace. The DC capacitor provides or absorbs excess energy for starting and stopping the inverter. Current-Fed Power Supplies As shown in Figure 6, the basic current-fed converter uses a phase-controlled rectifier to convert AC to DC and to regulate the voltage on the DC link. When current is flowing in the DC link, the two seriesconnected inductors provide energy storage and filtering. Consequently, a starter circuit is needed to energize these inductors, and a crowbar circuit is used to discharge them when the melt is complete. The inverter commutates or reverses the current to obtain the desired output frequency, which, along with varying the rectifier output voltage, controls the melting power. Current-fed designs have been around longer and take advantage of rugged and economical switching-device technology. The inverter is exposed to the full furnace voltage. However, it only sees about 10% of the furnace resonant current because the reactive component of the furnace current bypasses the inverter via the parallel tuning capacitor. Consequently, the current-fed power supply has less control over the
Table 1. Performance and Interface Comparisons for Medium-Frequency Melt Furnaces
Characteristics
Current-Fed Inverter
Voltage-Fed Inverter
Poor
Excellent
70-80%
75-85%
Power-Line Interface
Phase-Controlled Rectifier
Diode Rectifier
DC-Energy Storage
Inductive, Dynamic
Capacitive, Static
Controllability of Melt Efficiency of Melt
Figure 5. Voltage-Fed Power Supply Driving a Series-Resonant Furnace Circuit
Figure 6. Current-Fed Power Supply Driving a Parallel-Resonant Furnace Circuit
furnace current than the voltage-fed power supply. One side effect of using a phase-controlled rectifier in the current-fed power supply is voltage notching. The line voltage is notched because a momentary line-to-line fault occurs as each phase rectifier device is turned on before the other phase device has commutated off. Depth of the notch depends on the circuit impedance between
furnace transformer and the rectifier. Width depends on the timing between turn-on and turn-off. Notches are more severe near the converter, as illustrated in the voltage waveform shown in Figure 6. Notching can cause equipment operating problems when propagated in a plant electrical system. The most common problem caused by notching is tripping of other power supplies and DC drives. 3
Common Power Quality Concerns About Induction Furnaces
Table 2. Power Quality Comparisons (Single-Rectifier-Bridge Configuration)
Characteristics
Current-Fed Inverter
Voltage-Fed Inverter
Sometimes thought to be a panacea for the Line-Voltage Notching Yes (Caused by Phase Control) No induction melting process, modern solidstate power supplies have actually been a Harmonic Generation High Moderate mixed blessing for achieving compatibility System Power Factor 0.7-0.95 (Depends on Phase Control) 0.95 with the electric utility system. Large three-phase power supplies for furnaces, Generates Inter-Harmonics Yes (Depends on Furnace Frequency) No while providing economies of scale with higher productions levels, also bring large fluctuating load currents with varying levels of harmonic Table 3. Ideal Square Wave and Practical Harmonic Spectrum for Furnace Rectifiers distortion. These varying furnace currents can affect Rectifier Individual Harmonic Order and Levels (% of Fundamental) distribution line-voltage regulation and quality. Harmonic➝ 5th 7th 11th 13th 17th 19th 23rd 25th Total Table 2 provides a summary 6-Pulse (I) 20 14.3 9.1 7.7 5.9 0.5 4.3 4.0 29% and comparison of power quality concerns for both the 6-Pulse (P) 17.5 11.0 4.5 2.9 1.5 1 0.9 0.8 21.5% current- and the voltage-fed 12-Pulse (I) 0 0 9.1 7.7 0 0 4.3 4.0 15.5% power supply. 12-Pulse (P) 2.6 1.6 7.9 5.5 0.2 0.1 2.3 0.8 10.4% Generation of Current 24-Pulse (I) 0 0 0 0 0 0 4.3 4.0 5.9% Harmonics 24-Pulse (P) 2.6 1.6 0.7 0.4 0.2 0.1 1.9 0.8 3.8% Both current- and voltage-fed inverters generate harmonics I = Ideal Square Wave back into power lines in the P = Practical Case process of rectifying AC to DC. In the larger furnaces, it is popular to provide more than one due to unbalances, other harmonics are Power Factor of Furnace and rectifier bridge, along with phase-shifting present in practical applications, as shown Power Supply transformers. This reduces the amount in Table 3. Even so, the total harmonics in The term “power factor” is well defined of current per bridge and the level of most practical applications are moderately for 60-Hz systems as the phase difference harmonics in the combined current drawn less than theory predicts for ideal squarebetween the fundamental current and from the utility. Each three-phase bridge stepped waveforms where each individual voltage. In the presence of harmonics, requires six devices, and one positive and harmonic (N) is 1/N of the fundamental. power factor is best defined one negative pole for each as the ratio of the watts phase. A single bridge, such as over the total kVA for all shown in Figures 5 and 6, is frequencies. Distorted called a six-pulse rectifier, two systems have limited power bridges a 12-pulse, as shown in factors even when the Figure 7, and so on. fundamental voltage and Increasing the number of current are in phase. For rectifier bridges adds more example, when the current steps in the waveform of the line is 21.5% distorted, as with current, making it more the practical case of a sinusoidal. The harmonics six-pulse rectifier, the produced by 6-, 12-, and maximum power factor is 24-pulse rectifiers are shown 0.98 instead of 1.0. At 60% in Table 3. Assuming and ideal distortion, the maximum square wave, a rectifier should power factor is about 0.86. only have harmonics that are an The expected power factors integer multiple of the number for 6-, 12-, and 24-pulse of pulses ±1. For example, in a bridge rectifiers in full-wave 12-pulse rectifier, the harmonic rectification mode are components should be 11, 13, Figure 7. Typical 12-Pulse Bridge Rectifier Configuration with Phaserelatively high, as shown in Shifting Transformers 23, 25, and so on. However, 4
Table 4. The greater the number of pulses the greater the expected power factor. Compared to the full-wave rectifier in voltage-fed power supplies, the phasecontrolled rectifier in current-fed power supplies uses a delay in turning on switches to control power levels and to regulate the DC bus voltage. It should be noted that the power level and power factor in a phase-controlled rectifier drops rapidly with the increase of delay angle. At a delay angle of 30°, the maximum is 0.95, at 90° it is less than 0.7, and at 120° it drops to 0.46. Therefore, if the power supply is current-fed, low power factors can be expected when the power supply reduces power to the furnace. Table 4. Expected Power Factor for Full-Wave Rectifiers
Number of Pulses
Power Factor
6
0.955
12
0.988
24
0.997
Voltage Fluctuations Caused by the Furnace Circuit In addition to the harmonics that are normally expected from different pulse rectifiers large furnaces operating at a few hundred hertz can generate significant non-characteristic harmonics. These harmonics, which fluctuate with the frequency of the furnace resonant circuit, are usually not multiples of the supply frequency, making them difficult to filter. This phenomenon, known as interharmonics, can overload power system capacitors, introduce noise into transformers, cause lights to flicker, instigate UPS alarms, and trip adjustablespeed drives (see “Inter-Harmonics in Power Systems”). The typical scenario for the generation of inter-harmonics is a relatively large furnace with a current-fed power supply operating between 100 and 500 Hz on a distribution feeder. When the power supply inverter is operating at frequency f0, the frequency reflected back to the rectifier is two times f0. This frequency combines with the line frequency (60 Hz), resulting in line currents containing harmonics of two times f0 ±60, 4f0 ±60,
and so on. For example, a 12-pulse rectifier feeding a furnace operating at 123 Hz may have inter-harmonics at 186 and 306 Hz, 432 and 552 Hz, and so on. These frequencies are not characteristic of the 12-pulse rectifier and are fed back into the power system from the current of the furnace’s resonant circuit. When inter-harmonics combine with the fundamental voltage, modulations of the power system voltage may interact with other equipment. Light flicker is probably the most common interaction problem. Many utilities have dealt with electric arc furnaces as a large-scale cause of flickering lights. Induction melting can also cause annoying lamp flicker. However, the mechanism is related to voltage fluctuations resulting from inter-harmonic currents rather than from arcing currents. Figure 8 shows the fundamental 60-Hz voltage with amplitude modulation of approximately 6 Hz, resulting from a 186 Hz inter-harmonic. This voltage causes a strong light flicker in most lamps. The interaction level depends on the relative size of the furnace, its operating frequency, and loading. Also, the effect might be aggravated by resonance in the system, which causes amplification of the inter-harmonic frequencies at certain points in the power system. New IEEE/
IEC standards in flicker prediction, measurement, and assessment can be a big help in dealing with light flicker caused by the operation of induction furnaces (see “Standards for Assessment of Voltage Fluctuations and Lamp Flicker”).
Solutions to Induction Furnace Power Quality Problems When an induction furnace is causing power quality problems, other customers are often involved. Both end user and power provider want to consider all practical solutions. Tools for avoiding and resolving typical problems include measurement and assessment methods, application of standards, changes in the furnace or utility power supply, special operating procedures, and power conditioning. Pre-installation planning and post-installation problem-solving for a
Figure 8. System Voltage Modulated by 186-Hz Components
Inter-Harmonics in Power Systems Inter-harmonic is a relatively new classification of power system distortion. Its effect on the power system is unique, as are the methods for measuring inter-harmonics and mitigating its effects. Inter-harmonics can be thought of as voltage or current components that are not related to fundamental frequency or to integer-harmonic components of the system. As furnace power supplies become more sophisticated, the frequencies of the current they draw are less likely to be limited to harmonics of the fundamental. The equipment that causes inter-harmonics includes induction furnaces, static-frequency converters, cycloconverters, induction motors that drive shakers, and DC arc furnaces. Generally, any equipment that draws a load current that pulsates asynchronously with the fundamental power system frequency generates inter-harmonics. In the case of induction melting, the variable frequency of the furnace is likely to cause interharmonics in the power system. The typical impacts on other equipment are flickering lights or computer screens, tripping of certain power electronic equipment, and heating in the power system similar to the heating caused by harmonic currents. Standards are still emerging on this subject. IEEE 519-1992 indirectly addresses interharmonics in the discussion on cycloconverters. A future IEEE standard is expected to provide general technical descriptions of the phenomenon, methods of measurement, and guidelines for limits.The IEC 61000-2-1 currently defines the inter-harmonic environment, and IEC 61000-4-7 describes a measurement technique. Even with these standards, agreement among popular harmonic monitors does not exist. If a monitor can detect inter-harmonics, the most common result is an under-registration of the inter-harmonic levels.
5
demand distortion (TDD) and individual harmonic distortion. In most practical cases, these individual harmonic limits are the most restrictive.
specific foundry case will demonstrate options for preventing and resolving power quality problems.
Pre-installation planning usually starts with an assessment of the For example, assuming there relative size of the end user are no power-factorcompared to the utility power correction capacitor banks at source. Consider the installation of the foundry, all the harmonic a 2-MW furnace in a foundry on a currents from the furnace are 12-kV distribution feeder. Concerns likely to flow into the utility are harmonic generation, light distribution system. At the flicker, and interaction with other equipment at the foundry. The first point of common coupling (PCC), given a short circuit step is to establish a point of ratio of 25.8, the total common coupling and calculate a demand distortion limit in short-circuit ratio (SCR) of available Figure 9. Induction Furnace Point of Common Coupling Showing Relative Size with Power System IEEE 519 is 8%, and the short-circuit power (SSC) divided (Max. DemandAVE =3.1 MVA, SCR = 80/3.1 = 25.8) individual single harmonic by average maximum demand limit will depend on the power. Figure 9 illustrates this rectifier type. With this information, calculation for a foundry that has an SCR for both end-user current and powerthe following procedure can be used to of 25.8 at the point of common coupling supplier voltage. The current limits determine the maximum furnace size at with the distribution system. depend on the relative size of the plant the location: or its SCR. Current limits in 519 are Options to Control Furnace calibrated for the harmonic spectrum of 1. Identify the harmonic spectrum of the Harmonics and Power Factor a six-pulse-rectifier. These current limits particular furnace to be connected. will relax if the rectifier is a higher pulse This will depend primarily on the IEEE Standard 519 provides number. Limits are given for both total furnace rectifier type and the supply recommended harmonic distortion limits Standards for Assessing Voltage Fluctuations and Lamp Flicker Annoying lamp flicker can occur when rapid changes in load current cause the power system voltage to fluctuate. Both incandescent and fluorescent lamps can flicker during voltage fluctuations.The standards for measuring and limiting lamp flicker are based on the 60-W incandescent lamp. Assessing whether or not voltage fluctuations might result in observable flicker can be done using a flickermeter calibrated for a typical lamp and human eye-brain response. The best methods for this measurement were developed in Europe for 230-V incandescent lamps and are contained in standards published by the International Electrotechnical Commission (IEC). These standards were recently adapted for 120-V lamps used in North America. In 1999, the Institute of Electrical and Electronics Engineers (IEEE) accepted the IEC method and will publish it as IEEE Standard 1354. As shown in the figure, the flicker thresholds in this new standard are similar to flicker curves based on the early General Electric studies conducted in the US in the 1920s. The difference between the new standard and the IEEE flicker curves is that a measurement method is also specified in the new standard.
6
In the IEC method, the threshold of irritation is defined as Pst=1, based on 60-W incandescent lamps and a short-term (10-minute) measurement period. For a long-term (two-hour) measurement period, a Plt is defined as the cube root of 12 successive Pst measurements averaged. The allowed percent of voltage change for Pst = 1 varies with the frequency of voltage fluctuations. For example, at 120 changes per minute (two changes per second), the IEC curve indicates that irritating flicker will result from voltage fluctuations that are about 0.8 percent or more of the nominal voltage. At that same frequency, the original IEEE curves give a similar result of about 0.7 percent. Because IEEE had no standard way to measure flicker, the IEC flicker standards have been adopted. Three IEC standards may help in resolving a flicker dispute. Limits on voltage fluctuation for equipment greater than 16 amps are provided in IEC 61000-3-5. Methods for assessing fluctuating loads at medium and high voltage are covered in IEC 61000-3-7. Flicker measurement is specified in IEC 61000-4-15. The same measurement method is now also included in IEEE Standard 1354.
strength. The furnace manufacturer should have a good estimate. For this example, use the spectrum given in Table 3. 2. Determine the IEEE 519 individual harmonic distortion limit that will apply to this furnace configuration. For a basic six-pulse rectifier, the 5th is the largest individual harmonic, and the IEEE limit for the 5th is 7%. When multi-bridge furnace rectifiers such as 12- or 24-pulse are used, the largest single harmonic will change from the 5th to 11th and 23rd. In these cases, the limits in IEEE 519 need to be multiplied by the square root of the pulse number and then divided by 6. For example, if the rectifier is 12-pulse, then the limiting harmonic is the 11th and the IEEE limit for an SCR of 25.8 is 3.5% times √12/6 or √2. So the limit 11th is 3.5% x 1.41 = 4.9%. 3. Compare estimated percent distortion with the IEEE allowed distortion percent for the limiting individual harmonic. The relative size of the furnace allowed is a simple ratio of the allowed percent distortion divided by the expected percent. Assuming an ideal square wave, where the 5th is 1/N or 20%, the maximum furnace size from Table 3 is 0.07/0.2 or 35%. In the more practical case, the 5th is expected to be 17.5% and the maximum furnace size is 0.07/0.175 or 40% of 3.1 MW.
This method demonstrates that for practical cases, the allowed furnace size increases as the pulse number of the power supply increases. Figure 10 illustrates the IEEE 519 recommended limit for the relative size of the furnace based on individual harmonic levels from Table 3. Another rule of thumb sometimes used is that furnaces greater than 2 MW should be 12-pulse, and furnaces greater than 10 MW should be 24-pulse. Sometimes the actual furnace harmonics are higher than predicted because of insufficient series reactance, unbalance loading, or resonance with other power system filters and equipment. When IEEE limits are violated, some form of seriesbalancing reactor or parallel-tuned filter may be required. Consult the furnace manufacturer to determine if changes to the furnace are practical. If harmonic frequencies are changing during furnace operation, an on-site filter may be very difficult to apply. In nearly every case, a study is needed to select the best solution for the application. Options to Control FurnaceRelated Light Flicker Predicting Flicker Complaints The first step in assessing furnace-related light flicker is to monitor furnace operation and voltage fluctuations simultaneously. Flickermeters calibrated for 120-V lamps are available. Measurements can be quite effective in predicting flicker complaints,
even when voltage fluctuations are caused by inter-harmonics. By comparing the flicker levels with the furnace operating mode, useful correlations may be obtained. When attempting to reduce flicker levels, the meter will provide quick feedback following changes in the power system configuration, the furnace operation, or the PCC. Measurements before and after furnace installation are usually helpful in diagnosing and correcting flicker problems. Several standard assessment methods are available for use prior to furnace installation. Use a short-circuit ratio test for initial screening where flicker problems are not expected. This assessment is simply based on the ratio of the power change, ∆S, divided by the available short circuit power, SSC, at the PCC. The limits to be applied for “automatic acceptance” of the fluctuating furnace load also depend on frequency of load changes, Cf, as shown in Table 5. Note that this simple method is not effective in cases where either ∆S or Cf are not predictable. Inter-harmonics introduced into the power system from the furnace resonant circuit may be one of these unpredictable cases. Table 5. Maximum Permissible Load Changes (Adapted from IEC 61000-3-7)
Cf (Changes/Minute)
∆S/SSC (%)
>200
0.1
10 to 200
0.2
<10
0.4
If the voltage waveform at the PCC can be described in a digital waveform, then a standard flickermeter simulation will give the expected Pst. When the general shape of the voltage fluctuation is known, IEC 61000-3-3 provides shape-factor charts to predict flicker levels after installation. In the simple case of rectangular voltage variations, with a known and a fixed frequency, the traditional flicker curve can be used to predict complaints. Table 6 summarizes available assessment methods.
Figure 10. Limits on Furnace Size as a Percent of Plant Load for Ideal and Practical Conditions
Existing Flicker Problems When the installed furnace is already causing flicker complaints, the most likely source is inter-harmonics. Experience has shown that the current-fed converter, without sufficient filtering, promotes the 7
Table 6. Methods for Predicting Load-Related Flicker Complaints (Pst or Plt)
Type of Voltage Change Data
Assessment Method
Standard Reference
Actual Load Operating
Flickermeter
IEEE 1354, IEC 61000-4-1
Predicted kVA Change
Short-Circuit Ratio Test
IEC 61000-3-7
Digitized Waveforms of Change
Flickermeter Simulation
IEC 61000-4-15
Typical Shape of Voltage Change
Standard IEC “Shape Factors”
IEC 61000-3-3
Rectangular Change, Fixed Rate
Traditional Flicker Curve (Pst=1)
IEEE 1354, IEC 61000-3-3
incandescent. Some fluorescents, particularly compacts, and low-wattage or dimmed incandescent lamps are very prone to flicker. Also some people are more sensitive to light changes than average. In these cases, correction at point of complaint, such as changing the lamps or adding a fast voltage regulator, may be cost-effective.
Acknowledgments
interaction of furnace and power-line frequencies to cause voltage fluctuations. Adding series inductance inside the furnace power supply at the DC link or adding parallel capacitance on the power line may reduce the flicker. The inductors will also reduce the propagation of notching. However, side effects such as reduced voltage at the furnace and overvoltage at the plant bus must also be considered. Flagging specific troublesome operating levels or frequencies and controlling the furnace to avoid these operating points can be an effective way to mitigate inter-harmonic interactions. Less desirable measures include restricting operation to only certain hours during the day, increasing the service capacity, or requiring reconfiguration of the distribution feeder to reduce interactions. In some cases, a Pst level close to unity may still result in isolated flicker complaints. Most likely these flickering lamps are more affected by voltage fluctuations than the standard 60-W
Photograph courtesy of Inductotherm Corp. Applicable SIC Codes: 332, 334, 336, and 339
Topics for Future Investigation Active control of the furnace frequency and power to avoid adverse interactions with the utility may be effective in maintaining a compatible interface between furnaces and utility service. The impact of utility voltage sags, momentary interruptions, and switching transients is gaining importance as furnaces become more sophisticated with sensitive process controls. Improved inter-harmonic measurement and elimination methods are needed as more melting is carried out by induction.
To order additional copies of this publication call 800.313.3774 or e-mail [email protected].
Dr. Oleg Fishman of Inductotherm Corp., and Nicolas Cignetti, private consultant, provided reference materials and valuable technical input.
Other Resources € TechCommentary Induction Melting, CMP-72, 11/91 • CMP TechApplications – Induction Melting for a Competitive Advantage, CMP-048, 2/90 – Induction Melting for Higher Productivity, CMP-1188-018 – Induction Melting for Business Building, CMP-1289-020 – Induction Melting for Pollution Elimination, CMP-1289-010 – Induction Melting for Operating Flexibility, CMP-1289-021
© 1999 Electric Power Research Institute (EPRI), Inc. All rights reserved. Electric Power Research Institute and EPRI are registered service marks of the Electric Power Research Institute, Inc. EPRI. POWERING PROGRESS is a service mark of the Electric Power Research Institute, Inc. Printed on recycled paper in the United States of America.
TC-114625 EPRI Center for Materials Production • 1251 Dublin Road • Columbus, OH 43215 614.225.2590 • [email protected] EPRI Corporate address • 3412 Hillview Avenue, Palo Alto, CA 94304 • PO Box 10412, Palo Alto, CA 94303 USA 800.313.3774 • 650.855.2121 • [email protected] • www.epri.com 8
compete because of control and efficiency limitations. Highfrequency systems, which operate at greater than 3 kHz, are relatively small and limited to special applications.
Despite the appeal of the medium-frequency induction furnace, the same advances that make it so effective also engender problems with the power interface. For example, consider harmonic distortion. Today, the most efficient furnaces run at full power and vary the frequency to optimize Figure 1. Modern variable-frequency induction enables the melt. The furnace generates efficient batch-melting processes. The furnace is poured fixed- and variable-frequency empty after each melt, and successive melts are started using harmonics that may lead to unheated or preheated metal. Because there is no need to adverse interactions between the maintain a molten heel, smaller furnaces can be used, Since the 1970s, induction has furnace and the utility system. electrical energy goes further, alloy changes are easier, and loading safety is enhanced. Induction batch melting has This is particularly true of the been the number one method brought about meaningful increases in both the efficiency popular high-power-density of melting in non-ferrous and productivity of the modern melt shop. coreless-induction furnaces, metal foundries and an which typically operate as a important tool in iron foundries. New technology is improving relatively large load at distribution-level intended to help both furnace users and induction power supplies, furnace voltage. their energy providers better anticipate refractory linings, heat recovery, and and resolve power quality problems related overall system control. In the last ten to induction melting. The Furnace Circuit years, the use of induction melting has Electrically, an induction-melt furnace is increased by as much as 20% per year, Electrical Characteristics of simply a loosely coupled transformer. As making it the fastest growing electric Induction Furnaces shown in Figure 2, current in the power technology in metals production. Over coil surrounding a ceramic crucible The growth in use of induction melting time, induction may even surpass generates a magnetic field. Laminated iron has come about primarily because of conventional use of electric arc furnaces significant technology in both tons of production and kilowattadvances in the furnace hours of energy use. power supply and its resonant circuit. This growth Only a fraction the size of an electric arc is primarily in mediumfurnace, the induction-melt furnace may frequency systems, sized from still cause power quality problems in the 0.2 to 16 MW and operating electric utility system. Power quality at frequencies from 150 to problems are more likely when an 3000 Hz. These mediuminduction-melt furnace is connected at frequency furnaces have distribution-level voltages, where the proven to be versatile and furnace current is relatively large efficient at a relatively large compared to the utility supply. In a few scale. The older lowcases, new installations of mediumfrequency models, which frequency induction-melt furnaces have connect directly to the lead to difficult-to-resolve power interface Figure 2. Components of a Large Induction-Melt Furnace 60-Hz utility source, cannot problems. This TechCommentary is
forms a magnetic yoke that also surrounds the crucible. The crucible helps to distribute and contain the field, which induces current in the conductive metal to be melted. The current that penetrates the metal is controlled to ensure proper stirring of the metal and prevent overstirring. A concentrated current on the outer layer of metal to be melted generates the melting power as it quickly heats to the melting point. The refractory lining and cooling jacket separate the hot metal from the furnace power coil. The power supply of an induction-melt furnace provides both the power and control required to properly melt metal. Early induction melting was carried out at line frequency, with power provided by a special transformer and tuning circuits. Switching capacitors provided powerfactor adjustment, and changing transformer taps regulated the power level. For maximum melting power, the resonant frequency of a tuned LC circuit had to be matched to the line frequency. This condition limited the coil current and therefore the efficiency of the furnace because the 60-Hz line frequency results in relatively high penetration into the melt and excessive stirring. Also, early induction-melt furnaces were single-phase loads, which draw heavily from only one phase of a three-phase system and limit the power available from the utility service. The advent of large-scale solid-state power supplies has greatly improved induction melting. Three-phase converters, can be operated at a high power factor, thereby increasing the practical power ratings in a typical application. These power supplies also precisely control frequency and the depth of penetration to efficiently melt the material without over-stirring. The process is more efficient because the variablefrequency power supplies are able to match the varying electrical characteristics of different metals during melting. The electronic power supply that is used on the modern furnace has opened the way for batch operation by eliminating the need to maintain a molten heel. Figure 3 shows a typical furnace and its electronic power supply. To achieve an efficient and fast melt, more power per unit weight of the metal being melted is desired. Typical power densities in the medium-frequency furnace range 2
Figure 3. Typical Electronic Power Supply and Medium-Frequency Induction-Melt Furnace
from 600 to 1000 kW per ton, compared to 200 to 400 kW per ton in the linefrequency furnace. Electric arc furnaces also operate at high power densities. However, the arc melting temperatures are significantly higher than induction melting-in the neighborhood of 6000°F (3300°C), compared to 2600°F (1400°) for induction-melt furnaces. The higher temperature in an electric arc furnace enables the melting of somewhat dirtier metal but also leads to a few percent higher losses of metal to ionization and creation of ash. Figure 4 illustrates recorded electrical parameters of an actual medium-frequency furnace during a typical batch cycle. 1. Metal is loaded into the furnace using a heavy duty conveyor. The melting process forms a molten bath in the bottom of the ceramic crucible. In this case loading continues until the crucible is filled with 10 tons (9 Mg) of molten metal, at about 2600°F (1400°C).
2. After all of the metal has melted, the batch is superheated to the desired tap temperature of about 2800°F (1500°C). 3. Then, the power is removed so that the molten metal can be poured into a ladle. Depending on the relative size and configuration, furnace operation can affect power quality at the point of common coupling (PCC) or at the interface with the public power supply. Many different electronic power supply configurations are available. The choice of configuration will have a big impact on both furnace performance and electrical compatibility. The following is a summary of practical power supply options that may help to avoid costly corrective actions or operating curtailments when they are considered before furnace installation. The Electronic Power Supply Circuit Electronic power supplies control current and frequency for efficient induction melting. Most electronic power supplies
Figure 4. Electrical Parameters During a Typical Batch Cycle for a 6-MW, 2400-Volt Furnace (scrap iron loaded at 10 tons/hour (9 Mg/h); power supply running at 200 to 275 Hz, 36,000 Amps)
rectify the AC line current to provide a DC source of energy. This DC is then inverted at a frequency to obtain the desired induction from the furnace resonant circuit. The two main types of solid-state power supplies are the currentfed power supply (parallel furnace resonant circuit) and the voltage-fed power supply (series furnace resonant circuit), both of which are used in mediumfrequency induction melting systems. These different power supply designs have different impacts on the furnace performance, as indicated in Table 1. Voltage-Fed Power Supplies The voltage-fed power supply, which is the newer of the two designs, takes advantage of switching technology that is capable of handling high currents. As shown in Figure 5, it employs a simple input diode rectifier to produce DC, and a parallelconnected DC capacitor for energy storage and filtering. The output inverter controls melting power by its commutation frequency and can fully regulate the current to the series tuning capacitor and the furnace. Consequently, the inverter is exposed to the full current and partial voltage of the furnace. The DC capacitor provides or absorbs excess energy for starting and stopping the inverter. Current-Fed Power Supplies As shown in Figure 6, the basic current-fed converter uses a phase-controlled rectifier to convert AC to DC and to regulate the voltage on the DC link. When current is flowing in the DC link, the two seriesconnected inductors provide energy storage and filtering. Consequently, a starter circuit is needed to energize these inductors, and a crowbar circuit is used to discharge them when the melt is complete. The inverter commutates or reverses the current to obtain the desired output frequency, which, along with varying the rectifier output voltage, controls the melting power. Current-fed designs have been around longer and take advantage of rugged and economical switching-device technology. The inverter is exposed to the full furnace voltage. However, it only sees about 10% of the furnace resonant current because the reactive component of the furnace current bypasses the inverter via the parallel tuning capacitor. Consequently, the current-fed power supply has less control over the
Table 1. Performance and Interface Comparisons for Medium-Frequency Melt Furnaces
Characteristics
Current-Fed Inverter
Voltage-Fed Inverter
Poor
Excellent
70-80%
75-85%
Power-Line Interface
Phase-Controlled Rectifier
Diode Rectifier
DC-Energy Storage
Inductive, Dynamic
Capacitive, Static
Controllability of Melt Efficiency of Melt
Figure 5. Voltage-Fed Power Supply Driving a Series-Resonant Furnace Circuit
Figure 6. Current-Fed Power Supply Driving a Parallel-Resonant Furnace Circuit
furnace current than the voltage-fed power supply. One side effect of using a phase-controlled rectifier in the current-fed power supply is voltage notching. The line voltage is notched because a momentary line-to-line fault occurs as each phase rectifier device is turned on before the other phase device has commutated off. Depth of the notch depends on the circuit impedance between
furnace transformer and the rectifier. Width depends on the timing between turn-on and turn-off. Notches are more severe near the converter, as illustrated in the voltage waveform shown in Figure 6. Notching can cause equipment operating problems when propagated in a plant electrical system. The most common problem caused by notching is tripping of other power supplies and DC drives. 3
Common Power Quality Concerns About Induction Furnaces
Table 2. Power Quality Comparisons (Single-Rectifier-Bridge Configuration)
Characteristics
Current-Fed Inverter
Voltage-Fed Inverter
Sometimes thought to be a panacea for the Line-Voltage Notching Yes (Caused by Phase Control) No induction melting process, modern solidstate power supplies have actually been a Harmonic Generation High Moderate mixed blessing for achieving compatibility System Power Factor 0.7-0.95 (Depends on Phase Control) 0.95 with the electric utility system. Large three-phase power supplies for furnaces, Generates Inter-Harmonics Yes (Depends on Furnace Frequency) No while providing economies of scale with higher productions levels, also bring large fluctuating load currents with varying levels of harmonic Table 3. Ideal Square Wave and Practical Harmonic Spectrum for Furnace Rectifiers distortion. These varying furnace currents can affect Rectifier Individual Harmonic Order and Levels (% of Fundamental) distribution line-voltage regulation and quality. Harmonic➝ 5th 7th 11th 13th 17th 19th 23rd 25th Total Table 2 provides a summary 6-Pulse (I) 20 14.3 9.1 7.7 5.9 0.5 4.3 4.0 29% and comparison of power quality concerns for both the 6-Pulse (P) 17.5 11.0 4.5 2.9 1.5 1 0.9 0.8 21.5% current- and the voltage-fed 12-Pulse (I) 0 0 9.1 7.7 0 0 4.3 4.0 15.5% power supply. 12-Pulse (P) 2.6 1.6 7.9 5.5 0.2 0.1 2.3 0.8 10.4% Generation of Current 24-Pulse (I) 0 0 0 0 0 0 4.3 4.0 5.9% Harmonics 24-Pulse (P) 2.6 1.6 0.7 0.4 0.2 0.1 1.9 0.8 3.8% Both current- and voltage-fed inverters generate harmonics I = Ideal Square Wave back into power lines in the P = Practical Case process of rectifying AC to DC. In the larger furnaces, it is popular to provide more than one due to unbalances, other harmonics are Power Factor of Furnace and rectifier bridge, along with phase-shifting present in practical applications, as shown Power Supply transformers. This reduces the amount in Table 3. Even so, the total harmonics in The term “power factor” is well defined of current per bridge and the level of most practical applications are moderately for 60-Hz systems as the phase difference harmonics in the combined current drawn less than theory predicts for ideal squarebetween the fundamental current and from the utility. Each three-phase bridge stepped waveforms where each individual voltage. In the presence of harmonics, requires six devices, and one positive and harmonic (N) is 1/N of the fundamental. power factor is best defined one negative pole for each as the ratio of the watts phase. A single bridge, such as over the total kVA for all shown in Figures 5 and 6, is frequencies. Distorted called a six-pulse rectifier, two systems have limited power bridges a 12-pulse, as shown in factors even when the Figure 7, and so on. fundamental voltage and Increasing the number of current are in phase. For rectifier bridges adds more example, when the current steps in the waveform of the line is 21.5% distorted, as with current, making it more the practical case of a sinusoidal. The harmonics six-pulse rectifier, the produced by 6-, 12-, and maximum power factor is 24-pulse rectifiers are shown 0.98 instead of 1.0. At 60% in Table 3. Assuming and ideal distortion, the maximum square wave, a rectifier should power factor is about 0.86. only have harmonics that are an The expected power factors integer multiple of the number for 6-, 12-, and 24-pulse of pulses ±1. For example, in a bridge rectifiers in full-wave 12-pulse rectifier, the harmonic rectification mode are components should be 11, 13, Figure 7. Typical 12-Pulse Bridge Rectifier Configuration with Phaserelatively high, as shown in Shifting Transformers 23, 25, and so on. However, 4
Table 4. The greater the number of pulses the greater the expected power factor. Compared to the full-wave rectifier in voltage-fed power supplies, the phasecontrolled rectifier in current-fed power supplies uses a delay in turning on switches to control power levels and to regulate the DC bus voltage. It should be noted that the power level and power factor in a phase-controlled rectifier drops rapidly with the increase of delay angle. At a delay angle of 30°, the maximum is 0.95, at 90° it is less than 0.7, and at 120° it drops to 0.46. Therefore, if the power supply is current-fed, low power factors can be expected when the power supply reduces power to the furnace. Table 4. Expected Power Factor for Full-Wave Rectifiers
Number of Pulses
Power Factor
6
0.955
12
0.988
24
0.997
Voltage Fluctuations Caused by the Furnace Circuit In addition to the harmonics that are normally expected from different pulse rectifiers large furnaces operating at a few hundred hertz can generate significant non-characteristic harmonics. These harmonics, which fluctuate with the frequency of the furnace resonant circuit, are usually not multiples of the supply frequency, making them difficult to filter. This phenomenon, known as interharmonics, can overload power system capacitors, introduce noise into transformers, cause lights to flicker, instigate UPS alarms, and trip adjustablespeed drives (see “Inter-Harmonics in Power Systems”). The typical scenario for the generation of inter-harmonics is a relatively large furnace with a current-fed power supply operating between 100 and 500 Hz on a distribution feeder. When the power supply inverter is operating at frequency f0, the frequency reflected back to the rectifier is two times f0. This frequency combines with the line frequency (60 Hz), resulting in line currents containing harmonics of two times f0 ±60, 4f0 ±60,
and so on. For example, a 12-pulse rectifier feeding a furnace operating at 123 Hz may have inter-harmonics at 186 and 306 Hz, 432 and 552 Hz, and so on. These frequencies are not characteristic of the 12-pulse rectifier and are fed back into the power system from the current of the furnace’s resonant circuit. When inter-harmonics combine with the fundamental voltage, modulations of the power system voltage may interact with other equipment. Light flicker is probably the most common interaction problem. Many utilities have dealt with electric arc furnaces as a large-scale cause of flickering lights. Induction melting can also cause annoying lamp flicker. However, the mechanism is related to voltage fluctuations resulting from inter-harmonic currents rather than from arcing currents. Figure 8 shows the fundamental 60-Hz voltage with amplitude modulation of approximately 6 Hz, resulting from a 186 Hz inter-harmonic. This voltage causes a strong light flicker in most lamps. The interaction level depends on the relative size of the furnace, its operating frequency, and loading. Also, the effect might be aggravated by resonance in the system, which causes amplification of the inter-harmonic frequencies at certain points in the power system. New IEEE/
IEC standards in flicker prediction, measurement, and assessment can be a big help in dealing with light flicker caused by the operation of induction furnaces (see “Standards for Assessment of Voltage Fluctuations and Lamp Flicker”).
Solutions to Induction Furnace Power Quality Problems When an induction furnace is causing power quality problems, other customers are often involved. Both end user and power provider want to consider all practical solutions. Tools for avoiding and resolving typical problems include measurement and assessment methods, application of standards, changes in the furnace or utility power supply, special operating procedures, and power conditioning. Pre-installation planning and post-installation problem-solving for a
Figure 8. System Voltage Modulated by 186-Hz Components
Inter-Harmonics in Power Systems Inter-harmonic is a relatively new classification of power system distortion. Its effect on the power system is unique, as are the methods for measuring inter-harmonics and mitigating its effects. Inter-harmonics can be thought of as voltage or current components that are not related to fundamental frequency or to integer-harmonic components of the system. As furnace power supplies become more sophisticated, the frequencies of the current they draw are less likely to be limited to harmonics of the fundamental. The equipment that causes inter-harmonics includes induction furnaces, static-frequency converters, cycloconverters, induction motors that drive shakers, and DC arc furnaces. Generally, any equipment that draws a load current that pulsates asynchronously with the fundamental power system frequency generates inter-harmonics. In the case of induction melting, the variable frequency of the furnace is likely to cause interharmonics in the power system. The typical impacts on other equipment are flickering lights or computer screens, tripping of certain power electronic equipment, and heating in the power system similar to the heating caused by harmonic currents. Standards are still emerging on this subject. IEEE 519-1992 indirectly addresses interharmonics in the discussion on cycloconverters. A future IEEE standard is expected to provide general technical descriptions of the phenomenon, methods of measurement, and guidelines for limits.The IEC 61000-2-1 currently defines the inter-harmonic environment, and IEC 61000-4-7 describes a measurement technique. Even with these standards, agreement among popular harmonic monitors does not exist. If a monitor can detect inter-harmonics, the most common result is an under-registration of the inter-harmonic levels.
5
demand distortion (TDD) and individual harmonic distortion. In most practical cases, these individual harmonic limits are the most restrictive.
specific foundry case will demonstrate options for preventing and resolving power quality problems.
Pre-installation planning usually starts with an assessment of the For example, assuming there relative size of the end user are no power-factorcompared to the utility power correction capacitor banks at source. Consider the installation of the foundry, all the harmonic a 2-MW furnace in a foundry on a currents from the furnace are 12-kV distribution feeder. Concerns likely to flow into the utility are harmonic generation, light distribution system. At the flicker, and interaction with other equipment at the foundry. The first point of common coupling (PCC), given a short circuit step is to establish a point of ratio of 25.8, the total common coupling and calculate a demand distortion limit in short-circuit ratio (SCR) of available Figure 9. Induction Furnace Point of Common Coupling Showing Relative Size with Power System IEEE 519 is 8%, and the short-circuit power (SSC) divided (Max. DemandAVE =3.1 MVA, SCR = 80/3.1 = 25.8) individual single harmonic by average maximum demand limit will depend on the power. Figure 9 illustrates this rectifier type. With this information, calculation for a foundry that has an SCR for both end-user current and powerthe following procedure can be used to of 25.8 at the point of common coupling supplier voltage. The current limits determine the maximum furnace size at with the distribution system. depend on the relative size of the plant the location: or its SCR. Current limits in 519 are Options to Control Furnace calibrated for the harmonic spectrum of 1. Identify the harmonic spectrum of the Harmonics and Power Factor a six-pulse-rectifier. These current limits particular furnace to be connected. will relax if the rectifier is a higher pulse This will depend primarily on the IEEE Standard 519 provides number. Limits are given for both total furnace rectifier type and the supply recommended harmonic distortion limits Standards for Assessing Voltage Fluctuations and Lamp Flicker Annoying lamp flicker can occur when rapid changes in load current cause the power system voltage to fluctuate. Both incandescent and fluorescent lamps can flicker during voltage fluctuations.The standards for measuring and limiting lamp flicker are based on the 60-W incandescent lamp. Assessing whether or not voltage fluctuations might result in observable flicker can be done using a flickermeter calibrated for a typical lamp and human eye-brain response. The best methods for this measurement were developed in Europe for 230-V incandescent lamps and are contained in standards published by the International Electrotechnical Commission (IEC). These standards were recently adapted for 120-V lamps used in North America. In 1999, the Institute of Electrical and Electronics Engineers (IEEE) accepted the IEC method and will publish it as IEEE Standard 1354. As shown in the figure, the flicker thresholds in this new standard are similar to flicker curves based on the early General Electric studies conducted in the US in the 1920s. The difference between the new standard and the IEEE flicker curves is that a measurement method is also specified in the new standard.
6
In the IEC method, the threshold of irritation is defined as Pst=1, based on 60-W incandescent lamps and a short-term (10-minute) measurement period. For a long-term (two-hour) measurement period, a Plt is defined as the cube root of 12 successive Pst measurements averaged. The allowed percent of voltage change for Pst = 1 varies with the frequency of voltage fluctuations. For example, at 120 changes per minute (two changes per second), the IEC curve indicates that irritating flicker will result from voltage fluctuations that are about 0.8 percent or more of the nominal voltage. At that same frequency, the original IEEE curves give a similar result of about 0.7 percent. Because IEEE had no standard way to measure flicker, the IEC flicker standards have been adopted. Three IEC standards may help in resolving a flicker dispute. Limits on voltage fluctuation for equipment greater than 16 amps are provided in IEC 61000-3-5. Methods for assessing fluctuating loads at medium and high voltage are covered in IEC 61000-3-7. Flicker measurement is specified in IEC 61000-4-15. The same measurement method is now also included in IEEE Standard 1354.
strength. The furnace manufacturer should have a good estimate. For this example, use the spectrum given in Table 3. 2. Determine the IEEE 519 individual harmonic distortion limit that will apply to this furnace configuration. For a basic six-pulse rectifier, the 5th is the largest individual harmonic, and the IEEE limit for the 5th is 7%. When multi-bridge furnace rectifiers such as 12- or 24-pulse are used, the largest single harmonic will change from the 5th to 11th and 23rd. In these cases, the limits in IEEE 519 need to be multiplied by the square root of the pulse number and then divided by 6. For example, if the rectifier is 12-pulse, then the limiting harmonic is the 11th and the IEEE limit for an SCR of 25.8 is 3.5% times √12/6 or √2. So the limit 11th is 3.5% x 1.41 = 4.9%. 3. Compare estimated percent distortion with the IEEE allowed distortion percent for the limiting individual harmonic. The relative size of the furnace allowed is a simple ratio of the allowed percent distortion divided by the expected percent. Assuming an ideal square wave, where the 5th is 1/N or 20%, the maximum furnace size from Table 3 is 0.07/0.2 or 35%. In the more practical case, the 5th is expected to be 17.5% and the maximum furnace size is 0.07/0.175 or 40% of 3.1 MW.
This method demonstrates that for practical cases, the allowed furnace size increases as the pulse number of the power supply increases. Figure 10 illustrates the IEEE 519 recommended limit for the relative size of the furnace based on individual harmonic levels from Table 3. Another rule of thumb sometimes used is that furnaces greater than 2 MW should be 12-pulse, and furnaces greater than 10 MW should be 24-pulse. Sometimes the actual furnace harmonics are higher than predicted because of insufficient series reactance, unbalance loading, or resonance with other power system filters and equipment. When IEEE limits are violated, some form of seriesbalancing reactor or parallel-tuned filter may be required. Consult the furnace manufacturer to determine if changes to the furnace are practical. If harmonic frequencies are changing during furnace operation, an on-site filter may be very difficult to apply. In nearly every case, a study is needed to select the best solution for the application. Options to Control FurnaceRelated Light Flicker Predicting Flicker Complaints The first step in assessing furnace-related light flicker is to monitor furnace operation and voltage fluctuations simultaneously. Flickermeters calibrated for 120-V lamps are available. Measurements can be quite effective in predicting flicker complaints,
even when voltage fluctuations are caused by inter-harmonics. By comparing the flicker levels with the furnace operating mode, useful correlations may be obtained. When attempting to reduce flicker levels, the meter will provide quick feedback following changes in the power system configuration, the furnace operation, or the PCC. Measurements before and after furnace installation are usually helpful in diagnosing and correcting flicker problems. Several standard assessment methods are available for use prior to furnace installation. Use a short-circuit ratio test for initial screening where flicker problems are not expected. This assessment is simply based on the ratio of the power change, ∆S, divided by the available short circuit power, SSC, at the PCC. The limits to be applied for “automatic acceptance” of the fluctuating furnace load also depend on frequency of load changes, Cf, as shown in Table 5. Note that this simple method is not effective in cases where either ∆S or Cf are not predictable. Inter-harmonics introduced into the power system from the furnace resonant circuit may be one of these unpredictable cases. Table 5. Maximum Permissible Load Changes (Adapted from IEC 61000-3-7)
Cf (Changes/Minute)
∆S/SSC (%)
>200
0.1
10 to 200
0.2
<10
0.4
If the voltage waveform at the PCC can be described in a digital waveform, then a standard flickermeter simulation will give the expected Pst. When the general shape of the voltage fluctuation is known, IEC 61000-3-3 provides shape-factor charts to predict flicker levels after installation. In the simple case of rectangular voltage variations, with a known and a fixed frequency, the traditional flicker curve can be used to predict complaints. Table 6 summarizes available assessment methods.
Figure 10. Limits on Furnace Size as a Percent of Plant Load for Ideal and Practical Conditions
Existing Flicker Problems When the installed furnace is already causing flicker complaints, the most likely source is inter-harmonics. Experience has shown that the current-fed converter, without sufficient filtering, promotes the 7
Table 6. Methods for Predicting Load-Related Flicker Complaints (Pst or Plt)
Type of Voltage Change Data
Assessment Method
Standard Reference
Actual Load Operating
Flickermeter
IEEE 1354, IEC 61000-4-1
Predicted kVA Change
Short-Circuit Ratio Test
IEC 61000-3-7
Digitized Waveforms of Change
Flickermeter Simulation
IEC 61000-4-15
Typical Shape of Voltage Change
Standard IEC “Shape Factors”
IEC 61000-3-3
Rectangular Change, Fixed Rate
Traditional Flicker Curve (Pst=1)
IEEE 1354, IEC 61000-3-3
incandescent. Some fluorescents, particularly compacts, and low-wattage or dimmed incandescent lamps are very prone to flicker. Also some people are more sensitive to light changes than average. In these cases, correction at point of complaint, such as changing the lamps or adding a fast voltage regulator, may be cost-effective.
Acknowledgments
interaction of furnace and power-line frequencies to cause voltage fluctuations. Adding series inductance inside the furnace power supply at the DC link or adding parallel capacitance on the power line may reduce the flicker. The inductors will also reduce the propagation of notching. However, side effects such as reduced voltage at the furnace and overvoltage at the plant bus must also be considered. Flagging specific troublesome operating levels or frequencies and controlling the furnace to avoid these operating points can be an effective way to mitigate inter-harmonic interactions. Less desirable measures include restricting operation to only certain hours during the day, increasing the service capacity, or requiring reconfiguration of the distribution feeder to reduce interactions. In some cases, a Pst level close to unity may still result in isolated flicker complaints. Most likely these flickering lamps are more affected by voltage fluctuations than the standard 60-W
Photograph courtesy of Inductotherm Corp. Applicable SIC Codes: 332, 334, 336, and 339
Topics for Future Investigation Active control of the furnace frequency and power to avoid adverse interactions with the utility may be effective in maintaining a compatible interface between furnaces and utility service. The impact of utility voltage sags, momentary interruptions, and switching transients is gaining importance as furnaces become more sophisticated with sensitive process controls. Improved inter-harmonic measurement and elimination methods are needed as more melting is carried out by induction.
To order additional copies of this publication call 800.313.3774 or e-mail [email protected].
Dr. Oleg Fishman of Inductotherm Corp., and Nicolas Cignetti, private consultant, provided reference materials and valuable technical input.
Other Resources € TechCommentary Induction Melting, CMP-72, 11/91 • CMP TechApplications – Induction Melting for a Competitive Advantage, CMP-048, 2/90 – Induction Melting for Higher Productivity, CMP-1188-018 – Induction Melting for Business Building, CMP-1289-020 – Induction Melting for Pollution Elimination, CMP-1289-010 – Induction Melting for Operating Flexibility, CMP-1289-021
© 1999 Electric Power Research Institute (EPRI), Inc. All rights reserved. Electric Power Research Institute and EPRI are registered service marks of the Electric Power Research Institute, Inc. EPRI. POWERING PROGRESS is a service mark of the Electric Power Research Institute, Inc. Printed on recycled paper in the United States of America.
TC-114625 EPRI Center for Materials Production • 1251 Dublin Road • Columbus, OH 43215 614.225.2590 • [email protected] EPRI Corporate address • 3412 Hillview Avenue, Palo Alto, CA 94304 • PO Box 10412, Palo Alto, CA 94303 USA 800.313.3774 • 650.855.2121 • [email protected] • www.epri.com 8
Related Documents

Pq Inductn Melting Tc114625
January 2021 1
Melting Furnaces
January 2021 1
Melting Practice
January 2021 1
Pq Protocol
January 2021 3
Steel Melting Shop
January 2021 2
Pq For Autoclave_sample
February 2021 1More Documents from "piyusharora1964"
Pq Inductn Melting Tc114625
January 2021 1
07897409en01-04.pdf
January 2021 1
[songbook] - Nirvana - The Bass Collection (bass Tabs).pdf
January 2021 1
La Psicologia Cognitiva - Objeto
January 2021 2
Conclusion De Walter A. Shewhart.docx
February 2021 0