_transformer Service Handbook_version Int_v4 0_rev 3.pdf
This document was uploaded by user and they confirmed that they have the permission to share it. If you are author or own the copyright of this book, please report to us by using this DMCA report form. Report DMCA
Overview
Download & View _transformer Service Handbook_version Int_v4 0_rev 3.pdf as PDF for free.
More details
- Words: 128,460
- Pages: 444
Loading documents preview...
Service Handbook for Transformers
DISCLAIMER OF WARRANTIES AND LIMITATION OF LIABILITY THE INFORMATION, RECOMMENDATIONS, DESCRIPTIONS AND SAFETY NOTIONS IN THIS DOCUMENT ARE BASED ON OUR EXPERIENCE, JUDGEMENT, AND DOCUMENTS IN THE PUBLIC DOMAIN WITH RESPECT TO TRANSFORMERS. THIS INFORMATION SHOULD NOT BE CONSIDERED TO BE ALL INCLUSIVE OR COVERING ALL CONTINGENCIES. IF FURTHER INFORMATION IS REQUIRED, THE TRANSFORMER DIVISION OF ABB INC. SHOULD BE CONSULTED. NO WARRANTIES, EXPRESSED OR IMPLIED, INCLUDING WARRANTIES OF FITNESS FOR A PARTICULAR PURPOSE OR MERCHANTABILITY, OR WARRANTIES ARISING FROM COURSE OF DEALING OR USAGE OF TRADE, ARE MADE REGARDING THE INFORMATION, RECOMMENDATIONS, DESCRIPTIONS, AND SAFETY NOTATIONS CONTAINED HEREIN. IN NO EVENT WILL ABB LTD. BE RESPONSIBLE TO THE USER IN CONTRACT, IN TORT (INCLUDING NEGLIGENCE), STRICT LIABILITY, OR OTHERWISE FOR ANY SPECIAL, INDIRECT, INCIDENTAL, OR CONSEQUENTIAL DAMAGE OR LOSS WHATSOEVER. THIS INCLUDES, BUT IS NOT LIMITED TO, DAMAGE TO OR LOSS OF USE OF EQUIPMENT, PLANT OR POWER SYSTEM, COST OF CAPITAL, LOSS OF PROFITS OR REVENUES, COST OF REPLACEMENT POWER, ADDITIONAL EXPENSES IN THE USE OF EXISTING POWER FACILITIES, OR CLAIMS AGAINST THE USER BY ITS CUSTOMERS RESULTING FROM THE USE OF THE INFORMATION, RECOMMENDATIONS, DESCRIPTIONS, AND SAFETY NOTATIONS CONTAINED HEREIN.
i
ACKNOWLEDGEMENTS This Transformer Service Handbook is meant to provide a general understanding of service as it relates to transformers. Service is a technical product that a transformer needs until the end of its lifetime. These pages provide an introduction to transformer service and maintenance, and are a guide to help increase the value of the product, by protecting and prolonging the asset life for customers and/or owners. The material was compiled and written by ABB experts from our Transformer Business Unit, based on their vast knowledge of transformers and many years of global experience in the field of transformer manufacturing and service. You are holding in your hands the end result of this challenging work – the Service Handbook for Transformers. Leif Carlzon, Group Vice President and Product Group Manager for Transformer Service, Asim Fazlagic, Vice President for Transformer Service North America, Dr. George Frimpong, Transformer Service expert in USA, Pierre Boss, Senior Transformer expert in Switzerland and Pierre Lorin, Technology Manager for Product Group Transformer Service have led the project by compiling, writing and editing the material in this handbook. We also thank the ABB employees and industry partners who supplied valuable input and information, as well as a number of organizations which generously permitted us to use their materials and documentation in the creation of this handbook. Their support and contributions made this project possible. We are convinced that readers will find our Transformer Service Handbook a very useful and comprehensive source of answers to the many questions relating to transformers and a trouble-free product life. At ABB, we don’t just build high quality transformers - we take care of them so they stay that way.
Tarak Mehta Group Senior Vice President Head of Business Unit Transformers Power Product Division Zurich, Switzerland
ii
FOREWORD ABB possesses the technology rights of more than 30 brands including ABB, ACEC, ASEA, Ansaldo, Bonar Long, Breda, BBC, CGE, Challenger, Elektrisk Bureau, Elta, GE (> 40 MVA), GTE, Gould, IEL, ITC, ITE, Indelve, Industrial Design, Italtrafo, Lepper, MFO, Marelli, Moloney Electric, National Industri, Nitran, No-Tra-Mo, Ocren, OEL, OTE, Richard Pfeiffer, Sécheron, Strömberg, TIBB, Thrige, Westinghouse, Zinsco. At some utilities these transformers can account for up to 70-80 % of the utility’s total transformer asset base. With this in mind, we undertook the task of providing for the industry (users of ANSI/IEEE as well as IEC standards) a reference guide with detailed, yet easy to understand, information for the proper care and maintenance of transformers. This information should in no way supersede the maintenance guidelines provided by the transformer manufacturer. The engineering staffs at ABB keep abreast of new information and techniques available for analyzing problems in transformers. In many cases, we are the pioneers of such new ideas. In keeping up with new ideas, we have realized there is a wealth of information on transformers available in the open literature. However, this information is at times found in little known journals, brochures, and books. What we have attempted to do with this handbook is to compile the most useful information into a single document. The goal is that this will serve as the preferred reference manual for all who are involved in the operation and maintenance of transformers. We have melded this information with our many years of experience in designing transformers and providing maintenance and diagnostic guidance to customers. This book can also be used as training material in many universities and schools, to help students gain specific knowledge about transformer service and maintenance. The material presented in this handbook is not meant to provide theoretical insights into the methods used for maintaining transformers. Instead, it is written to help the user gain a better understanding of why certain measurements are recommended, and in some cases, how to interpret the results of these measurements. There are three ABB publications that provide theoretical coverage and discussions on transformers, short circuit strengths as well as the testing of power transformers and shunt reactors (Transformer Handbook, Short circuit duty of Power Transformers and Testing of Power Transformers and Shunt Reactors available from the ABB website: www.abb.com/transformers). The layout of the handbook is as follows. We open with a general description of transformer design to help the user understand the nature of the various components that require maintenance in a transformer. Knowing the condition of a fleet of transformers is important for making informed decisions about any maintenance, repair or replacement activities. Therefore we address the topic of risk assessment/management of transformers. We present ABB’s methodology of risk assessment as applied to populations of transformers with the view of identifying the few that need the attention of asset managers. This provides them the ability to focus on iii
condition based rather than time based maintenance activities. This method has been successfully applied to transformer fleets of many utilities and industrial customers worldwide. The result has been to improve the availability of the fleet as a whole and at the same time optimize the maintenance spending where it has the best impact. This is followed by a general discussion of the various methodologies available for diagnosing potential problems in transformers. The subsequent sections, which constitute the bulk of the material in the handbook, provide detailed descriptions and discussions on the test methods and interpretation of results used to maintain and repair transformers, either in workshops or at site. Finally, we cover the environmental aspects related to transformers and the important topic of economics of transformer asset management. We would like to thank all the authors for their valuable contribution to making such a comprehensive book about using the transformer as a valuable asset for improving Power and Productivity for a Better World™.
Leif Carlzon
Asim Fazlagi
Pierre Lorin
Group Vice President Head of Product Group Service Zurich - Switzerland
Vice President & General Manager ABB TRES North America Saint Louis, Missouri - USA
Product Group Service Head of Technology Geneva - Switzerland
iv
AUTHORS The first international version of this handbook was written in collaboration with ABB employees from several countries. We want to thank them all for this impressive team work. In Brazil Lars Eklund and Dr. Jose Carlos Mendes In China Henry-HongGuang Huang and Fred Samuelsson In Germany Sonia Berhane and Dr. Peter Werle In India Jivraj Sutaria In Ireland Mark Turner In Italy Paolo Capuano In Norway Knut Herdlevar and Arnt-Sigmar Todenes In Spain Miguel-Angel del-Rey, Rafael Santacruz and Nicolas Toribio In Sweden Dr. Dierk Bormann, Dr. Kjell Carrander, Dr. Mats Dahlund, Dr. Uno Gäfvert, Bjorn Holmgren, Lars Jonsson, Peter Labecker, Lena Melzer, Peter Olsson, Dr. Lars Pettersson and Bengt-Olof Stenestam In Switzerland Dr. Jose-Luis Bermudez, Pierre Boss, Cedric Buholzer, Thomas Horst, Paul Koestinger, Pierre Lorin, Jean-François Ravot, Ralf Schneider, Serge Therry, Olivier Uhlmann and Thomas Westman In Thailand Manoch Sangsuvan and Ekkehard Zeitz In Turkey Taner Danisment, Sener Ertuna and Burhan Gundem In United Kingdom Liam Warren In United States of America Wayne Ball, Gary Burden, Dr. Clair Claiborne, Eric Doak, Asim Fazlagi , Dr. George Frimpong, Ed Fry, Dr. Ramsis Girgis, Axel Kalt, Greg Leslie, Dr. T.V. Oommen, Mark Perkins, Eric Pisila, Rich Ronnau, Craig Stiegemeier and Brian Twibell.
v
A special recognition goes to our colleagues who wrote the first ANSI/IEEE version of the handbook used as a base for the international version.
Also we would also like to thank Doble Engineering, IEEE, CIGRE, GE Energy, FLIR Thermograpgy, Megger, Physical Acoustics, Electrical World Magazine, and the various other organizations that allowed the use of their materials in this handbook. Special thanks go to the three general reviewers Pierre Boss, Dr. George Frimpong and Mark Turner
vi
CONTENTS DISCLAIMER OF WARRANTIES AND LIMITATION OF LIABILITY ........................................................ I ACKNOWLEDGEMENTS .......................................................................................................................II FOREWORD..........................................................................................................................................III AUTHORS ..............................................................................................................................................V 1
TRANSFORMER DESIGN CONSIDERATIONS ........................................................................... 17 1.1 CONFIGURATION ..................................................................................................................... 17 1.2 MECHANICAL CONSIDERATION .................................................................................................. 17 1.3 THERMAL CONSIDERATIONS ..................................................................................................... 18 1.4 DIELECTRIC CONSIDERATIONS.................................................................................................. 19 1.5 CONSTRUCTION TYPES ............................................................................................................ 19 1.5.1 Shell Form........................................................................................................................ 19 1.5.1.1 1.5.1.2 1.5.1.3 1.5.1.4
1.5.2
Design Features ................................................................................................................... 19 Mechanical Strength ............................................................................................................. 20 Thermal Capability ................................................................................................................ 22 Dielectric Characteristics........................................................................................................ 24
Core Form ........................................................................................................................ 26
1.5.2.1 1.5.2.2 1.5.2.3 1.5.2.4
Design Features ................................................................................................................... 26 Mechanical Strength ............................................................................................................. 27 Thermal Capability ................................................................................................................ 29 Dielectric Characteristics......................................................................................................... 30
1.6 BUSHINGS ............................................................................................................................. 32 1.6.1 Design and Construction of Capacitances in Condenser Bushings Complying with the IEEE Standards .................................................................................................. 32 1.6.2 Bushings Voltage Tap....................................................................................................... 36 1.6.3 Connections ..................................................................................................................... 38 1.6.3.1 1.6.3.2 1.6.3.3
Internal Electrical Connections ................................................................................................... 38 Draw Lead Connected Bushings................................................................................................ 38 Bottom Connected Bushings ..................................................................................................... 38
1.6.4 Liquid Level Indication ...................................................................................................... 38 1.6.5 Painting ............................................................................................................................ 39 1.7 ON-LOAD TAP CHANGERS ....................................................................................................... 40 1.7.1 Introductions..................................................................................................................... 40 1.7.2 North-American Practices ................................................................................................ 41 1.7.2.1 General Description of LTCs ................................................................................................. 41 1.7.2.2 Reactance Type LTCs........................................................................................................... 41 1.7.2.3 Arcing Control Methods......................................................................................................... 42 1.7.2.3.1 Arcing Tap Switch ............................................................................................................ 42 1.7.2.3.2 Arcing Switch and Tap Selector ........................................................................................ 42 1.7.2.3.3 Drive Mechanism for Reactance Type LTCs...................................................................... 43 1.7.2.4 Vacuum Interrupter Type LTCs.............................................................................................. 43 1.7.2.5 Resistance Type LTCs .......................................................................................................... 44 1.7.2.6 Drive Mechanisms for Resistance Type LTCs ........................................................................ 45 1.7.2.7 Failure Mechanisms for LTCs................................................................................................ 45 1.7.2.7.1 Electrical Connections ...................................................................................................... 45 1.7.2.7.2 Insulation System ............................................................................................................. 46 1.7.2.7.3 Control System................................................................................................................. 47 1.7.2.7.4 Mechanism ...................................................................................................................... 47
1.7.3
European Practices .......................................................................................................... 47
1.7.3.1 1.7.3.2 1.7.3.3
Resistance Type OLTCs ....................................................................................................... 47 Diverter Switch OLTC ........................................................................................................... 48 Selector Switch OLTC........................................................................................................... 49
vii
1.7.3.4 Tie-In Resistors..................................................................................................................... 51 1.7.3.5 Failure Mechanisms for OLTCs ............................................................................................. 52 1.7.3.5.1 Electrical Connections ...................................................................................................... 52 1.7.3.5.2 Insulation System ............................................................................................................. 53 1.7.3.5.3 Motor Drive Mechanism.................................................................................................... 53 1.7.3.5.4 Mechanism ...................................................................................................................... 53
1.8 STREAMING ELECTRIFICATION .................................................................................................. 54 1.8.1 Charging Tendency and its Effect of Streaming Electrification ........................................... 55 1.8.2 Mitigation Strategies for Streaming Electrification............................................................. 56 2 A PRACTICAL APPROACH TO ASSESSING THE RISK OF FAILURE OF POWER TRANSFORMERS ................................................................................................................................ 59 2.1 BACKGROUND......................................................................................................................... 59 2.2 LIFE MANAGEMENT PROCESS ................................................................................................... 59 2.2.1 Risk Assessment .............................................................................................................. 60 2.2.2 Layout of the Evaluation Procedure .................................................................................. 63 2.2.3 Evaluation Procedure........................................................................................................ 64 2.2.4 Probability of Failure – Individual Failure Rate................................................................... 66 2.3 ASSESSMENT OF THE TECHNICAL RISK OF FAILURE BY CATEGORY (MTMPTM PROGRAM) ............... 67 2.3.1 Mechanical Aspects.......................................................................................................... 67 2.3.2 Thermal Aspects............................................................................................................... 67 2.3.3 Electric Aspects - Risk of Dielectric Failure........................................................................ 67 2.3.4 Aspects Related to Accessory Failure ............................................................................... 67 2.3.5 Total Technical Risk of Failure .......................................................................................... 68 2.4 RISK MITIGATION .................................................................................................................... 70 2.5 SUMMARY .............................................................................................................................. 70 3
DIAGNOSIS OF TRANSFORMERS.............................................................................................. 71 3.1 DIAGNOSTICS METHODS FOR POWER TRANSFORMERS AND ACCESSORIES .................................. 71 3.1.1 Diagnostic Methods for Power Transformers..................................................................... 71 3.1.1.1 3.1.1.2 3.1.1.3
3.1.2
Diagnostic Methods for Bushings ...................................................................................... 74
3.1.2.1 3.1.2.2 3.1.2.3
3.1.3
Stresses Acting on Power Transformers ................................................................................ 72 Deterioration Factors and Failure Mechanisms....................................................................... 73 Diagnostic Methods............................................................................................................... 73 Stresses Acting on Bushings ................................................................................................. 75 Deterioration Factors and Failure Mechanisms....................................................................... 75 Diagnostic Methods............................................................................................................... 76
Diagnostic Methods for Surge Arresters............................................................................ 76
3.1.3.1 3.1.3.2 3.1.3.3
Stresses Acting on Surge Arresters ....................................................................................... 77 Deterioration Factors and Failure Mechanisms....................................................................... 77 Diagnostic Methods............................................................................................................... 78
3.2 GENERAL DIAGNOSIS TOOLS ..................................................................................................... 79 3.2.1 Oil Quality Assessment..................................................................................................... 79 3.2.1.1 Factors Affecting the Health and Life of Power Transformers ................................................. 79 3.2.1.2 Methods for Assessing the Quality of Transformer Oils........................................................... 80 3.2.1.2.1 Dielectric Breakdown Strength (BDV)................................................................................ 80 3.2.1.2.2 Interfacial Tension (IFT).................................................................................................... 80 3.2.1.2.3 Acid Neutralization Number .............................................................................................. 81 3.2.1.2.4 Power Factor.................................................................................................................... 82 3.2.1.2.5 Test for Oxygen Inhibitor................................................................................................... 82 3.2.1.2.6 Furan Analysis ................................................................................................................. 82 3.2.1.2.7 PCB Content .................................................................................................................... 83 3.2.1.2.8 Corrosive Sulphur............................................................................................................. 83 3.2.1.3 Moisture in Transformer Insulation Systems .......................................................................... 83 3.2.1.3.1 Transformer Oil ................................................................................................................ 84 3.2.1.3.2 Relative Humidity ............................................................................................................. 84 3.2.1.3.3 Paper (Cellulose).............................................................................................................. 85 3.2.1.3.4 Where Does the Water Come From .................................................................................. 86 3.2.1.3.5 Moisture Equilibrium between Oil and Paper in Transformers............................................. 86
viii
3.2.1.3.6 Cautions in Estimation of Moisture Using Moisture Equilibrium Curves ............................... 88 3.2.1.4 Limits for Measurement Oil Quality Parameters ..................................................................... 89 3.2.1.5 Moisture and Bubble Evolution in Transformers ..................................................................... 92
3.2.2
Dissolved Gas in Oil Analysis (DGA) ................................................................................ 96
3.2.2.1 Introduction........................................................................................................................... 96 3.2.2.2 Procedure............................................................................................................................. 97 3.2.2.3 Sampling .............................................................................................................................. 97 3.2.2.4 Extraction ............................................................................................................................. 97 3.2.2.5 Analysis................................................................................................................................ 97 3.2.2.6 Interpretation ........................................................................................................................ 99 3.2.2.7 Air ........................................................................................................................................ 99 3.2.2.8 Gas Spectrum – Types of Faults............................................................................................ 99 3.2.2.8.1 Hot Metal Surface............................................................................................................. 99 3.2.2.8.2 Examples of Hot Metal Surfaces ....................................................................................... 99 3.2.2.9 Overheated cellulose .......................................................................................................... 100 3.2.2.9.1 Examples of Overheated Cellulose ................................................................................. 100 3.2.2.10 Electrical Faults .................................................................................................................. 100 3.2.2.10.1 Examples of Electrical Faults......................................................................................... 100 3.2.2.11 Factors affecting gas concentration in transformers.............................................................. 101 3.2.2.11.1 Type and Brand of Oil ................................................................................................... 101 3.2.2.11.2 Oxygen......................................................................................................................... 101 3.2.2.11.3 Load............................................................................................................................. 101 3.2.2.11.4 Oil Preservation Systems .............................................................................................. 101 3.2.2.11.5 Gas Mixing ................................................................................................................... 102 3.2.2.11.6 Temperature................................................................................................................. 102 3.2.2.11.7 Gas Solubility in Oil....................................................................................................... 103 3.2.2.11.8 Other Factors................................................................................................................ 104 3.2.2.12 DGA Interpretation Methods................................................................................................ 106 3.2.2.12.1 Key Gas Method of Interpreting DGA............................................................................. 106 3.2.2.12.2 Individual and Total Dissolved Key-Gas Concentration Method ...................................... 107 3.2.2.12.3 Rogers Ratio Method .................................................................................................... 110 3.2.2.12.4 IEC Method .................................................................................................................. 112 3.2.2.12.4.1 Carbon Dioxide/Carbon Monoxide (CO2/CO) Ratio .........................................................112 3.2.2.12.4.2 IEC C2H2/H2 Ratio ..............................................................................................................113 3.2.2.12.4.3 IEC Recommended Method of Interpretation ...................................................................113 3.2.2.12.5 Duval Triangle Method for Diagnosing a Transformer Problem Using Dissolved Gas Analysis ................................................................................................ 114 3.2.2.12.6 ABB's Advanced Dissolved Gas Analysis Software (ADGA) ........................................... 117
3.2.3
Analysis of Particles in Transformer Oils ........................................................................ 118
3.2.3.1 Oil Sampling for Particle Analysis ........................................................................................ 118 3.2.3.2 Particle Counting ................................................................................................................ 118 3.2.3.2.1 Normal and Abnormal Particle Count Levels.................................................................... 119 3.2.3.3 Trace Metal Content of Particles.......................................................................................... 120 3.2.3.3.1 Method of Measurement ................................................................................................. 120 3.2.3.3.2 Normal and Abnormal Metallic Content of Particles in Oil................................................. 120 3.2.3.4 Diagnostic Examples of Particle Analysis............................................................................. 121 3.2.3.5 Effect of particles on dielectric strength of insulating oil ....................................................... 122 3.2.3.5.1 Current filtering practices on new transformers ................................................................ 122 3.2.3.5.2 Classification of contamination level ................................................................................ 123 3.2.3.5.2.1 Bare electrodes ....................................................................................................................123 3.2.3.5.2.2 Covered electrodes ..............................................................................................................123 3.2.3.5.3 Contamination deposited on insulating surface................................................................ 124 3.2.3.5.4 Recommended corrective action..................................................................................... 125
3.2.4
Winding Resistance Test ................................................................................................ 126
3.2.4.1
3.2.5 3.2.6
3.2.6.1 3.2.6.2 3.2.6.3
3.2.7
Measurement Method for Winding Resistance Measurement................................................ 126
Transformer Turns Ratio Test (TTR) ............................................................................... 128 Insulation resistance ....................................................................................................... 131 Measurement...................................................................................................................... 131 Interpretation ...................................................................................................................... 132 Polarization Index ............................................................................................................... 133
Insulation Power Factor Tests......................................................................................... 134
ix
3.2.7.1 Two-Winding Transformer ................................................................................................... 135 3.2.7.1.1 Testing of Two-Winding Transformers............................................................................. 136 3.2.7.2 Three-Winding Transformer................................................................................................. 139 3.2.7.3 Typical Insulation Power Factor Values................................................................................ 140 3.2.7.4 General Guidelines for Assessing Power Factor Values ....................................................... 141 3.2.7.5 Power Factor Tip-up Tests .................................................................................................. 141
3.2.8
Core Insulation Resistance Measurement ....................................................................... 142
3.2.8.1
3.2.9
3.2.9.1 3.2.9.2
3.2.10
Measurement and Diagnosis of Inadvertent Core Grounds................................................... 142
Excitation Current Tests.................................................................................................. 144 Measurement Setup............................................................................................................ 145 Analysis of Excitation Current Results.................................................................................. 148
Infrared Thermography Analysis of Transformers and Accessories ............................. 149
3.2.10.1 The Thermography Process ................................................................................................ 149 3.2.10.2 Criteria for Evaluating Infrared Measurements ..................................................................... 150 3.2.10.3 Example Uses of Infrared Thermography diagnostics on Power Transformers ..................... 150 3.2.10.3.1 Loose connection at bushing outlet terminal................................................................... 150 3.2.10.3.2 Blocked oil flow in radiators or radiator shut off .............................................................. 151 3.2.10.3.3 LTC overheating ........................................................................................................... 151 3.2.10.3.4 Low oil level in transformer or bushing ........................................................................... 152 3.2.10.3.5 Moisture contamination of surge arrester ....................................................................... 152
3.2.11
Bushings .................................................................................................................... 153
3.2.11.1 ANSI & IEC – Common Diagnostic Tools............................................................................. 153 3.2.11.1.1 Oil leakage inspection................................................................................................... 153 3.2.11.1.2 Insulator inspection and cleaning................................................................................... 153 3.2.11.1.2.1 Porcelain insulators ............................................................................................................153 3.2.11.1.2.2 Silicon rubber insulators.....................................................................................................153 3.2.11.1.3 Thermovision................................................................................................................ 153 3.2.11.1.4 Oil sampling from bushing ............................................................................................. 154 3.2.11.1.5 Dissolved Gas Analysis (DGA) ...................................................................................... 156 3.2.11.1.6 Moisture analysis .......................................................................................................... 156 3.2.11.1.7 Dielectric Frequency Response Analysis (DFRA)........................................................... 157 3.2.11.1.8 Partial Discharge measurements................................................................................... 157 3.2.11.1.9 De-polymerization analysis............................................................................................ 157 3.2.11.2 Diagnostics techniques for bushings complying with the ANSI/IEEE Standards..................... 158 3.2.11.2.1 Condenser Bushing Power Factor Tests........................................................................ 158 3.2.11.2.2 Factors Affecting C1 and C2 Capacitance and Power Factor Measurements .................. 159 3.2.11.2.3 Bushing Hot Collar Test ................................................................................................ 162 3.2.11.2.4 What to do when Bushing Power Factor Tests are Doubtful............................................ 164 3.2.11.2.5 Special Case – Type “U” Bushings ............................................................................... 164 3.2.11.2.5.1 History.................................................................................................................................164 3.2.11.2.5.2 Recommendation ...............................................................................................................170 3.2.11.2.6 Type “T” Bushings......................................................................................................... 173 3.2.11.3 Diagnostics and Conditioning on ABB Bushings Complying with the IEC Standard................ 174 3.2.11.3.1 Capacitance and tan measurement.............................................................................. 175 3.2.11.3.2 Temperature correction................................................................................................. 175
3.2.12
Measurements for Assessing the Condition of OLTCs/LTCs ....................................... 178
3.2.12.1 Number of Operations......................................................................................................... 178 3.2.12.2 Resistance of the Electrical Connections ............................................................................. 178 3.2.12.3 Temperature....................................................................................................................... 178 3.2.12.4 Motor Current ..................................................................................................................... 178 3.2.12.5 Acoustic Signal ................................................................................................................... 178 3.2.12.6 Relay Timing....................................................................................................................... 179 3.2.12.7 Gas-in-Oil Analysis ............................................................................................................. 179 3.2.12.7.1 Items Specific to the European Practice........................................................................ 179 3.2.12.7.1.1 Scope ..................................................................................................................................179 3.2.12.7.1.2 History.................................................................................................................................179 3.2.12.7.1.3 Faults in OLTCs possible to indicate by DGA...................................................................179 3.2.12.7.1.4 The Stenestam ratio...........................................................................................................180 3.2.12.7.1.5 Important principals for interpretation of DGAs in OLTC .................................................180 3.2.12.7.1.6 Interpreting the Stenestam ratio ........................................................................................180 3.2.12.7.1.7 Typical gas concentrations ................................................................................................181
x
3.2.12.7.2 Important to bear in mind .............................................................................................. 182 3.2.12.7.3 North-American Practice ............................................................................................... 182 3.2.12.8 Moisture ............................................................................................................................. 183
3.3 ADVANCED DIAGNOSTIC TOOLS .............................................................................................. 184 3.3.1 Assessment of Mechanical Properties - Frequency Response Analysis (FRA) ................ 184 3.3.1.1 Introduction......................................................................................................................... 184 3.3.1.1.1 Purpose of FRA measurements ...................................................................................... 184 3.3.1.1.2 When should FRA measurements be performed?............................................................ 184 3.3.1.2 Standards........................................................................................................................... 185 3.3.1.3 General description of the FRA method ............................................................................... 185 3.3.1.3.1 Principle of the measurement.......................................................................................... 185 3.3.1.3.2 Practical set-up .............................................................................................................. 186 3.3.1.4 Commercial equipment ....................................................................................................... 187 3.3.1.5 Detailed measurement procedure........................................................................................ 187 3.3.1.5.1 Test preparation ............................................................................................................. 188 3.3.1.5.2 Tap changer position ...................................................................................................... 188 3.3.1.5.3 Treatment of un-tested terminals..................................................................................... 189 3.3.1.5.4 Test leads: ..................................................................................................................... 189 3.3.1.5.5 Test Set-up .................................................................................................................... 189 3.3.1.6 Reporting of FRA measurements......................................................................................... 192 3.3.1.6.1 General information: ....................................................................................................... 192 3.3.1.6.2 Transformer information:................................................................................................. 192 3.3.1.6.3 Description of each measurement: .................................................................................. 192 3.3.1.6.4 Instrumentation: ............................................................................................................. 193 3.3.1.6.5 Cabling: ......................................................................................................................... 193 3.3.1.7 Basic interpretation and on-site quality check....................................................................... 193 3.3.1.7.1 Some “normal” FRA spectra ........................................................................................... 194 3.3.1.7.2 Meaning of different frequency ranges in an FRA spectrum ............................................. 197 (A) When only the current FRA measurement data are available:....................................................... 197 3.3.1.7.3 Comparison between open- and short-circuit measurements ........................................... 197 3.3.1.7.4 Comparison between high- and low-voltage windings ...................................................... 197 3.3.1.7.5 Comparison between phases.......................................................................................... 197 (B) When further data are available................................................................................................... 198 3.3.1.7.6 Comparison with historical data....................................................................................... 198 3.3.1.7.7 Comparison with twin or sister units ................................................................................ 198 3.3.1.7.8 History of the unit ........................................................................................................... 198 3.3.1.7.9 Other diagnostic data...................................................................................................... 199 3.3.1.8 Examples of problems diagnosed using FRA ....................................................................... 199 3.3.1.8.1 Axial Winding Collapse................................................................................................... 199 3.3.1.8.2 Hoop Buckling................................................................................................................ 200 3.3.1.8.3 Shorted Turns ................................................................................................................ 202
3.3.2
Assessment of Thermal Properties ................................................................................. 204
3.3.2.1 Degree of Polymerization (DP) ........................................................................................... 204 3.3.2.1.1 DP versus Life Plots ....................................................................................................... 204 3.3.2.1.2 Latest Research Findings on DP Analysis ....................................................................... 207 3.3.2.2 Furanic Compound Analysis................................................................................................ 207 3.3.2.2.1 Origin of Furanic Compounds ......................................................................................... 207 3.3.2.2.2 Detection of Furanic Compounds .................................................................................... 208 3.3.2.2.3 Correlation Curves of Furanic Content with DP................................................................ 208 3.3.2.2.4 Issues to Consider in Using Furan Analysis..................................................................... 209
3.3.3
Dielectric Frequency Response as a Tool for Troubleshooting Insulation Power Factor Problems .................................................................................................. 211
3.3.3.1 Introduction......................................................................................................................... 211 3.3.3.2 Dielectric frequency response and X-Y model ...................................................................... 211 3.3.3.3 Causes of High Power Factor in Transformer Insulation ....................................................... 214 3.3.3.3.1 Comparison of DFR to Power Factor Measurement ......................................................... 214 3.3.3.3.2 Influence of Oil Conductivity and Moisture on PF and DFR .............................................. 215 3.3.3.4 Dielectric Frequency Response Signature and Identification Techniques .............................. 216 3.3.3.4.1 Identification of high Core-Grounding Resistance Problems ............................................. 217 3.3.3.4.2 Identification of Paper Contamination Problems............................................................... 220 3.3.3.4.3 Low Temperature Effect on Insulation Power Factor........................................................ 220 3.3.3.5 Summary............................................................................................................................ 222
xi
3.3.4
Assessment of Electrical Properties - Partial Discharge Measurements .......................... 223
3.3.4.1 Purpose of measurement .................................................................................................... 223 3.3.4.2 Electrical PD Measurement on Transformers ....................................................................... 224 3.3.4.2.1 Calibration...................................................................................................................... 225 3.3.4.2.2 PD measuring procedure................................................................................................ 226 3.3.4.2.3 An Advanced PD system ................................................................................................ 226 3.3.4.3 Procedure for Investigation of PD Sources........................................................................... 228 3.3.4.4 Acoustical Partial Discharge Measurement on Transformers ................................................ 233 3.3.4.4.1 Acoustic PD Wave Characterization................................................................................ 233 3.3.4.4.2 Acoustic Partial Discharge Localization ........................................................................... 235
4
FAULT ANALYSIS ..................................................................................................................... 237 4.1 GUIDANCE FOR PERFORMING FAILURE ANALYSIS ....................................................................... 237 4.1.1 Introduction..................................................................................................................... 237 4.1.2 Failure definition ............................................................................................................. 239 4.1.3 Classification of failures .................................................................................................. 239 4.1.4 General information on malfunctions and failures ............................................................ 240 4.1.5 Systematic failure analysis.............................................................................................. 241 4.1.5.1 4.1.5.2 4.1.5.3 4.1.5.4 4.1.5.5
4.1.6
Collecting information on the unit concerned ........................................................................ 242 Data and information at the time of fault inception ................................................................ 243 Deciding on continued operation or additional investigations ................................................ 246 Assessment of the extent of damage on site ........................................................................ 247 Assessment of external damage on site............................................................................... 248
Diagnostic measurements and their interpretation ........................................................ 249
4.1.6.1 Routine measurements on site ............................................................................................ 250 4.1.6.1.1 Oil analysis .................................................................................................................... 250 4.1.6.1.2 Insulation resistance and tan ........................................................................................ 250 4.1.6.1.3 Measurement of transformer ratio ................................................................................... 250 4.1.6.1.4 Measurement of winding resistances............................................................................... 251 4.1.6.1.5 Measurement of short-circuit impedance ......................................................................... 251 4.1.6.1.6 Excitation at low voltage ................................................................................................. 252 4.1.6.2 Special diagnostic measurements ....................................................................................... 252 4.1.6.2.1 Gas-in-oil analysis .......................................................................................................... 252 4.1.6.2.2 Measurement of partial discharges.................................................................................. 254 4.1.6.2.3 FRA method................................................................................................................... 255 4.1.6.2.4 Measurement of polarization effects for assessing the moisture ....................................... 256 4.1.6.3 Inspection of core-and-coil assembly on site ........................................................................ 256 4.1.6.3.1 General preconditions..................................................................................................... 256 4.1.6.3.2 Safety precautions.......................................................................................................... 257 4.1.6.3.3 Checks to be conducted ................................................................................................. 257 4.1.6.4 Dismantling the defective transformer .................................................................................. 258 4.1.6.4.1 Preconditions ................................................................................................................. 258 4.1.6.4.2 Inspection ...................................................................................................................... 259 4.1.6.4.3 Inspection of the core-and-coil assembly after lifting out of the tank.................................. 259 4.1.6.4.4 Inspection of the windings............................................................................................... 260 4.1.6.5 Typical fault patterns of windings ......................................................................................... 260 4.1.6.5.1 Short-circuit faults........................................................................................................... 260 4.1.6.5.2 Electrical flashover ......................................................................................................... 261 4.1.6.5.3 Thermal faults ................................................................................................................ 263 4.1.6.6 Inspection of the core and the tank ...................................................................................... 263
4.1.7 4.1.8
Final assessment of the failure and the fault.................................................................... 264 Case Studies .................................................................................................................. 265
4.1.8.1 4.1.8.2 4.1.8.3
5
ONLINE DIAGNOSTIC MONITORS FOR TRANSFORMERS AND KEY ACCESSORIES .......... 284 5.1 5.2 5.3
xii
Case 1: Examination of a transformer affected by partial discharges.................................... 265 Case 2: Analysis of a failure caused by overvoltages at no-load switching operation ........... 275 Case 3: Fault analysis on a generator step-up Transformer following an internal flashover . 279
POWER TRANSFORMER (TANK & CORE) .................................................................................. 284 LOAD TAP CHANGER ............................................................................................................. 285 BUSHING & CT ..................................................................................................................... 285
5.4 6
EXAMPLE MONITORING SYSTEMS ........................................................................................... 286
PREVENTIVE MAINTENANCE OF TRANSFORMERS............................................................... 294 6.1 BASIC AGEING PROCESSES .................................................................................................... 294 6.1.1 Introduction..................................................................................................................... 294 6.1.2 Paper Degradation.......................................................................................................... 295 6.1.3 On-site Drying Methods .................................................................................................. 298 6.1.3.1 6.1.3.2
6.1.4
Traditional methods............................................................................................................. 298 On-site drying with low frequency heating (LFH) in combination with hot-oil spray ................ 299
Oil reclaiming.................................................................................................................. 300
6.1.4.1 6.1.4.2 6.1.4.3
Online oil reclaiming technology ......................................................................................... 300 Comparison with oil change................................................................................................. 300 Long- term stability.............................................................................................................. 300
6.2 GENERAL MAINTENANCE OF TRANSFORMERS .......................................................................... 302 6.2.1 Recommended schedule of Maintenance activities ......................................................... 302 6.2.1.1 6.2.1.2 6.2.1.3
6.2.2
Monthly Maintenance Schedule........................................................................................... 302 Quarterly Maintenance Schedule......................................................................................... 303 Annual Maintenance Schedule with The Transformer De-energized ..................................... 304
Maintenance of Components .......................................................................................... 305
6.2.2.1 Transformer liquid and insulation......................................................................................... 305 6.2.2.2 Bushings and joints............................................................................................................. 306 6.2.2.3 Off-load tap changer (DETC)............................................................................................... 306 6.2.2.4 On-load tap changer ........................................................................................................... 307 6.2.2.5 Motor drive unit ................................................................................................................... 307 6.2.2.6 Oil filtering unit.................................................................................................................... 307 6.2.2.7 Coolers............................................................................................................................... 307 6.2.2.8 Liquid conservator with rubber diaphragm (COPS)............................................................... 307 6.2.2.9 Gaskets.............................................................................................................................. 307 6.2.2.10 Surface protection............................................................................................................... 308 6.2.2.10.1 Painted surfaces ........................................................................................................... 308 6.2.2.10.2 Zinc coated surfaces ..................................................................................................... 308
6.2.3
Investigation of Transformer Disturbances ...................................................................... 308
6.2.3.1 6.2.3.2
6.2.4
Internal Inspection .......................................................................................................... 312
6.2.4.1 6.2.4.2 6.2.4.3
6.2.5 6.2.6 6.2.7
Opening the Transformer .................................................................................................... 312 The Inspection .................................................................................................................... 313 Electrical Tests ................................................................................................................... 314
Maintenance of Bushings................................................................................................ 315 Maintenance and Service of OLTCs/LTCs ..................................................................... 317 General Quality Information for Various Types of LTCs................................................... 318
6.2.7.1 6.2.7.2
7
Recording of disturbances................................................................................................... 308 Fault localizations advice for oil-immersed transformers ....................................................... 309
North-American Practices.................................................................................................... 318 European Practice .............................................................................................................. 322
REPAIR, REFURBISHMENT AND RETROFIT ........................................................................... 324 7.1 PREPARATION PHASE ............................................................................................................ 325 7.2 UNTANKING AND DISASSEMBLY OF ACTIVE PART ....................................................................... 326 7.3 REPAIR OF THE TRANSFORMER ............................................................................................... 327 7.4 ASSEMBLY AND TANKING OF THE ACTIVE PART .......................................................................... 328 7.5 DRYING ................................................................................................................................ 328 7.6 FINAL ASSEMBLY ................................................................................................................... 329 7.7 HIGH VOLTAGE TESTING ........................................................................................................ 329 7.8 QUALITY PLAN ..................................................................................................................... 330 7.9 FACILITIES FOR SITE REPAIR .................................................................................................. 330 7.9.1 Temporary Workshops.................................................................................................... 331 7.9.1.1 7.9.1.2 7.9.1.3
7.9.2
Steel Buildings.................................................................................................................... 331 Large Tents ........................................................................................................................ 331 Foundation for a Temporary Workshop................................................................................ 332
Facilities for Heavy Lifting ............................................................................................... 332
xiii
7.9.3 7.9.4 7.9.5 7.9.6 8
Moisture control .............................................................................................................. 332 Oil processing................................................................................................................. 333 Drying equipment ........................................................................................................... 333 High voltage test equipment............................................................................................ 333
ENVIRONMENTAL ASPECTS ................................................................................................... 334 8.1 CONTAMINATION OF OILS WITH PCB (POLYCHLORINATED BIPHENYLS) ....................................... 334 8.1.1 General .......................................................................................................................... 334 8.1.2 Dehalogenation Processes Using Sodium and Lithium Derivatives.................................. 335 8.1.3 Dehalogenation Processes Using Polyethyleneglycol and Potassium Hydroxide ............. 335 8.1.4 Dehalogenation in Continuous Mode by Closed Circuit Process...................................... 335 8.2 ELECTROMAGNETIC COMPATIBILITY (EMC) ............................................................................. 335 8.2.1 Introduction..................................................................................................................... 335 8.2.2 Methods to Reduce EMF Levels in Existing Substations ................................................. 336 8.3 AUDIBLE NOISE ..................................................................................................................... 336 8.3.1 Introduction..................................................................................................................... 336 8.3.2 Background .................................................................................................................... 337 8.3.2.1 8.3.2.2
Characteristics of Transformer Noise................................................................................... 337 Propagation of Sound ......................................................................................................... 337
8.3.3 Criteria for Community Noise Levels ............................................................................... 337 8.3.4 Requirements ................................................................................................................. 338 8.3.5 Methods of Substation Noise Control .............................................................................. 338 8.4 RELEASE OF INSULATING OIL.................................................................................................. 340 8.4.1 Introduction..................................................................................................................... 340 8.4.2 Use of Synthetic Ester .................................................................................................... 340 8.4.3 Use of Natural Ester ...................................................................................................... 341 9
ECONOMICS OF TRANSFORMER ASSET MANAGEMENT ..................................................... 342 9.1 FAILURE STATISTICS FOR POWER TRANSFORMERS................................................................... 342 9.1.1 CIGRE Survey of Failures in Large Power Transformers ................................................ 342 9.1.2 Canadian Electricity Association Forced Outage Report ................................................. 344 9.2 ECONOMICS OF TRANSFORMER MANAGEMENT FOR FLEETS AND SPECIFIC UNITS ........................... 347 9.2.1 Introduction..................................................................................................................... 347 9.2.2 General Concept for Economics of Transformer Management......................................... 348 9.2.3 Description of the Simulation Model ................................................................................ 349 9.2.4 Case Study by a Utility.................................................................................................... 350 9.2.5 Conclusions.................................................................................................................... 352
10
HEALTH AND SAFETY ASPECTS / RECOMMENDATIONS ..................................................... 353 10.1 PREAMBLE ........................................................................................................................... 353 10.2 INTRODUCTION ..................................................................................................................... 353 10.3 SCOPE ................................................................................................................................. 353 10.4 DEFINITIONS ......................................................................................................................... 354 10.5 SAFETY MANAGEMENT .......................................................................................................... 355 10.6 DOCUMENTATION .................................................................................................................. 355 10.7 ELECTRICAL SAFETY RULES ................................................................................................... 356 10.7.1 General Rules ............................................................................................................ 356 10.7.2 Communication and Control Rules.............................................................................. 356 10.7.3 Rules for working on dead Electrical Equipment.......................................................... 357 10.7.4 Rules for working on or very near live Electrical Equipment......................................... 361 10.7.5 Switching.................................................................................................................... 361 10.7.6 Work on or very near live conductors .......................................................................... 361 10.7.7 Testing and Commissioning........................................................................................ 362 10.8 W ORK AT HEIGHT: ADDITIONAL SAFETY EQUIPMENT FOR POWER TRANSFORMERS. ...................... 362 10.8.1 “NO-RISK SYSTEM”................................................................................................... 362 10.8.2 “Fall Arrest Towers and Base Plates”.......................................................................... 365
xiv
10.9 APPENDICES......................................................................................................................... 365 10.9.1 Appendix 1 - Minimum working clearance ................................................................... 366 10.9.2 Appendix 2 - Minimum design clearances where power lines cross or are in close proximity 368 10.9.3 Appendix 3 - Minimum separation across point of disconnection in air......................... 369 10.9.4 Appendix 4 - Principles of Risk Assessment................................................................ 370 10.9.5 Appendix 5 - Example of Sample Risk Assessment Sheet. ......................................... 371 10.9.6 Appendix 6 - Electrical Job Hazard Analysis Sheet. .................................................... 372 10.9.7 Appendix 7 - Sample Safety Check Sheet................................................................... 374 10.9.8 Appendix 8 - Sample Safety Permit to work. ............................................................... 376 10.9.9 Appendix 9 - Sample Energized Electrical Work Permit............................................... 378 REFERENCES.................................................................................................................................... 379 INDEX................................................................................................................................................. 390 ABB TRANSFORMERS SERVICE GENERAL BROCHURES ........................................................... 395 ABB TRANSFORMERS SERVICE PRODUCT LEAFLETS................................................................ 405 ABB TRES NORTH AMERICA SERVICE BROCHURES.................................................................... 423 CONTACT LIST FOR MAIN ABB SERVICE CENTERS...................................................................... 454
xv
1 TRANSFORMER DESIGN CONSIDERATIONS [1] 1.1
CONFIGURATION
There are two basic configurations for power transformers: core form and shell form. The principal physical difference between the two constructions is related to the geometry of the magnetic circuit and the position, alignment, and types of the windings employed for each design. Fundamentally, for the shell form designs, the magnetic circuit forms a shell around a major portion of the windings. Three phase shell form designs use 4 and 7 limb cores with the usual horizontal orientation of the core limbs. Shell form 7 limb cores are used on newer shell form designs due to lower weight, manufacturing simplicity, and lower core loss. Single phase shell form transformers use 3 limb cores. In the shell form design, the windings are interleaved; that is, the high-voltage and low-voltage windings are subdivided into groups with the groups adjacent to each other in the axial (horizontal) direction. Each group is assembled using interconnected rectangular pancake coils. In core form designs the magnetic circuit forms a core through the windings. Three phase core form transformers are usually constructed with a three limb core that has the center limbs vertically oriented with the top and bottom yokes for main flux return paths oriented horizontally. When shipping height becomes a limiting design factor, a five limb core may be used to keep the shipping height within the shipping limitation. This configuration enables the yoke depth to be reduced by providing a return flux path external to the wound limbs. The only other occasion in which a three-phase, five limb core might be necessary is when it is required to provide a value of zero sequence impedance of similar magnitude to the positive sequence impedance. The core form single phase geometry uses 2, 3, or 4 limb cores. Generally, the core form design uses several types of circular coils (layer, helical, disc) that are concentric with each other and the vertical core limb. For power transformers, there will be design requirements where one form of construction will have an advantage over the other. The major parametric elements of the comparison are MVA size, voltage class, impedance requirements, and loss performance characteristics. ABB has the flexibility in design knowledge and manufacturing capability to produce either construction.
1.2
MECHANICAL CONSIDERATION
The mechanical design of a transformer involves the analysis and determination of the expected operational forces, the structural stress analysis of the insulation system and support elements, and the proper choice of materials. A transformer must be strong enough to withstand the mechanical stresses imposed by system-related events such as short circuits. The mechanical stresses developed during normal operation are low, but the stresses generated by a system short circuit event can be quite large. Also, the 17
magnitude of these stresses increase with the size and complexity of the transformer. The majority of the mechanical stresses must be taken by the insulation system, which is primarily composed of cellulose-based materials. These materials are weakest in bending and tension. It is therefore best to apply these materials in compression. Also, to keep the total forces as low as possible, the design of the windings should be made using the best arrangement and overall geometry of the individual windings.
1.3
THERMAL CONSIDERATIONS
Temperature is one of the most important factors affecting transformer life. As the temperature of the insulation increases, the insulation life decreases. The transformer must be designed to operate within the guaranteed temperature parameters and the prescribed standard allowances to ensure long transformer life. In an oil-filled transformer, the insulating oil is used to conduct the heat away from the windings and the magnetic core. To perform this function, the oil must circulate through the winding assembly and usually through externally applied cooling apparatus. For thermosiphon oil flow (natural oil flow), oil circulation is created when the weight of the column of oil in the cooling equipment is greater than the weight of the column of oil in the core and coil assembly. Also, the center of cooling must be above the center of heating. This distance has a direct affect on the top-to-bottom temperature difference – the larger the distance between the center of cooling and the center of heating, the larger the oil flow and the lower the top-to-bottom temperature difference. This configuration is defined in the standards as ONAN (oil natural, air natural) – the old nomenclature was OA). Additional transformer capacity can be created by adding auxiliary cooling equipment, such as fans. Fans increase the airflow over the external cooling equipment without changing the mode of internal oil flow. Fans can be added in one or two stages. Using the ONAN rating as the base or 100 % rating, a rating of 133 % can be attained by adding one stage of fans. Additional fans (2nd stage), usually equal in number to the first stage of fans, can be added to obtain a rating of 167 %. The energizing of the fan stages is normally controlled by temperature-actuated contacts provided in the winding temperature device. The current industry designations for fans-only auxiliary cooling with natural oil flow are defined in the standards as: ONAN/ONAF (oil natural, air natural/oil natural, air forced – 100 %/133 %) – the old designation was OA/FA ONAN/ONAF/ONAF – (oil natural, air natural/oil forced, air forced/ oil forced, air forced – 100 %/133 %/167 %) – the old designation was OA/FA/FA For larger transformer ratings, some design configurations may require the addition of oil circulating pumps to meet the required temperature rise guarantees. With the addition of oil circulating pumps, the top-to-bottom oil temperature difference attained by the forced oil flow is usually in the order of single digits. The increased oil flow is usually accompanied by internal means to direct the oil flow through the windings; this is generally known as directed flow. When two stages of auxiliary cooling are employed, the equipment is generally divided equally among the two stages. The designation for cooling 18
with auxiliary fans and pumps is defined in the standards as (past nomenclature shown in parentheses): ONAN/ODAF (oil natural, air natural/oil directed, air forced – 100 %/133 %) – the old designation was OA/FOA. ONAN/ODAF/ODAF (oil natural, air natural/oil directed, air forced/ oil directed, air forced – 100 %/133 %/167 %) – the old designation was OA/FOA/FOA. Other configurations for the use of auxiliary fans and pumps are sometimes applied, such as using fans only for the first rating increase and energizing all of the pumps for the second stage of cooling. Additionally, transformers can be designed with a single rating that uses auxiliary cooling equipment consisting of oil circulating pumps with an associated oil-to-air heat exchanger or forced oil with a water-cooled heat exchanger.
1.4
DIELECTRIC CONSIDERATIONS
The transformer insulation system must be designed to withstand the normal operating voltages as well as over-voltages during lightning events, system short circuits, and system switching surges. In addition, consideration must be given to produce transformers that withstand these voltages with all elements operating below the corona onset voltage. A transformer is a simple inductance when considering low frequency operating voltages and over- voltages. However, to an impulse voltage, the transformer presents a complex combination of inductances and capacitances. Initially, when an impulse voltage impinges upon a transformer winding, the initial distribution is determined by the winding coil-to-coil and coil-to-ground capacitances. The final voltage distribution is ultimately distributed in line with the winding coil inductances. For many transformers, the initial distribution of an impulse voltage is less than perfect. This results in increased stress at the line end of the winding. There are several solutions for these increased stresses. For the lower voltage ratings, the usual method is to accept the higher stress and insulate accordingly. For higher voltage ratings, there are a number of winding arrangements, conductor interleaving schemes, and electrostatic shielding methodologies that are employed to reduce the voltage stresses produced at the line end of the winding.
1.5
CONSTRUCTION TYPES 1.5.1
1.5.1.1
SHELL FORM DESIGN FEATURES
The ABB Shell Form-Form Fit design features a rectangular shaped coil system made up of a series of inter-connected pancake coils. The coil and insulation assembly is mounted vertically in the tank bottom section. The core is positioned horizontally around the outside of the winding and acts as a protective shell around the coil. The upper section 19
of the tank fits snugly over the core and coils to form a unit assembly with the mechanical support completely outside the winding (see Figure 1-1). The heat generated by the core and coils is dissipated by the circulation of the oil. The oil flow from the bottom to the top of the tank is supported by the temperature differential or thermal head during self-cooled operation. The addition of pumps and fans for forced cooling will increase the flow of oil through the core and coils and the flow of air through the heat exchanger. With either mode of cooling, the oil passes through a heat exchanger where it cools prior to reentering the tank at the bottom. The shell form insulation system consists of high dielectric strength pressboard sheets and precisely located oil spaces designed to control voltage stress concentration.
Figure 1-1: Partial Cutaway of a Shell Form Transformer 1.5.1.2
MECHANICAL STRENGTH
The coils in a shell form design are large surface area pancake coils, and they are assembled into winding groups with their faces adjacent to flat pressboard washers which contain a planned pattern of spacer blocks cemented to the surface. The spacer blocks provide a uniform support system to the turns and strands of the individual coils. The complete phase is installed vertically in the tank bottom, and the core is stacked around it. The upper section of the tank is fitted snugly over the core and shimmed with vertical wooden slits spaced around the periphery of the core. The total force between transformer winding groups varies as the square of the ampere turns per group. If the current during fault conditions is ten times the normal load current, the short circuit force will be one hundred times the normal load winding forces. As transformers get larger, the ampere turns per winding group are reduced in a shell form design by increasing the number of winding groups, or high-low spaces; thus controlling the magnitude of the total force. Increasing the number of high-low spaces 20
does not increase the length of the average mean turn in a shell form winding; therefore, it can be done economically. The forces within successive winding groups in a shell form transformer are in opposite directions. As they traverse the winding, the forces tend to cancel each other out. As a result, the net total restraining force that must be applied external to the windings is only the force corresponding to a single pair of winding groups (see Figure 1-2).
Figure 1-2: Section Through a Shell Form Winding Group with a High-Low Coil Configuration (arrows illustrate mechanical forces)
In addition to the control of total force magnitude available in a shell form design, the unit stresses on the winding insulation structures are kept at a low level. The major winding force is perpendicular to the face of the pancake coils, and each coil is supported by spacer blocks on its adjacent pressboard washers. Between spacers, the windings act as uniformly loaded beams, and the total winding force is transmitted through the group by compression of the spacer blocks. The shell form design uses large pancake coils; thus a large number of spacer blocks are available to absorb the total force, and the unit stresses in the pressboard are relatively low. The total force magnitude in a shell form design can be reduced considerably with multiple high-low coil arrangements. Even with this advantage it is essential to have a rugged mechanical structure to withstand the ultimate forces encountered during thrufault conditions. In the ABB Shell Form-Form Fit design the major components of force are taken by well-braced structures completely outside the winding. The close-fitting Form Fit tank and the core assembly combine to restrain the total forces acting on the winding. For the portions of the winding that are above and below the core, heavy steel structural members welded to the tank provide the restraint for the forces. The bracing structures are completely outside the winding and can be reinforced without any compromises in winding design. The ABB Shell Form-Form Fit design offers a combination of controlled maximum stress, inherent stability, and high mechanical strength to withstand the forces produced by system thru-faults. The use of the Form Fit tank as the major structural support makes
21
up to a 20 % reduction in total weight and as much as 40 % reduction in oil volume in ABB shell form large power transformers possible (see Figure 1-3).
Figure 1-3: Partial Cutaway of a Shell Form Transformer Showing Support Structure for Core and Coils 1.5.1.3
T HERMAL CAPABILITY
A transformer is a very efficient piece of apparatus; however, energy is generated by losses in the core and coils during normal operation. This energy is in the form of heat, which increases approximately as the square of the load current and must be dissipated to prevent deterioration of the insulation system. The oil in the transformer serves as a medium for transmitting this energy from the core and coils to a heat exchanger, where it is dispersed to the atmosphere. The HV and LV coils in an ABB Shell Form Transformer are arranged vertically in the tank and pressboard insulation washers containing spacer blocks in a pre-designed pattern are located on either side of each coil. The spacer block pattern provides ducts on both sides of the conductor through which the oil travels from the bottom to the top of the tank. The core in a shell form transformer is a stack of narrow-width steel punchings. Oil flowing on both sides of the core adequately cools this area; therefore, oil ducts within the magnetic circuit are not necessary. The oil flow in the transformer tank during self-cooled operation is supported by the temperature differential between the oil at the top and bottom of the tank. This temperature differential, or thermal head, is approximately 12 °C for a shell form transformer (see Figure 1-4).
22
Figure 1-4: Partial Cutaway of a Shell Form Transformer Illustrating OA (Self-Cooled) Cooling Action
As the load on a transformer increases, the energy generated by the losses in the coil system will increase in proportion to the square of the increase in load. Forced cooling is applied to dissipate this additional energy and allow the transformer to operate at the increased load and within temperature guarantees. ABB applies both pumps and fans for forced cooled ratings on shell form transformers. The pumps augment the circulation of oil that exists due to the thermal head, and since the coils are positioned vertically, no barriers are necessary to direct the oil flow. The additional oil flow provided by the pumps virtually eliminates the oil temperature differential in the transformer and reduces the winding hottest spot temperature as much as 10°C. The fans direct the airflow over the heat exchanger at a high velocity, thus improving energy transfer to the atmosphere. The addition of fans alone to a typical radiator bank will significantly increase its energy dissipation; fans used in conjunction with pumps to provide forced air and forced oil cooling will further increase the cooling capability of the same radiator bank. The forced cooling can be operated continuously for heavily loaded transformers, or it can be actuated in stages as the load increases. Forced oil-forced air cooling is the most efficient method of increasing the capacity of a transformer. This method of cooling coupled with the inherent thermal characteristics of the ABB Shell Form Transformer design offer the highest thermal capability in large power transformers.
23
Figure 1-5: Partial Cutaway of a Shell Form Transformer Illustrating FOA (Forced-Cooled) Cooling Action 1.5.1.4
DIELECTRIC CHARACTERISTICS
The effect of overvoltage and system surge conditions on the windings of a transformer is determined by the characteristics of the particular coil and insulation system. As this voltage surge enters the transformer winding, the initial voltage distribution will be directly determined by the capacitance networks of the coil and winding system (see Figure 1-6). Oscillations may develop as the surge progresses through the coil system, which for certain designs may be amplified by the natural oscillation in these systems to a value greater than the initial crest. This overvoltage condition may concentrate at some point in the winding, such as the first several turns at the line end of the winding or around a tap section, and stress the turn-to-turn insulation in these areas.
Figure 1-6: Equivalent Inductance-Capacitance Network of a Shell Form Winding Section
The coil assembly of an ABB Shell Form Transformer consists of a relatively few “pancake” coils with a broad cross-sectional area and a narrow coil edge (see Figure 1-6). Since the capacitances between coils and from coil to ground are directly proportional, respective to the cross-sectional area of the coil and the area of its edge, 24
the shell form coil system has a high coil-to-coil and a low coil-to-ground capacitance. When the ratio of coil-to-coil capacitance to the coil-to-ground capacitance is high, as it is in a shell form transformer design, the voltage distribution with rapidly rising voltage surges is more nearly uniform.
Figure 1-7: Shell Form Transformer - Cross-Section of Line End Coils within the Core Iron
The turn-to-turn voltage stresses due to the initial application of the surges are thereby reduced in the shell form design insulation system, and the succeeding oscillations developed in the winding are also reduced. The large inherent capacitance of the shell form design causes the natural period of the winding oscillation to be relatively long, thus allowing the voltage surges to decay to a low value before the winding oscillations can develop to a significant magnitude. The insulation structures between coils, between coils and core, and between winding groups are made of high dielectric strength oil-impregnated sheets. Oil spaces are provided with a precise relationship to the coil and pressboard structures to control voltage stress concentrations. Specially formed insulation pieces are used over the coil edge where the voltage stress is highest. This insulation is stressed in puncture rather than creep for additional strength.
25
The pancake coils in a shell form transformer are arranged to terminate at the top of the transformer where line end and tap connections can be made with a short lead. The magnitude of circulating currents induced by high fields is minimized in an ABB Shell Form Transformer because of the short lead length and unique subdivided lead construction. The inherent design characteristics of ABB Shell Form Transformers assure their reliable operation. The performance of ABB Shell Form Transformers is verified by exclusive modeling techniques prior to manufacture. 1.5.2 1.5.2.1
CORE FORM DESIGN F EATURES
Core Form construction (see Figure 1-8) utilizes a series of cylindrical windings stacked on a steel core. The core is at ground potential; therefore, the lowest voltage winding is located adjacent to it, and the higher voltage windings are separated from the core in order of voltage. The highest voltage winding is on the outside of the assembly. The windings are supported laterally by laminated winding tubes and properly selected conductor tension. Vertical support for the coils is provided by a plate type pressure ring and lock plate assembly restrained by channel end frames.
26
Figure 1-8: Partial Cutaway of a Core Form Transformer
Cooling of the core and coil assembly is accomplished by oil circulation through ducts between the coils and also ducts within the core. The oil flow from the bottom to the top of the tank is supported by the thermal head or temperature differential from the bottom to the top of the transformer. The oil passes through a heat exchanger, where it cools before reentering the transformer at the bottom. The individual turns in the coil are insulated with high-density cellulose tape. Oil spaces are provided between the disc sections of the coil with laminated spacer blocks. The oil spaces between coils are maintained by vertical spacer rods. 1.5.2.2
MECHANICAL STRENGTH
The coil system of a core form transformer consists of cylindrical type windings placed on a vertical steel core. The forces created by thru-fault currents tend to separate these windings. The forces on the outer (or HV) winding push the winding out and place the
27
conductors in tension. The force on the inner (or LV) winding acts to compress the winding, and the stress is transmitted to the winding tube (see Figure 1-9).
Figure 1-9: Section Through a Core Form Winding Group with an Expanded View of One Coil and Spacers (arrows illustrate mechanical forces)
If the electrical centers of the coils are displaced by taps or an unequal winding arrangement, a vertical force is introduced, which tends to telescope the windings. The vertical forces can exceed 800,000 pounds per phase during the thru-fault conditions. The forces in a core form transformer increase with transformer size; therefore, the mechanical properties of winding tubes, vertical spacers, and radial spacers are critical to the mechanical strength of the design. The tensile strength of the HV winding conductor is also a very important consideration. The vertical forces that act to telescope the windings are transmitted through radial spacers to the pressure rings and then to the core end frames at the end of the winding. These forces are transmitted through the winding across the narrow face of the conductor, resulting in a high per-unit stress on the conductor and spacers. The vertical forces tend to compress the spacer material, and over a period of time will cause looseness between the disc sections of the coils. Preventing this will require some means provided to maintain compression on the winding. On ABB Core Form designs, the horizontal and vertical forces occurring during thrufault conditions are calculated during the design of a transformer, and the support structure is designed accordingly. The coils are pre-stressed at the time of assembly to maintain the vertical dimensional tolerances and the tightness of the coils.
28
Figure 1-10: Partial Cutaway of a Core Form Transformer Showing the Support Structure for Core and Coils 1.5.2.3
T HERMAL CAPABILITY
The energy generated by the losses in the core and coil system of a core form transformer is transmitted to the heat exchanger by the circulation of oil through ducts between the coils and ducts within the core. The oil flow is supported by the thermal head in the tank. The HV winding in a core form transformer is made up of a series of disc sections positioned horizontally on the winding tube. The oil must travel through both horizontal and vertical ducts to properly cool the conductors. Typically, the LV coil construction is a helical winding that uses insulated rectangular or transpose conductors and is cooled by oil flow through ducts on either side of the coil. The core has a relatively large cross-sectional area and is located inside the coil assembly where heat is concentrated; therefore, ducts must be provided within the core to allow oil circulation for cooling. The plate type pressure rings, which are located at each end of the coil assembly, tend to block the flow of oil through the coil assembly; therefore, ducts and barriers must be provided to direct the oil flow to the inner windings. Forced cooling is applied to core form design by adding high velocity fans to the heat exchanges to increase energy dissipation. The oil circulation is supported by the thermal head in the transformer tank (see Figure 1-11). If pumps are added for forced oil circulation, baffles must be provided to direct the oil flow, otherwise the greater part of the oil volume will move upward in the area between the HV winding and the tank wall. The barriers used to direct forced oil flow will impede 29
the flow during self-cooled operation. Transformer designs with continuous forced cooling, such as generator step-up units, can advantageously utilize the baffled arrangement.
(a)
(b)
Figure 1-11: Partial Cutaway of a Core Form Transformer Illustrating (a) ONAN (Self-Cooled) Cooling Action; and (b) OFAF (Forced-Cooled) Cooling Action
ABB uses a patented bypass valve on the core form design, which allows the proper thermosiphon action to function during self-cooled operation. It will also properly direct forced oil flow so that pumps can be used to an advantage during forced-cooled operation. 1.5.2.4
DIELECTRIC CHARACTERISTICS
Overvoltage and system surge conditions can cause severe stresses on the insulation system of core form transformers if the coil system is not arranged to distribute the voltage surge uniformly across the winding. The initial distribution of a voltage surge is determined by the ratio of the capacitance networks of the winding. Transformers designed for service with system ratings of 69 kV or below generally utilize a continuously wound HV coil made up of a column of disc sections separated by horizontal oil ducts. The ratio of coil-to-coil capacitance to coil-to-ground capacitance will be relatively low for this type of coil; however, additional insulation can be added in critical areas to withstand any voltage surges. Core form transformers used where system voltages are above 69 kV employ a variety of winding configurations to increase the coil-to-coil capacitance, thus improving the voltage surge distribution. HV coils for ABB Core Form Transformers in these voltage ratings are mechanically similar to the continuous wound coils, except the turns are interleaved to obtain a high series capacitance and a uniform voltage surge distribution.
30
Transformers rated above 100 MVA would require several conductors in parallel in order to carry the current in the HV coils, and the winding procedure would also be very complex. The taps in a core form winding are brought out near the center of the coil in order to not displace the electrical center of the coil. The tap leads are generally brought to a switching mechanism at the top of the core and coil assembly (see Figure 1-12). When underload taps are required, a small regulating winding is often employed. If tap sections are placed in the HV coil, thyrister devices are used between the coil sections to reduce the turn-to-turn voltage stresses.
Figure 1-12: Partial Cutaway of a Core Form Transformer Showing Coils, Insulation, and Tap Leads
31
1.6
BUSHINGS [2]
Bushings may be classified by design as follows: Condenser type: a) Oil-impregnated paper insulation, with interspersed conducting (or condenser) layers of oil-impregnated paper insulation continuously wound with interleaved lined paper layers b) Resin-bonded paper insulation, with interspersed conducting (condenser layers) c) Resin-impregnated paper insulation. Bushing in which the major insulation is impregnated with a curable epoxy resin Non-condenser type: a) Solid core or alternate layers of solid and liquid insulation b) Solid mass of homogeneous insulating material (e.g. solid porcelain) c) Gas-filled Bushings may be further classified as either having a test tap, potential tap (also referred to as capacitance, voltage tap) or not. Condenser bushings facilitate electric stress control through the insertion of floating equalizer screens made of aluminium or semi-conducting materials. The condenser core in which the screens are located decreases the field gradient and distributes the field along the length of the insulator. The screens are located coaxially resulting in the optimal balance between external flashover and internal puncture strength. Bushings, as with other electrical equipment, are bound by industry standards, which vary between international, regional and national standards for the electrical and mechanical performance of bushings. The international IEC standard has a broad global acceptance but it cannot address specific regional issues. For this reason regional standards deal with application issues such as atmospheric and seismic conditions or in some cases the interchangeability of products among different manufacturers. The rest of this section covers general information for bushing designed under ANSI/IEEE standards and will focus mainly on condenser type bushings. Similar design criteria are used under IEC standards. Parts of the section related to bushings are excerpts from the ABB Instruction Manual [3] 1.6.1
DESIGN AND CONSTRUCTION OF CAPACITANCES IN CONDENSER BUSHINGS COMPLYING WITH THE IEEE STANDARDS [4] ABB condenser bushings (e.g. Type “O Plus C”, Type AB) are designed for transformer and oil-filled circuit breaker applications. These bushings meet all applicable dimensional requirements of the IEEE Standard C57.19.01 and meet or exceed all applicable electrical and mechanical requirements of the IEEE Standard C57.19.00. They are also manufactured to meet the E.E.M.A.C. Standard.
32
A condenser bushing is essentially a series of concentric capacitors between the center conductor and the ground sleeve or mounting flange. As per the IEEE Standards C57.19.00 and C57.19.01, condenser bushings rated 115 kV and above are provided with C1 (main) and C2 (tap) capacitances. The C1 capacitance is formed by the main oil/paper insulation between the central conductor and the C1 layer/foil, which is inserted during the condenser winding process. The C2 capacitance is formed by the tap insulation between the C1 and the C2 layers. The C1 layer/foil is internally connected to the voltage tap stud whereas the C2 layer/foil is permanently connected to the grounded mounting flange. Under normal operating conditions, the C1 layer/foil is automatically grounded to the mounting flange with the help of the screw-in voltage tap cover that makes a connection between the tap stud and the mounting flange. The C2 insulation under normal operating condition is therefore shorted and not subjected to any voltage stress. When such a bushing is used in conjunction with a potential device, the voltage tap is connected to this device. Under this condition, the C1 and C2 capacitances are in series and perform like a voltage or potential divider. The voltage developed across the C2 capacitance is modified by the potential device and is used for operation of relays, and other instruments. Also, the voltage tap can be used for measuring the power factor and capacitance of C1 and C2 insulation of the bushing. In addition, this tap can be used for monitoring the partial discharge during factory tests and insulation leakage current (including partial discharge) during field service operation. For condenser bushings with potential taps, the C2 capacitance is much greater than the C1 capacitance and may be 10 times as much. Figure 1-13 shows the construction details of a typical condenser bushing with voltage rating 115kV and above.
33
CENTER CONDUCTOR
Figure 1-13: Design Details of a Typical Condenser Bushing, 115kV and Above
Condenser bushings rated 69 kV and below are provided with C1 capacitance as per the IEEE Standards. This capacitance, which is considered the main capacitance, is formed by the oil/paper insulation between the central conductor and the C1 layer/foil, which is inserted during the condenser winding process. The C1 layer/foil is internally connected to the test tap. These bushings have an inherent C2 capacitance, which is formed by the insulation between the C1 layer and the mounting flange. This insulation consists of a few layers of paper with adhesive, an oil gap between the condenser core and the mounting flange, and the tap insulator. Under normal operating conditions, the C1 layer/foil is automatically grounded to the mounting flange with the help of the screw-in test tap cover that makes a connection between the test tap spring and the flange. The C2 insulation under normal operating conditions is therefore shorted and not subjected to any voltage stress. The test tap is used for measuring the power factor and capacitance of C1 and C2 insulation of the bushing. In addition, this tap is sometimes used for monitoring partial discharges during factory tests and insulation leakage current (including partial discharge) during field service operation. For condenser bushings with power factor taps, the C2 capacitance is typically of the same order as the C1 capacitance. See Figure 1-14 for condenser design and test tap details.
34
Voltage Equalizers
Oil Impregnated Paper
C1 Layer Foil
CENTER CONDUCTOR
Test Tap
Mounting Flange (Grounded)
C1
C2
Figure 1-14: Design Details of a Typical Condenser Bushings, 69 kV And Below
For both constructions the condenser is housed in a sealed cavity formed by the upper and lower porcelain insulators, the high-strength, one-piece flange, and the metal or glass expansion domes. This cavity along with the condenser is evacuated and then filled with highly processed transformer oil for a very low moisture content and low bushing power factor. This low moisture content and low power factor is maintained throughout the life of the bushing by permanently sealing the bushing cavity. Springloaded center clamping hardware is used to apply sufficient clamping pressure to seal the bushing cavity during manufacturing. The upper and lower insulators, mounting flange, flange extension, spring assembly, sight bowl, lower support, and clamping nut form an oil-tight shell to contain the condenser and insulating oil. The sealing between components is accomplished with oil-resistant “O-rings” in grooves and/or oil-resistant flat fiber reinforced gaskets. This seal is never broken. A dehydrated nitrogen gas cushion above the oil allows thermal expansion of the oil in the sealed cavity. The oil level in the bushing can be monitored by visual inspection of the sight bowl. The mounting flange and flange extension are high-strength, corrosion-resistant aluminum. The lower support is designed to accept a variety of optional terminating devices, such as standard threaded studs, NEMA blades, or draw rod system. The upper insulator is one-piece, high-quality porcelain with sheds designed for maximum performance. ABB condenser bushings are designed to meet or exceed “Heavy Creep” requirements as described in IEEE Std C57.19.01-2000. Figure 1-15 shows a cutaway view of a 138kV type ABB condenser bushing.
35
Figure 1-15: Cutaway View of ABB Type AB Bushing 138 kV of Bushing Capacitances
1.6.2 BUSHINGS VOLTAGE TAP ABB bushings rated 115 kV and higher (e.g. Type O Plus C) have a small housing containing a voltage tap outlet just above the mounting flange. The terminal in the tap is grounded by means of a spring clip in the tap cover. This tap is connected to one of the inner foil electrodes of the condenser. In the factory, the voltage tap is tested at 20 kV, 50/60 HZ for 1 minute. Under normal operation, this tap is grounded. If the voltage tap is used in conjunction with a potential/monitoring device, the voltage between the tap and ground should be limited to 6 kV. While the purpose of the tap is to provide connection to a bushing potential device, it also provides a convenient means for making connections for measuring power factor and capacitance by the UST (Ungrounded Specimen Test) method. Many bushing users make it a practice to measure the UST power factor and capacitance at the time of installation. We endorse this practice, and it is discussed in more detail under the heading of “Maintenance.” When a connection is to be made to the voltage tap, either for use with a potential device or for power factor measurement, 36
open the housing by removing the tap cover (item 19 in Figure 1-16). Assemble the potential device connection or proceed with the power factor measurement. After the power factor measurement is completed and if there is no connection to a potential device, remove the test connection and close the housing by replacing the tap cover. Be certain the cover is on tight. If the voltage tap is used for a connection to a potential device, after the connection is assembled, remove the filler plug (Item 17, Figure 1-16) and fill the chamber with clean, dry transformer oil. Leave an expansion space of approximately one quarter of an inch at the top of the chamber when you fill it. Coat the threads on the filler plug with a suitable sealer and replace the plug in the filling hole. Be certain the plug is tight.
Figure 1-16: Sectional View of Bushing
37
WARNING: DO NOT APPLY VOLTAGE TO THE BUSHING WITH THE VOLTAGE TAP COVER REMOVED, EXCEPT WHEN USING THE BUSHING WITH A POTENTIAL DEVICE OR WHEN MEASURING POWER FACTOR. IF THE TAP IS NOT GROUNDED, THE VOLTAGE MAY EXCEED THE INSULATION DIELECTRIC STRENGTH, RESULTING IN A FLASHOVER. THE VOLTAGE ON THE TAP MUST NOT EXCEED 5 kV WHEN MEASURING POWER FACTOR. FAILURE TO FOLLOW THESE GUIDELINES COULD RESULT IN SEVERE PERSONAL INJURY, DEATH, OR PROPERTY DAMAGE. 1.6.3 1.6.3.1
CONNECTIONS INTERNAL ELECTRICAL CONNECTIONS
The method used in making connections between a bushing and the apparatus on which it is mounted will depend upon the type of connection used in the apparatus. 1.6.3.2
DRAW LEAD CONNECTED BUSHINGS
Bushings with current ratings of 800 amperes are generally designed with a hollow conductor through which a flexible cable can be pulled. The cable is considered a component of the apparatus on which the bushing is mounted and is not supplied with the bushing. 1.6.3.3
BOTTOM CONNECTED BUSHINGS
Bushings rated 1,200 amperes and higher are designed to carry the current through the center conductor. A circuit breaker interrupter or transformer terminal may be connected to the lower support of the bushing. 1.6.4 LIQUID LEVEL INDICATION The oil level in the bushing is adjusted in the factory to the normal level at approximately 25 °C. Unless there is subsequent mechanical damage to the bushing, which results in loss of oil, the filler level should be satisfactory for the life of the bushing. Since fluctuations in oil level will necessarily occur with changing temperatures, the column of oil in the bushing is topped with a compressible cushion of nitrogen gas to fill the gas space above the oil. The actual oil level can be seen on a bushing equipped with a sight glass or a prismatic oil level gage. As long as the oil level can be seen, the level is at a satisfactory height. When a low oil level is indicated, examine the bushing for possible loss of oil, which could result in eventual electrical failure. A low level exists when the pointer on a float type indicator is on “Low” or when the level has disappeared below the sight glass or prismatic gage. WARNING: DO NOT OPERATE OR TEST A BUSHING WITH A LOW INTERNAL OIL LEVEL. THIS COULD RESULT IN SERIOUS DAMAGE TO THE BUSHING, APPARATUS ON WHICH THE BUSHING IS MOUNTED, AND/OR THE TESTING EQUIPMENT BEING
38
USED. OPERATION COULD RESULT IN SEVERE PERSONAL INJURY, DEATH, OR PROPERTY DAMAGE. 1.6.5 PAINTING The metal parts at the top end are painted for protection against the weather. Care should be used to prevent scratching these painted surfaces. If the metal becomes exposed, the area should be wiped with a commercial safety solvent and then wiped dry. The cleaned area should then be coated with suitable outdoor gray enamel paint.
39
1.7
ON-LOAD TAP CHANGERS [5]
1.7.1 INTRODUCTIONS There are some differences between tap-changers used under IEEE standards and tapchangers used under IEC standards. The main differences are listed in Table 1-1 . Table 1-1: IEC and IEEE Tap Changer Differences Standard
IEC
IEEE
Designation
OLTC
LTC
Diverter switches
Arcing switch
Selector switch
Arcing tap switches
Mainly resistor type
Resistor and reactor type
Tap Selection and Acing Control Methods Current Limiting Method
The tap (regulation) winding in a load tap changing transformer is used to adjust the number of transformer winding turns, usually to keep a constant voltage on the secondary side of the transformer. If many electrical steps are required a plus/minus connection or a coarse/fine connection is used. A plus/minus connection enables the tapped winding to either add or subtract its voltage from the main winding. A coarse/fine connection enables a coarse winding to be added to the regulating winding. The switch that makes this connection is named change-over selector.
Figure 1-17: Different tap-changer connections.
On-load tap-changers must also be able to switch between the different positions without interrupting the current flow. Different designed practices are used under IEC
40
and IEEE guidelines to achieve this smooth transition. The methods are outlined in the sections below. 1.7.2 1.7.2.1
NORTH-AMERICAN PRACTICES 1 GENERAL DESCRIPTION OF LTCS
The tap or regulation winding in a load tap changing transformer is used to adjust the number of transformer winding turns, usually in the secondary or low-voltage winding and hence the transformer ratio. A regulating winding is commonly a layer type. A reversing switch, located inside the LTC mechanism, enables the regulation winding to either add or subtract its voltage from the low-voltage winding. Most LTCs have 16 mechanical tap positions, generally described as 32 electrical steps (16 above neutral and 16 below). The usual range of regulation is ±10 % of the rated line voltage. Although LTCs are built with other numbers of steps and ranges of regulation, the 32step, ±10 %, tap changing under load equipment has become a standard for many types of transformers. Voltage change must be provided smoothly and efficiently without interrupting the secondary current flow, up to and including full load at the maximum nameplate rating, plus any additional overload. When changing tap positions, the LTC mechanism must “make before break” to avoid opening the secondary circuit. This causes the taps to be connected together each time the LTC makes a voltage step. Electrically, this is a short circuit in which a circulating current flows. The method used to limit this circulating current defines the basic differences between the two types of LTC: reactance and resistance types. Both types use stationary and moving contacts. In some designs, the moving contacts are located on an arm or shaft in the center of the fixed contacts and move over the fixed contacts in a circular fashion. As the moving contacts make connection with each fixed contact, a tap change is made. 1.7.2.2
REACTANCE TYPE LTCS
Reactance type LTCs use a preventive auto transformer, usually housed in the main transformer tank and connected in series with the main low-voltage winding and regulation windings. The preventive auto transformer is always connected in the circuit and experiences circulating current each time a voltage step is made. The capacity of the preventive auto transformer must be equal to the top nameplate rating of the transformer multiplied by the step percentage of the LTC, plus sufficient capacity to account for the circulating current during operation in the bridged position. Location and construction of the preventive auto transformer can vary significantly between different manufacturers and in different applications. In most cases, it is located in the main transformer tank, sometimes on top of the main coil and core assembly. However, if the 1
Portions of this section are reprinted with permission from Electrical World Magazine, June 1995, copyright by The McGraw-Hill Companies, Inc. with all rights reserved. This reprint implies no endorsement, either tacit or expressed, of any company, product, service, or investment opportunity.
41
preventive auto transformer fails, the entire transformer must be taken out of service, and the main core and coil assembly may be contaminated with carbon and copper particles. A costly transformer repair may be the result. To reduce this possibility, the preventive auto transformer can be located in a separate tank or compartment. Reactance type LTCs are designed to operate continuously in the bridged position, thus the need for the preventive auto to carry the full load current plus the circulating current. However, a major shortcoming of the reactance type LTC is that the inherent inductance of the preventive auto transformer increases the arcing time as the fixed and moving contacts separate. Three different methods minimize the effect of this arcing and extend contact life for as long as possible between overhauls. 1.7.2.3
ARCING CONTROL METHODS
1.7.2.3.1
Arcing Tap Switch
The arcing tap switch has tandem moving contacts, known as wipe contacts, responsible for both breaking the arc and carrying the main current. Arcing takes place on both edges of the wipe contacts, while the center of the same contacts carries the load current during normal operation. The wiping action of these contacts is designed to remove carbon buildup on the main contact and improve current carrying surface (see Figure 1-18). Because the tap change operation is performed under oil, and no other device is present to reduce contact wear and coking, the contamination of oil in this type of LTC mechanism is much more severe than any other arcing-in-oil mechanism.
Figure 1-18: Arcing Tap Switch Reactance LTC
1.7.2.3.2
Arcing Switch and Tap Selector
The arcing switch-and-tap selector type has separate arcing and main current carrying contacts. Arcing occurs on transfer switches located on a separate shaft from the main current carrying contacts (see Figure 1-19). The two shafts are sequenced by a series of gears, which are precisely aligned so that all arcing occurs on the transfer switches and none on the main contacts.
42
Figure 1-19: Arcing Switch-and-Tap Selector Reactance LTC
1.7.2.3.3
Drive Mechanism for Reactance Type LTCs
Reactance type LTC systems use direct-drive mechanisms. Direct-drive mechanisms on reactance type LTC mechanisms use highly specialized gearing-and-scroll or dualslope cams to control the operating speed of the contacts and switches. When driven by a motor, speed and positioning are controlled by gears and limit switches. Motor failure, loss of power or control problems can cause the operation to stop before the tap change is complete. The result is improper contact positioning, requiring immediate and corrective action to avoid failure. If the LTC is operated manually, movement must be fast and complete to limit contact arcing. In a vacuum diverter LTC, the tap-selector contacts, diverter switches, and vacuum bottles are connected by an extensive motor-driven gear train. Limit switches stop the motor when a proper continuous operating position has been reached. In the case of drive failure, it is possible for the mechanism to stop in an off-tap position so that only one-half of the preventive auto transformer is in the circuit to carry the circulating current. Most manufacturers state that, if this occurs, the mechanism must be returned to a normal operating position as soon as possible or the transformer load must be reduced to one-half of the nameplate rating. This off-tap position can also occur in the arcing switch-and-tap selector type of reactance LTC. Several users require that the preventive auto transformer be sized twice as large as the normal center-tapped auto transformer and an alarm be included to avoid damage from this condition. Manual operation of the vacuum diverter LTC, while energized, is not recommended. If a vacuum bottle failed during a manual tap change, there would be no way to stop the tap change from being completed, possibly damaging the transformer and injuring the operator. 1.7.2.4
VACUUM INTERRUPTER TYPE LTCS
The vacuum interrupter-and-tap selector type is a significant improvement over other reactance LTC mechanisms. In effect, the arcing current is diverted from the main 43
contacts into a vacuum bottle via two diverter switches. Because the arcing contacts are housed in the vacuum bottle, there is no arcing to contaminate the oil (see Figure 1-20). Minor arcing can occur in the switches that divert the current to the vacuum bottle. Concentric drive shafts house the main current carrying contacts, diverter switches, and vacuum bottles. These drive shafts operate in a precisely timed sequence so that changes in the tap selector contacts only occur when no current is flowing. The tap selector contacts usually last for the life of the transformer, since they are not burdened with arcing and the associated contact wear. Vacuum bottle switching eliminates multiple re-strikes and sustained arcing that occurs in other types of reactance LTCs. The vacuum interrupter-and-tap selector is generally good for 500,000 operations. This compares with 50,000 to 150,000 operations for the other two reactance type LTC mechanisms. However, the complicated mechanical interlocking and precise timing required is critical to proper operation.
Figure 1-20: Vacuum Interrupter Reactance Type LTC 1.7.2.5
RESISTANCE T YPE LTCS
Resistance type LTCs place resistors in the circuit to limit the circulating current during the time that the tap change is taking place. The principal difference between resistance type LTCs and reactance type mechanisms is that the resistance type never operates continuously in the bridged position. The high-speed resistor transition type LTC (used principally in the US) moves directly from one full-cycle position to the next, using the impedance of the resistor to limit circulating currents for less than 60 milliseconds. The rotating arm of the LTC mechanism carries both moving and arcing contacts, which are electrically separate. The moving contact carries the main current, while the arcing contacts carry the arcing current that occurs during a tap change (see Figure 1-21). Because of the absence of inductance in the circuit, the arc is extinguished on the first current/voltage zero. The high speed of the mechanism also contributes to the absence of both re-strike and extended arcing. Arcing is limited to five or six milliseconds, which is the average time to reach a current zero after contact separation. However, because the bridged position is not used for continuous operation, the high-speed resistor
44
transition LTC needs 17 fixed contacts and 16 regulator winding conductors to provide the electrical tap positions. There is a second type of resistance LTC known as the resistive diverter. This type is primarily used in Europe, where it is applied to the high-voltage transformer winding. The main contacts of this mechanism are usually housed in the main transformer tank, while the arcing contacts are housed in their own compartment. Regulating Winding
Transition Resistors
Moving Main Current Carrying Contact
Figure 1-21: Resistance Type LTC 1.7.2.6
DRIVE MECHANISMS FOR RESISTANCE TYPE LTCS
Resistance type LTC systems use stored-energy drive mechanisms. The high-speed resistive transition LTC mechanism uses the motor to charge a spring. The spring cannot release its energy until it is fully charged, at which point the tap change is made. Motor failure, loss of power, or control problems cannot leave the LTC mechanism in an undesirable contact position. 1.7.2.7
FAILURE MECHANISMS FOR LTCS
From an analysis of failure statistics it is known that LTC failures can be grouped under the following systems: Electrical connections Insulation system Control system Mechanical system The typical failure mechanisms under each group are discussed below.
1.7.2.7.1
Electrical Connections
In an LTC, there are electrical connections that will not be opened during the lifetime of the unit. In addition, there are switching contacts that will be opened and closed on 45
a frequent basis. The contact surfaces of the switching contacts are typically covered with silver or an alloy of tungsten and copper. Because of the friction during the switching, small particles will rub off the contact and move around in the oil. If many particles come together, they are able to build a chain, which can create a short circuit across contacts. Furthermore, these particles change the electrical fields within the LTC and can cause partial discharges. As the contact material becomes depleted, the underlying copper surface of the contact becomes exposed. The copper and silver can react with oxygen in the oil or bond with organic components that are present in some LTCs to form copper or silver oxides. These materials form stable films on the surface of the copper and silver contacts, resulting in an increase in resistance and in contact temperature. The increase in temperature increases the deposition rate of the oxides and can lead to coking failures. Coke, a black carbon material, is a by-product of oil degradation and is generated when hydrocarbon-based insulating oils are subjected to extreme heat and arcing. The presence of water contributes to the formation of the film as well as metal oxides on all surfaces. The coking process tends to compound in nature. A point source of heat begins the process. The resulting coke forms a carbon film resistor on the contact surface, increasing mating resistance and heat by virtue of the higher I2R power loss. The added heat anneals the spring material that holds the mating surfaces together, releasing contact pressures and further adding to the problem. Eventually, the coke formation prevents the contacts from moving, and a major failure can occur when the LTC is required to make a change [6]. 1.7.2.7.2
Insulation System
Usually the insulation system of a LTC consists of oil and solid insulation materials, which depending on the construction, could be made of cardboard, fiberglass, or epoxy resin. For the most part, only the insulation capability of the oil is of concern. It is well known that oil degradation is highly dependent on temperature. Depending on the brand of oil, the degradation of oil can start even under normal operating conditions with a temperature over 60 °C. The rate of degradation significantly increases at temperatures above 80 °C. As the oil degrades, CO, CO2, H2, and hydrocarbon compounds like CH4, C2H6, C2H4, and C3H6 are generated. In addition, the insulation capability of the oil decreases. But the main destructive agent for the oil is hotspots, which are caused by joints or contacts that have developed high-resistance surfaces and interfaces. The temperature can go well over 150 °C on the connection surface. A by-product of the hotspot degradation is the generation of soot particles in the oil. In addition, the generation of some of the hydrocarbon compounds (C2H6, C2H4, and CH4) is greatly enhanced by the presence of hotspots in the LTC. The oil will also be destroyed by the high temperature of arcs, which occur during normal switching operations. Partial discharges can be created by moving particles in the oil as well as rough surfaces. As mentioned in the preceding section, at high 46
temperatures, oxygen and sulfur in the oil will react with copper and silver to form metal oxides and sulfides on joints and contacts. Excessive amounts of moisture in the oil will decrease the electric strength of the oil and enhance the possibility of discharge activity. 1.7.2.7.3
Control System
The switching of the LTC is controlled and monitored by a system of relays and RTUs. A failure of any of these components will lead to a failure of the LTC to operate. 1.7.2.7.4
Mechanism
The force to switch the LTC is generated by a motor and transmitted by gears to the contacts. The motor and the gears will age with time or develop their own set of functional problems. For example, binding in the gears or the shafts that hold the switches and contacts can slow down the switching sequence or prevent the mechanism from moving. These problems as well as material or assembling failures can cause a failure of the LTC. 1.7.3 1.7.3.1
EUROPEAN PRACTICES RESISTANCE T YPE OLTCS
Resistance type OLTC’s exist in two main types: diverter switch type and selector switch type. In both cases, transitions resistors are used to: To carry the current during the switching operation when the main contact is moving from one position to another Reduce the circulation current that will start with the switching operation when one loop in the regulation winding is short circuited The arcs during the switching operation are normally extinguished at the first current/voltage zero. The high-speed resistive transition OLTC mechanism uses the motor to charge a spring. The spring cannot release its energy until it is fully charged, at which point the tap change is made. Motor failure, loss of power, or control problems cannot stop the OLTC mechanism in an undesirable contact position because this critical part is controlled exclusively by the springs. The high speed of the mechanism also contributes to the absence of both re-strike and extended arcing. The average arcing time is five to six milliseconds, which is the average time to reach a current zero after contact separation. The time for a highspeed resistor type OLTC to switch from one position to another position is approximately 40-70 milliseconds. Loading of the springs and preparation for a new switching operation takes between 2.5-6 seconds.
47
1.7.3.2
DIVERTER SWITCH OLTC
The diverter switch OLTC consists of a diverter switch and a tap selector. The diverter switch, which breaks the arcs, is placed in a glass fiber (previously bakelite) cylinder. This cylinder is tightly sealed to prevent the arcing products from entering the transformer tank. The tap selector, which makes the connection to the tap (regulating) winding, is placed under the diverter switch. Figure 1-22 shows the layout of a typical diverter switch tap changer and Figure 1-23 shows a complete switching sequence between taps.
Figure 1-22: An ABB diverter switch tap changer of type UC.
48
Selector arm V lies on tap 6 and selector arm H on tap 7. The main contact x carries the load current.
Selector contact H has moved in the no-current state from tap 7 to tap 5.
The main contact x has opened and the arc has extinguished. The load current passes through the resistor Ry and the resistor contact y
The resistor contact u has closed. The load current is shared between Ry and Ru. The circulating current is limited by the resistor Ry plus Ru.
The resistor contact y has operated and the arc has extinguished. The load current passes through Ru and contact u.
The main contact v has closed, resistor Ru is bypassed and the load current passes through the main contact v. The on-load tapchanger is now in position 5.
Figure 1-23: Example of a switching sequence for a diverter switch type OLTC
1.7.3.3
SELECTOR SWITCH OLTC
Selector switch OLTC’s have only one compartment where both the breaking of arcs and the connection to the different taps are made. This compartment is tightly sealed to prevent arcing products from entering the transformer main tank and Figure 1-25 show a layout and a switching sequence for a typical selector switch tap changer.
49
Figure 1-24 : Selector switch tap-changers of UZ and UBB type
50
UZ design with fixed contacts in a circle and the main contact surrounded by the transition contacts at the top.
The main contact H is carrying the load current. The transition contacts M1 and M2 are open, resting in the space between the fixed contacts.
The transition contact M2 has made on the fixed contact 1, and the main contact H has been broken. After that the arc has extinguished. The transition resistor contact, M2, carries the load current.
The transition contact M1 has made on the fixed contact 2. The load current is divided between the transition contacts M1 and M2. The circulating current is limited by the resistors.
The transition resistor contact M2 has broken at the fixed contact 1, and the arc has extinguished. The transition resistor and the transition contact M1 carry the load current.
The main contact H has made on contact 2. The main contact H is carrying the load current.
Figure 1-25 : Example of a switching sequence for selector switch tap-changers
1.7.3.4
T IE-IN RESISTORS
The change-over selector is only operated when it is not carrying current. However, due to capacitive coupling to the surrounding windings, tank or core, the free floating tap winding might develop a voltage that could create a dangerous arc on the change-over selector contacts. This arcing will normally not affect the DGA in the transformer tank. If the voltage over the selector is too high, a tie-in resistor is needed to reduce it. Figure 1-26 shows a tap changer layout that used a tie-in resistor to control arcing.
51
The change-over selector is moving and the tap winding is free floating. High voltages can appear over the change-over selector.
With a tie-in resistor the voltage over the change-over selector can be reduced. There will, however, be extra losses due to the current in the tie-in resistor.
With a switch that is only closed at the time of the change-over selector movement, the tie-in losses can be avoided.
Figure 1-26: Tie-in connections 1.7.3.5
FAILURE MECHANISMS FOR OLTCS
From an analysis of failure statistics it is known that OLTC failures can be grouped under the following systems: Electrical connections Insulation system Control system Mechanical system The typical failure mechanisms under each group are discussed below. 1.7.3.5.1
Electrical Connections
The contacts where the breaking takes place are typically of copper/tungsten material. At each operation, the arcing will carbonize some oil and a small amount of the contact material will also end up in the oil. The maintenance criteria of the OLTC are set to avoid these products since they tend to lower the dielectric withstand voltage. If proper maintenance is not performed or if too much moisture enters the OLTC, the dielectric strength of the oil in the OLTC can reach a dangerous level. If a contact remains in one position for a long time (several months or years), the normal wiping action which cleans the contact surfaces during normal operation of the tap selector contacts does not occur. Consequently, the temperature in the contact might increase and led to growth of carbon particles on the surface of the contact. This will cause the temperature of the contact to increase and progressively worsens the situation. The final result is the formation of coke on the contacts. This can lead to the generation of free gas, and potentially to a flashover, which may catastrophically damage the transformer.
52
In extreme cases, the carbon growth (sometimes referred to as pyrolytic carbon growth) between and around the contacts can bind the contacts together. This condition can cause mechanical damage if an attempt is made to operate the tapchanger. Depending on the design, this may be a potential problem especially for the change-over selector in on-load tap-changers. 1.7.3.5.2
Insulation System
The insulation system of an OLTC consists mainly of oil and solid insulation materials. Depending on the construction, the solid insulation material could be made of fiberglass, epoxy resin or bakelite. In the diverter and selector switches, the oil will be degraded by the arcs even during normal switching operations. The condition of the oil and electrically stressed surfaces in the solid material will be influenced by the arcing products. Tap selectors are normally placed in the transformer tanks and therefore share oil with the main winding insulation. Since no arcs are typically generated during tap selection, there is no concern for the generation of arc-decomposition products that may degrade the oil. However, excessive amounts of moisture in the oil will decrease its electric strength and enhance the possibility of discharge activity. 1.7.3.5.3
Motor Drive Mechanism
The switching of the OLTC is performed from the OLTC motor device. This cabinet contains relays and switches. A failure of any of these components can lead to a malfunction of the control system for the OLTC. A fault in the motor drive mechanism will not lead to a tap-changer failure. 1.7.3.5.4
Mechanism
A motor is used to drive the shaft system and gears that will load the spring battery and also operate the tap selector. It is essential that the shaft system is correctly coordinated with the tap-changer, else severe failures can result. If the gear box is jammed, it can result in the motor protection stopping the motor from operating. If the wear in the gear box is abnormal, it can prevent the tap-changer from operating.
53
1.8
STREAMING ELECTRIFICATION
Inside a power transformer, the insulation between high-voltage parts (high and lowvoltage coils) and grounded parts (tank walls and iron core) is provided mainly by paper, pressboard, and low conductivity oil. In transformers with forced-oil cooling (OFAF), the oil is circulated by pumps in a closed circuit and acts additionally as a coolant for the power apparatus. Several factors have been shown to influence the likelihood of streaming electrification in transformers. These include the electrostatic charging tendency of the oil, the oil flow velocity, the conductivity of the oil, the insulation temperature, and the moisture content of the insulation. At any liquid-solid interface, and also at the contact surface between pressboard insulation and transformer oil, an uneven charge distribution can be observed. The uneven charge distribution is caused by the difference in adsorption rate of the solid surface for positive and negative ions in the liquid. In a transformer, the solid surface adsorbs typically more negative ions, forming a charge layer trapped within the pressboard. The corresponding positive charges form a mobile, diffuse layer extending into the liquid. The positive ions in the liquid are subjected to two counteracting forces: the electrostatic force keeping the ions close to their negative counterparts in the solid and the agitation of the fluid diffusing the ions to regions of lower ion concentration. Apart from the diffusion process, there is also the macroscopic flow of the liquid entraining the ions [7]. When the low-conductivity oil shears over the pressboard surface, it entrains the diffused positive part of the electric double layer, while the solid retains the corresponding negative charges on its surface. This process is called streaming electrification, where the entrained ions form a streaming current. The entrained charges may recombine with other countercharges in the liquid, be deposited on a remote solid surface, flow along with the liquid, or undergo a combination of all these processes. The accumulation of uni-polar charges on an insulated part of the structure, a process referred to as static electrification, generates a potentially dangerous voltage buildup. When the corresponding electric field surpasses a certain threshold, electrical discharges may occur, damaging the system. The damage can range from deterioration of the transformer oil to flashover between high- and low-voltage coils or between an AC coil and ground, the latter most likely leading to costly repair or replacement [8]. Figure 1-27 shows a graphical depiction of the process of streaming electrification as described above.
54
Figure 1-27: Streaming Electrification Model in Power Transformers [9]
1.8.1
CHARGING TENDENCY AND ITS EFFECT OF STREAMING ELECTRIFICATION
One of the key determinants of the risk of streaming electrification failure is the electrostatic charging tendency (ECT) of the oil. This is defined as the amount of charge generated per unit volume of oil as it flows though a specific filter and is measured in microcoulombs ( C/m3). In a transformer, it provides an indication of the capability of oil to generate charges as it flows past the surface of the cellulose in the cooling duct. It has been found that the use of oils with high ECT in a transformer result in a higher level of charge density in the transformer. This increases the risk of streaming electrification failure. The ECT is measured by forcing a specified volume of oil through a specified filter. As the oil flows through the filter, charge separation occurs. The charge collected on the filter is measured by an electrometer and is used to calculate the ECT. The changing tendency of new oils is typically in the range of 0-150 C/m3. The charging tendencies of oils in “normal” field units have been measured in the range of 5-200 C/m3. 55
Table 1-2 provides recommended limits of ECT for oils used in transformers in service. The values provided in the table are to be used only as guidelines in determining the risk of failure from streaming electrification. While most of the recorded streaming electrification failures were in transformers with ECT values greater than 500, there have been a few reported cases of failures in which the ECT was below 200. This points to the varied number of conditions and mechanisms that can lead to a streaming electrification failure. For example, if low-charging tendency oil is in a transformer that has high flow velocities, and the transformer insulation is cold (as in a startup), sufficient charge separation and accumulation can occur and increase the potential for streaming electrification failure. On the other hand, in a transformer with normal flow velocities, high-charging tendency oil at warm insulation temperatures would have reduced potential for charge separation and accumulation. The risk of streaming electrification failure would therefore be lower than the previous example. Perhaps the most important factor that determines the level of charge separation in a transformer is the flow velocity in the insulation ducts. The flow velocities in a large power transformer vary depending on the design of the insulation ducts, the number of pumps, and the volume flow rate of the cooling pumps. It is desirable to maintain as low a flow rate as possible without affecting the cooling efficiency of the transformer. For large power transformers that are a part of the installed base of inherited ABB transformers, ABB design engineers have the capability to determine the flow velocities in the cooling ducts to maintain the required cooling efficiencies. If a given transformer is found to be susceptible to streaming electrification failure, ABB can make recommendations for achieving the proper cooling efficiencies while minimizing the risk of streaming electrification. Table 1-2: Limits for Charging Tendency in Service Transformers ECT ( C/m3) <250 250-400 >400
Potential for Streaming Electrification Normal Moderate to High High
1.8.2 MITIGATION STRATEGIES FOR STREAMING ELECTRIFICATION It is assumed that streaming electrification does exist to some extent in all transformers with forced-oil cooling and especially those with directed flows. The goal is to determine how these transformers can be safely operated in a way that will keep the effects of streaming electrification under check. Several observations in a project [10] by ABB for EPRI have been made as to the causes of the electrification process and modifications to minimize these causes: The charge generation process that aggravates the electrification process is increased with flow rate and temperature. Charge relaxation, which counterbalances the generation processes, is, on the other hand, enhanced primarily by temperature. The result is that the potential for charge buildup is increased at low temperatures, when the generation processes are dominant. As 56
the temperature increases, the relaxation processes are faster and eventually overtake the generation processes. Beyond this point, the transformer can be assumed to be out of danger with regard to charge buildup and eventual failure of the insulation system. The streaming electrification process is highly dependent on the charging tendency of the insulating oil. High-charging tendency oils are likely to increase the electrification characteristics by several times. The more high-charging an oil, the more charges are generated under flow conditions. So, at low temperatures there is more likelihood of extreme charge buildup, which can lead to damaging discharges in the transformer. However, once the relaxation processes are accelerated by temperature, these dangers subside as more charges relax than are generated. It was observed that the primary source of charge generation was inside the winding ducts. The lower plenum, which has washers extending into the oil space and also the entrance regions to the ducts, were presumed to generate some charges are well. This was evidenced by high levels of charge density and streaming currents that were measured in the upper plenum oil space than what was measured in the lower plenum oil space. It was also observed that the more open and leakage ducts there were in the high-low voltage insulation of the transformer, the more charges were separated in the ducts. This indicates that it may be possible to alter the design of the ducts of a transformer so that there are fewer ducts open without sacrificing cooling capability. The height of the lower plenum oil space was found to play a very important role in the level of charge generation that occurs in the ducts and more importantly at the tips of the washers and the entrance regions to the ducts. It appears the local eddy effects generated in the lower plenum become diffused as the height of the oil space is increased. There is therefore less charge sheared from the insulation structures extending into the oil space. This may be a possible change to a problem transformer that may help alleviate the dangers of streaming electrification. It appears impurities that cause the charging tendency of the oil to increase can be absorbed or loosely bonded to the cellulose fibers. Retrofitting with lowcharging oil after draining the high-charging oil may not be sufficient to reduce electrification in the transformer. Perhaps, before oil retrofitting can be effective, the cellulose insulation must be “washed” with oil that has a high degree of solubility for impurities. This will hopefully dislodge most of the impurities from the cellulose. Retrofitting with low-charging oil may then be effective. Perhaps the most important observation was that the electrification process can be controlled via modifications of the operational processes of the transformer. Charge density measurements revealed a tremendous decrease in charge accumulation in the upper plenum beyond 50 °C, even under full pumping capabilities. The transformer can therefore be operated under reduced oil flow 57
rates until the temperature is above this critical temperature. At this point, full oil flow can be added without significant increases in charge densities and also any dangers due to streaming electrification. The same procedure will be needed for the reverse cycle. ABB further recommends that utilities should ensure that all winding temperature gauges are operational and properly calibrated; that the cooling controls operate properly and are set in the AUTOMATIC position for operation. Also, the utility should have in place operating procedures that prevent the running of all the pumps when the oil temperature is below 50 °C. The charging tendency of the oil should also be tested along with the other oil quality tests. Several oil manufacturers recommend a chemical approach to solving this issue. They focus on reduction of the ECT by using additives (inhibitors). This technique could lead to a reduction in the risk of static electrification, especially for old transformer designs.
58
2 A PRACTICAL APPROACH TO ASSESSING THE RISK OF FAILURE OF POWER TRANSFORMERS 2.1
BACKGROUND
Transformer risk assessment is one of the main branches of transformer diagnostics. It is related to strategic planning of technical and economical activities, i.e. how to manage the transformer asset with available resources. The importance and need of strategic planning is elaborated elsewhere in this handbook. However, in short it is related to the inherent conflict between a desire of operating the transformer fleet at lower cost and the requirement to retain the requested availability and reliability. A consequence of this desire is a trend of operating the transformers harder (higher, increasing loads) and for a longer period of time and at reduced costs (including reduced costs for maintenance and expertise). The transformer fleet will become older and many units will suffer an increasing risk of not being able to fulfill their function – either by a technical malfunction or by being obsolete in another way. In most western countries the average age of the transformer fleet is around 30-40 years, which is in the range where the technical failure rate is expected to increase. With the continuing ageing of transformers, it has become important to understand the factors that contribute to elevated levels of risk of failure. The goal is that if these factors are understood, then a risk of failure profile can be developed for each unit in an organization’s fleet of transformers. This information allows the organization to target appropriate strategies for mitigation, repair, upgrading, replacement, etc. for the correct set of transformers as identified by the risk of failure profiles. This section presents the general approach in a transformer risk assessment that considers several factors, including condition indicators, known design capabilities, and operational characteristics of a transformer. From these factors, a probable likelihood of failure is calculated for each transformer. Together with the relative importance of each unit to the power system, a prioritized strategy can be developed for transformers in a fleet.
2.2
LIFE MANAGEMENT PROCESS
Transformer risk assessment is a part of an overall unit oriented transformer life management process. This process has the following major ingredients: 1. A screening process to identify units for further scrutiny. 2. Condition analysis and more or less detailed design evaluation of individual units. 3. Life assessment decisions and their implementation (life extension via upgrading, relocation, replacement etc.). 59
The risk assessment is used in the fleet screening process and its primary purpose is to rank the transformers with respect to the risk. This allows us to prioritize the transformers for follow-up corrective actions such as detailed design or condition assessment, diagnostic evaluation, inspection, repair, or replacement. Another benefit of a risk assessment is that the results (or scores) of the evaluation can provide the basis for an intelligent estimation of the statistical technical risk of failure of the various units. 2.2.1
RISK ASSESSMENT
In its true sense a risk consists of two different aspects – a probability of an occurrence (e.g. a failure) during a time interval and the consequence of the occurrence. The probability of a failure is the individually adjusted hazard function or failure rate. This function depends on various technical factors – from design, service and diagnostics. The consequence represents the severity of a failure and is determined essentially from various costs of undelivered energy or power, costs of repair etc. It can also be dependent on other factors such as strategic and environmental aspects etc. In order to estimate a “true” adjusted individual failure rate, common statistical distributions are used – but modified using models that depend on the score of the technical risk. The ABB approach to fleet risk screening involves both risk aspects mentioned above. However, the functional forms of these aspects are very complex and it is difficult to determine them in an exact manner. Hence, in a first step, relative parameters are used to map the original parameters. The technical risk (of a failure) gives a value or score that depends on (or is a good estimator of) the individual failure rate. The (relative or economic) importance is a measure of the negative consequences of the failure. The result of the combined evaluation of the technical risk and importance in a risk management investigation is normally presented in either of two ways: As a Risk Index defined as a normalized product of the technical risk and relative importance as shown in Figure 2-1. In a two-dimensional diagram exemplified in Figure 2-2 and Figure 2-3 with the technical risk and the relative importance on the two axes (Preferably the true probability of failure and the true costs should be used but according to above these parameters are difficult to determine).
60
Risk Index
Technical Risk*Relative Importance
Transformer Units
Figure 2-1: Risk Index for a Number of Transformers
Figure 2-2: Risk Management Approach to Identify Transformers at Risk
61
Technical Risk
B
C
Very Urgent
A
Urgent
Priority
Normal
100
Relative Importance Figure 2-3: An Alternative Diagram for Risk Identification
The Risk Index represents the statistically expected cost due to a failure for the unit under scrutiny. In this sense the product is related to the insurance premium to be paid by the utility for keeping the unit in operation. In Figure 2-1 the Risk Index compares the expected economical consequences of a failure for the different transformers belonging to a utility. Discrimination between groups of units is clearly seen. However, using a two-dimensional diagram is probably a better way to present the results of a risk assessment. The two diagrams, Figure 2-2 and Figure 2-3, display the outcome of analyses for two example fleets of transformers that have diverse risk of failure characteristics as well as diverse relative importance. In the diagrams, each transformer in the fleet is assigned a technical risk of failure and a relative importance and is then displayed on the risk management plot. Those that fall in the (various degrees of the) Red Zone are transformers with a combination of high risk of failure and/or higher importance for the system. These are classified as Urgent (or very Urgent), or those requiring immediate action. The next transformers are those in the Yellow (Priority) Zone. Action would normally be taken on these transformers as soon as the Urgent transformers have been taken care of. The transformers in the Normal category would typically not require anything other than normal basic maintenance unless circumstances move either the risk of failure or importance to a higher value into the Yellow or Red Zone. The intent of risk management is to move the identified transformers to areas of lower risk. For example, a transformer can be moved from the Urgent zone to the normal zone by reducing the expected technical risk of failure. (The arrows A in the figures exemplify 62
this case). The process of reducing the expected risk may begin with a detailed life assessment study to identify ways of reducing the risk of failure. In the process, some of the original assumptions regarding the risk of failure may also be modified to obtain a more accurate view of the risk of failure. Actual methods for reducing the risk of failure may include refurbishment of the transformer or accessories, moving the transformer to an area with lower incidents of faults on the feeder lines, or it could involve system changes like modifying reclosing practices or trimming trees in a right of way. Another strategy of risk management involves reducing the relative importance of a transformer. This is illustrated in the figures by case B. This strategy might involve moving a higher-risk transformer to a less critical location. It might also include adding a parallel spare transformer to reduce the impact of a failure. Ideally, the actual strategies would include both types of solutions to reduce the risk of failure and reduce the criticality of the application; exemplified by the case C. 2.2.2 LAYOUT OF THE EVALUATION PROCEDURE Our risk assessment procedure focuses on the transformer functionality or suitability-for-use [11]. We address various aspects that might jeopardize or negatively influence this suitability-for-use.
Influential aspects on the suitability for use of the transformer
Technical suitability
Accessories
Mechanical suitability
Main tank
Electric suitability
Non-technical suitability
Economical incentives
Strategic reasons
Environmental reasons
Thermal suitability
Figure 2-4: Various directions of a transformer evaluation
Technical aspects include not only the traditional paper ageing aspects, but also other aspects related to short-circuit strength, electric integrity, thermal degradation and accessory failures. The focus on transformer functionality is fundamental. The aspects that are addressed are linked to situations that are potentially dangerous to the transformer operation. As can be seen in Figure 2-4, there are essentially four aspects that are considered in determining the technical risk of failure of a given transformer: 63
Mechanical aspects: This involves the risk of short circuit failure, which is based on assessment of the short circuit strength of the windings and clamping structure and the incidence and magnitude of short circuit through fault events. Thermal aspects: This involves the winding thermal condition and is based on the condition of the paper insulation. Aged, brittle insulation is more likely to fail under the mechanical stress conditions. Also, metal parts at high temperature could pose a risk to the transformer. Electric aspects: This involves the risk of dielectric failure and is based on the assessment of the dielectric withstand capability of the transformer insulation system (oil, paper, etc.) and the electrical stress imposed by the power system and naturally occurring events. Accessory failures: Failures of a transformer accessory such as a bushing, pump, or tap changer may cause a failure or loss of service of the transformer. Each of these factors will be explained in more detail later. As for the consequences or importance of a failure, the various cost factors mentioned above (undelivered power, environmental costs etc) should be evaluated. This is an exercise for the utility or the utility and ABB working together. Most often the utility ranks its transformer fleet with respect to the relative importance of the various units and assigns an evaluation value between 0 and 10 or 0 and 100. 2.2.3 EVALUATION PROCEDURE Estimating the technical risk of failure of a transformer is a complex issue involving analysis of historical failure data, knowledge of design issues, and interpretation of diagnostic test results. The evaluation procedure also involves the selection of suitable data to be used, rules and overall structure. ABB has methods of different complexity for the evaluation. The ABB approach, [12,13,14,15,16] relies heavily on deep knowledge in design, transformer manufacturing, service and transformer diagnostics. The data used for reasoning when evaluating a large number of transformers in a fleet screening must be based on easily available information in order for the evaluation to be economically reasonable. The data for reasoning is then pre-processed data based on various influential factors such as DGA, dissipation factor, oil condition, time-inoperation, size, etc. As illustrated in Figure 2-5, there are essentially two procedures used in algorithms for combining the data for reasoning.
64
I. Overall unstructured method
Data for reasoning Rules w1 w2
Total Score (Technical Risk) wN
Data for reasoning
Rules
Subgroup evaluation Mechanical Score Electric Score
Rules
II. Method structured along possible risks
wM wE
Total Score (Technical Risk)
wT Thermal Score
w..
Etc.
Figure 2-5: Procedures for obtaining the technical risk value for a transformer
Method I is an unstructured method while method II is structured according to different external stress modes – mechanical stresses, thermal stresses, electric stresses, auxiliary stresses etc. In method I the total score is obtained through a formula applied directly to the data for reasoning. Examples of such a formula are a weighing formula or a knockout criterion. In the latter case the Total Score is determined only by the parameter having the worst (maximum) influence. In method II the influential factors and data for reasoning are combined in such a way that first an evaluation of the various subgroups are made and then the risk scores of these subgroups are combined to a total evaluation. The structure of method II can be extended beyond the “influential factor” procedure to include a more detailed analysis involving design data and calculations and more condition assessment measurements. This is a more precise risk of failure estimate than performed with influential factors. It focuses on specific knowledge of the transformer design and condition, in addition to the statistical and historical parameters.
65
The reasoning rules are based on known transformer relationships. This is the method used in the Mature Transformer Maintenance Program (MTMPTM) offered by ABB. In this evaluation a more pertinent statement of the condition and risk in connection with various transformer stresses can be obtained, for example, regarding short-circuit strength, dielectric strength, insulation ageing, tap changer status and loadability. The more detailed design and condition ranking is for practical reasons applied only to a reduced number of transformers since it requires more input data. For an evaluation performed according to the structured method II, not only can a total ranking be performed but also separate rankings according to the different types of stress. The subgroup ranking can be made either when the data for reasoning is obtained from influential factors or when it comes from more detailed calculations/analyses. A final step in a ranking procedure is to scrutinize the evaluation for parameters having a large or significant single impact on the result – even if the total risk for the particular transformer is calculated to be low. Knowledge of such parameters is used to direct the engineering mitigation work. 2.2.4 PROBABILITY OF FAILURE – INDIVIDUAL FAILURE RATE The evaluation described above yields an estimation of the technical risk in a relative scale. Sometimes an absolute assessment of the individual failure rate of a unit is desired. A first approximation to this is achieved by combining the technical risk with statistical failure rate models as shown in Figure 2-6. This can be done on component (influential factor), on subgroup level and on total risk level.
STATISTICAL FAILURE RATE MODEL
(RELATIVE) TECHNICAL RISK MODIFICATION MODEL = f (Technical Risk)
INDIVIDUAL FAILURE RATE
Figure 2-6: Combination of a statistical failure rate function with a technical parameter value to obtain an estimation of the individual failure rate of the addressed transformer
66
2.3
ASSESSMENT OF THE TECHNICAL RISK OF FAILURE BY CATEGORY (MTMPTM PROGRAM)
The algorithms for technical risk of failure, as discussed above, are based on influential factors related to the individual subcategories [17,18,19]. The total technical risk is then determined either directly from these influential factors or from a combination of the assessed risks for the subcategories. To aid in the understanding of the risks for the fleet of transformers, the relative risks for each of these categories will be briefly presented. 2.3.1 MECHANICAL ASPECTS One of the more common types of failures in power transformers is a winding failure caused by the forces associated with a through-fault. As part of the risk of failure analysis, each of the transformers in the fleet is evaluated for the potential risk of short circuit failure. The influential risk factors that may be considered as part of the short circuit risk include the transformer design, the dielectric and thermal condition of the windings, the reclosing practices, and the average number of through-faults experienced by the transformer in a given year. For example, it is typically the case that transformers having a higher incidence of through-faults have the highest relative risk of short circuit failure. These transformers are generally located in substations feeding distribution lines. 2.3.2 THERMAL ASPECTS An important factor in the risk of a short circuit failure is the condition of the paper insulation. An aged transformer with brittle insulation and/or loose windings is more likely to experience a failure under the same through-fault conditions than another transformer of the same design that does not have brittle insulation or loose windings. This principle is incorporated into the risk of failure analysis by the thermal winding risk factor. Typical influential factors are the temperature, the age of the transformer insulation, the relative compositions of produced carbon oxides, the load profile and the MVA size. Another thermal risk factor is hot spots in metallic materials such as core or current carrying contacts. This risk is determined from DGA. 2.3.3 ELECTRIC ASPECTS - RISK OF DIELECTRIC FAILURE The risk of dielectric failure involves both design and condition issues. Both design knowledge and the historical information are used in this evaluation as well as the diagnostic test data. Conditions such as the dissipation factor (tan , power factor) of the insulation, oil quality results, the amount and distribution of dissolved gases in oil, and design of the over voltage protection may be used in the evaluation of the dielectric risk. 2.3.4 ASPECTS RELATED TO ACCESSORY FAILURE Accessory failure refers to the loss of service of the transformer due to either the failure or operational breakdown of an accessory. The accessories considered in this analysis include oil coolant pumps, tap changers and bushings. The risk of accessory failure is 67
based on the type of accessory and the diagnostic evidence from DGA, power factor (tan results, or other analyses. In addition, a “Random failure risk” is included in the assessment. This risk is related to external causes not associated with the design or condition of the transformer itself. It takes into account other types of failure risks not accounted for in the other factors. The parameters affecting random failure can be: the type of transformer, the location, cases where a transformer must be removed from service to de-gas the oil, loading practice etc. This type of risk also includes transformers at risk for streaming electrification due to the design type, potential high oil velocity, and/or cooling operation philosophy. 2.3.5 TOTAL TECHNICAL RISK OF FAILURE The total technical risk (or individual failure rate) is obtained either directly from method I in Figure 2-5 or (better) according to method II from a combination of each of the risk categories discussed above. The risk of failure is determined for each of the transformers in the fleet. Figure 2-7 shows a histogram of failure rates for over 200 power transformers. An indication of the relative importance of each of the transformers is also calculated based on the replacement cost for the transformer or the criticality of the transformer to system reliability. In order to develop a priority for addressing mitigation strategies for the transformers, a plot of the risk of failure vs. the importance is shown in Figure 2-8.
40
Number of Units
35 30 25 20 15 10 5
Total Failure Risk
Figure 2-7: Total Risk of Failure of Transformers
68
6.125
5.625
5.125
4.625
4.125
3.625
3.125
2.625
2.125
1.625
1.125
0.625
0.125
0
100
Relative Importance
80
A 60
40
20
B
0 0.0
1.0
2.0
3.0
4.0
5.0
6.0
Probability of Failure
Figure 2-8: Categorization of Risk (Technical Risk or probability of failure and relative importance) Profiles for Power Transformers
In this chart, the transformers are grouped into three categories: Urgent (red), Priority (yellow), and Normal (green). For each transformer in the Urgent or Priority regions (these are considered the abnormal regions), a more detailed analysis is made to identify which risk factors were prominent in placing it in that category. For those factors that are flagged, the sub-factors are analyzed to determine which underlying parameters triggered the abnormal status. All such sub-factors are summarized as the reasons for the transformer being classified in a particular abnormal category. This detailed analysis is then used as the basis of recommendations for mitigation actions. As an example, consider the transformer labeled A in Figure 2-8. Ninety-six percent of the total risk was contributed by the relative risk of accessory failure. The underlying factor for the high accessory risk factor was traced to a conditional factor associated with a leaking high-voltage bushing. On the other hand, the unit labeled B is at risk due to several factors. It has increased potential for through-fault failure due to its design and the high incidence of through-faults at the substation. In addition, its LTC is at risk for failure due to the type of LTC and the presence of certain combustible gases in the selector switch compartment. The same unit is also at risk of dielectric failure since the kV breakdown of the oil is low and the high-low insulation power factor is higher than 1%. The histogram in Figure 2-7 is also suitable when comparing the evaluation of a single transformer with the evaluation of previously evaluated units. For instance, a new transformer with the risk evaluation value 3 belongs to the upper 10 % most risky units of all units evaluated so far.
69
2.4
RISK MITIGATION
For all of the transformers identified in the Urgent or Priority category, recommended risk mitigation actions are suggested based on the underlying factors that support the high-risk evaluation. In some cases, immediate action such as replacement of an offending bushing or inspection of a tap changer can be taken to correct the situation. For other cases, additional diagnostic testing is needed to better evaluate the risk to determine the most appropriate maintenance and risk mitigation actions. In such cases, the evaluation is taken further to include also condition assessment and design assessment if possible One important risk management area is to identify spare transformers for the Urgent and Priority transformers in the system. The risk of failure ranking is used to identify which transformers to begin with. In many cases, especially those where design issues such as short circuit strength are involved, it may be more appropriate to replace a highrisk transformer with a new unit and keep the older transformer as a spare in order to reduce the risk and improve the system reliability. For a great number of the transformers that have been analyzed, the greatest risks of failure are (1) risk of accessory (bushing, tap changer, pump, etc.) failure, (2) failure due to through-fault currents caused by close-in faults on the transmission system, and (3) risk of dielectric failure due to various causes.
2.5
SUMMARY
In this section we have discussed the principle and methods for the risk assessment of power transformers that takes into consideration various risk factors that together present a comprehensive risk profile for a given transformer. Each of these risk factors is assessed based on certain condition indicators and/or the design and/or the application of the transformer. This results in a quantitative and repeatable assessment of the risk of failure. The risk of failure is used in conjunction with the relative importance of each transformer to classify the overall risk of each transformer. By understanding the underlying reasons for the risk classification of each transformer, the appropriate mitigation actions can be prescribed. Because of the quantitative nature of the analysis, mitigation options can be evaluated to determine the most cost effective means of reducing risk of failure of a given transformer. So far, this method of risk assessment has been performed on a large number of transformers, including industrial transformers, generator step-ups, and power transformers of various voltage classes and MVA sizes.
70
3 DIAGNOSIS OF TRANSFORMERS Power transformers are of prime importance for electrical power systems. The condition of a power transformer is crucial for its successful operation and, as a consequence, for the reliability of the power system as whole. During transportation or installation or under service operation, a power transformer is exposed to transient and steady-state stresses that can affect its condition as well as its useful life. In addition, transformers are subjected to a natural ageing process under service conditions. The detection of incipient faults which may be caused by insulation weakness, malfunction, defects or deterioration is of fundamental importance. So is the estimation of the ageing condition of the power transformer insulation and its main accessories. This may allow the operators to plan adequate corrective actions at an early stage. Diagnostic techniques are usually used as a means to detect fault and ageing condition in power transformers in the field. Conventional and advanced off-line diagnostic methods may be applied periodically or whenever necessary to help detect incipient faults. In some cases, modern on-line monitoring systems may be applied to continuously monitor the condition of the transformer and/or its accessories.
3.1
DIAGNOSTICS METHODS FOR POWER TRANSFORMERS AND ACCESSORIES [20]
A set of modern diagnostics methods is available and applied for oil filled power transformers and accessories. In this book, both general and advanced diagnostic methods are presented in a summarized format. General diagnostic methods include the analysis of oil quality (physical, chemical and electrical properties, as well as dissolved gases), core and core insulation analysis, winding and insulation analysis and analysis of the condition of the accessories. In addition, there are advanced diagnostic methods that address the thermal, electrical and mechanical condition of a transformer. Thermal assessment techniques are well established and are typically used to analyze the condition and remaining life of the transformer insulation. Electrical assessment includes partial discharge (PD) analysis, which is a powerful tool used to detect incipient faults in the transformer insulation. Mechanical assessment includes frequency response analysis (FRA), which is applied to detect changes in transformer winding dimensions due to deformations, displacements, shorted turns, etc. Other methods are presented in the proceeding sections. 3.1.1 DIAGNOSTIC METHODS FOR POWER TRANSFORMERS Power transformers are considered to include generator step-up transformers, transmission step-down transformers, system inter-tie transmission transformers, and 71
DC converter transformers, together with such associated equipment as shunt, series, and saturated reactors. Power transformers may be equipped with on-load and/or deenergized tap changers. Power transformers are used to reduce the costs of power transmission by transforming the voltage at which current is transmitted. Shunt and series reactor components are similar to transformers but need to absorb reactive power and limit fault currents respectively. The insulation system of a power transformer is a combination of cellulose based material impregnated with mineral insulating oil. The following cellulose materials are normally used: Kraft paper used as a turn-turn insulation; Kraft-based high density transformer board used for winding spacers and mechanical supports; and Kraft-based medium to high density transformer board used as major insulation between windings and from windings to ground. Kraft paper can also be converted into flexible creped paper and used for insulating conductors and leads. Mineral insulating oil is used as an impregnating fluid for dielectric and cooling purposes. Since the mid 1960s, thermally-upgraded Kraft paper has been used as turn-to-turn insulation in transformers. In more recent years, natural esters (vegetable oils) are being used as insulating fluids in power transformers. 3.1.1.1
STRESSES ACTING ON POWER T RANSFORMERS
The major stresses acting on a power transformer, either individually or in conjunction, are: MECHANICAL
THERMAL
DIELECTRIC
stresses between conductors, leads, and windings due to shorttime load overcurrents, fault currents mainly caused by system short circuit and inrush currents while under energization conditions stresses, due heating or local overheating, associated to short-time overload currents and leakage flux when loading above nameplate rating, or due to malfunction of the cooling systems stresses, due to system overvoltages, transient impulse conditions, or internal resonances within the windings
A definitive analysis of the subject of diagnostic tests on power transformers must take into account that the majority of diagnostic indicators are sensitive to all three fundamental stresses acting on the transformer. Therefore, the general interpretations of the outputs of the diagnostic indicators, including the localization of faults, can be problematic for a reliable evaluation of the risk of failure. The experience and interpretation capabilities of transformer experts are crucial for a successfully diagnosis. 72
The situation is also complicated because dielectric failure is often the final stage consequent to the mechanical and/or thermal stresses, especially if moisture and/or oil deterioration have already placed the transformer in a hazardous condition. This fact underscores the importance of assessing the service stresses (overvoltages, overcurrents, temperature, etc.) jointly with a detailed knowledge of the design technology and materials. The interpretation of the values and trends of the diagnostics tools must therefore be tailored to different units in order to avoid unjustified alarms. 3.1.1.2
DETERIORATION F ACTORS AND F AILURE MECHANISMS
Deterioration of the paper-oil insulation is caused by thermal stresses and is accelerated by the presence of moisture, oxygen, or high acidity compounds in the oil. The insulation is unlikely to exhibit a lower dielectric strength after deterioration, but it is more subject to rupture under mechanical stress, leading to dielectric failure as a consequence. Few transformers fail due to old age; they usually fail as a consequence of: Short circuit faults Local overheating due to circulating currents, current unbalance or the effects of leakage flux Insulation failure under electric stress (dielectric failure), perhaps as the final stage of a scenario involving previous short-circuit faults and/or local overheating, and Accessory failures (bushings, tap changers, coolers, surge-arresters, etc.). Faults can be classified as developing in one of three time scales: An immediate fault where electrical breakdown occurs within seconds of a short circuit, system overvoltage, lightning impulse surge or any other transient phenomena in the system interacting with the transformer; A local fault developing over days, weeks, or months; A deterioration of HV insulation over a period of months or years. Diagnostic techniques have been introduced mainly to detect the presence of small local faults and to monitor their development over time on a period of weeks or months. They provide evidence to plan for further investigation and remedial work to take place on a planned basis, rather than as an emergency. 3.1.1.3
DIAGNOSTIC METHODS
Table 3-1 presents the diagnostic techniques used most widely for power transformers, together with their field of application, present status, effectiveness, and specific references. Diagnostic techniques may give information on detection of incipient faults as well as about the specific source or location in a transformer structure.
73
Table 3-1: Most Important Diagnostic Techniques Used for Power Transformers
STATUS OF THE DIAGNOSTIC 3 TECHNIQUE
PROVEN EFFECTIVENESS OF THE DIAGNOSTIC 4 TECHNIQUE
A A A A A
M L H M/H H
A A
H M
ON
B
M/H
ON
B
M/H
ON ON
B A
L H
28
ON
A
M
29
OFF-S
A
L
ON ON
B B
M/H M/H
30, 31 32
OFF-S OFF-S
A A
H H
33
PROBLEMS
DIAGNOSTIC TECHNIQUES
SERVICE CONDITIONS OF THE 2 EQUIPMENT
MECHANICAL
1. Excitation Current 2. Low-voltage impulse 3. Frequency response analysis 4. Leakage inductance measurement 5. Capacitance
OFF-S OFF-S OFF-S OFF-S OFF-S
GAS-IN-OIL ANALYSIS 6. Gas chromatography 7. Equivalent Hydrogen method
THERMAL
OIL-PAPER DETERIORATION 8. Liquid chromatography-DP method 9. Furan Analysis HOTSPOT DETECTION 10. Invasive sensors 11. Infrared thermography
ON ON
REFERENCE
21 22 23
24, 25 26
27
OIL ANALYSIS 12. Moisture, electric strength, resistivity, etc. 13. Turns ratio DIELECTRIC
PD MEASUREMENT 14. Ultrasonic method 15. Electrical method 16. Power Factor and Capacitance 17. Dielectric Frequency Response
3.1.2 DIAGNOSTIC METHODS FOR BUSHINGS Bushings provide insulated terminals carrying current into and out from power apparatus, such as transformers, reactors, circuit breakers and HVDC valve halls. They additionally serve as mechanical supports for external bus and lines, as well as for internal supports, such as circuit breaker contacts.
2 3 4
OFF-S = equipment out of service at site, OFF-L = equipment out of service in laboratory, ON = equipment in service A = generally applied, B = development stage H = high, M = medium, L = low
74
Bushings are constructed to numerous design considerations, but commonly consist of: Center conductor Mounting flange Insulation (solid, fluid, plastic, or in combination) between conductor and flange The core may consist of only two terminals: the bushing center conductor; and the mounting flange/ground sleeve system In a bushing having a non-condenser body design the electric voltage will be distributed logarithmically between the conductor and the flange. In a bushing having a condenser body design, it may include strategically placed conducting wrappings or layers to uniformly distribute the voltage stresses in the core. Most high-voltage bushing designs use the condenser principle. The insulation system may be: Dry: bulk porcelain, gas, or air Wound paper and wound paper with conducting layers The wound paper core may be: Oil-immersed, in porcelain Oil-impregnated, oil-immersed Resin-bonded, either oil or gas-immersed Resin-impregnated, oil-immersed 3.1.2.1
STRESSES ACTING ON BUSHINGS
Apparatus bushings are subject to the effects of internal apparatus voltage, current, temperature, and contamination but are also subject to external atmospheric and environmental conditions as well as mechanical stresses. 3.1.2.2
DETERIORATION F ACTORS AND F AILURE MECHANISMS
Bushing insulation integrity degrades in normal service from internal moisture, internal PD and tracking from external corona, flashover and tracking from ageing, and from physical damage. Despite the intention that outdoors bushings be hermetically sealed devices, inadvertent ingress of moisture resulting from defective gasket seals and physical strain or damage is a major cause of insulation deterioration. Internal PD and tracking can be a symptom and result of internal moisture contamination, physical shrinkage of plastic or compound fillers, system overvoltage or marginal designs where there is inadequate stress distribution. External surface contamination effects can be minimized by proper housekeeping and/or by use of coatings. Bushing insulation systems do not usually deteriorate due to time alone, except where they have been subjected to unusual service conditions, such as excessive temperature or operation at voltages above the nameplate rating over long periods of time.
75
3.1.2.3
DIAGNOSTIC METHODS
Bushings are ideally suited for field-testing by dielectric diagnostics to detect and analyze defects or deterioration resulting from the conditions previously described. Bushings are commonly field tested when new to confirm factory test data and to monitor for shipping damage, and then periodically tested following system disturbances or apparatus failures and routine outages. Table 3-2 reports the diagnostic techniques used most widely on bushings alone or installed together with their field of application. The present status and effectiveness of the techniques and specific references for further description of the method are also provided. Table 3-2: Most Important Diagnostic Techniques Used for Bushings
DIAGNOSTIC TECHNIQUES
SERVICE CONDITIONS OF 5 THE EQUIPMENT
STATUS OF THE DIAGNOSTIC 6 TECHNIQUE
PROVEN EFFECTIVENESS OF THE DIAGNOSTIC 7 TECHNIQUE
REFERENCE
Moisture
Capacitance/Power Factor Tap voltage DC resistance Hot-collar
OFF-S ON OFF-S OFF-S
A A A A
H M L H
34, 35, 36, 37 34, 35, 36, 37 34, 37 37
Corona
Partial discharge (PD) Radio-influence voltage (RIV) Capacitance/Power Factor DC resistance Capacitance/Power Factor Tap voltage PD/RIV Capacitance Power Factor AC dielectric loss Infrared scanning
OFF-S ON OFF-S OFF-S OFF-S ON/OFF-S
B B A A A A A A A A
M/L M H L H M M/L M H H
37 37 34, 35, 36, 37 34, 37 34, 35, 36, 37 34, 37 34, 37 34, 37 37 37
PROBLEMS
Ageing Short-circuited condensers Internal surface leakage Poor connections
OFF-S OFF-S OFF-S ON
3.1.3 DIAGNOSTIC METHODS FOR SURGE ARRESTERS Surge arresters are used as protective devices to limit the amplitude of possible overvoltages in the electrical network. However, most of the time they are expected to function as insulators. According to service experience, most of the trouble caused by surge arresters comes from the deterioration of this "insulator function." The majority of arresters in service are still of the so called conventional type, i.e. made of the series combination of active gaps and non-linear silicon carbide (SiC) resistors, encapsulated in a porcelain housing. For this type, the withstand voltage relies mainly on the gaps, spacers, and the external grading rings used in higher voltage applications.
5 6 7
OFF-S = equipment out of service at site, OFF-L = equipment out of service in laboratory, ON = equipment in service A = generally applied, B = development stage H = high, M = medium, L = low
76
A very important feature is that the voltage distribution across the several gaps in series is controlled by "grading" non-linear resistances and also sometimes by internal capacitors. Nowadays, Metal Oxide Varistors (MOV) are able to perform the voltage clamping function as well as the insulator function: several tens of non-linear zinc oxide (ZnO) varistors are connected in series, and gaps are no longer needed in MOV arresters. 3.1.3.1
STRESSES ACTING ON SURGE ARRESTERS
In addition to the obvious electric stress, arresters are also exposed to substantial thermal stress. Sizeable temperature increase is caused by normal duty operation or by external potential redistribution due to pollution or salt in combination with rain or fog. In the latter case, internal discharges may also occur, generating reactive species that can cause internal surface deterioration in the arrester. Mechanical stresses are normally taken entirely by the porcelain insulator, whereas the active arrester parts are well protected. 3.1.3.2
DETERIORATION F ACTORS AND F AILURE MECHANISMS
The insulator function of arresters can be deteriorated in several ways: Moisture ingress: Condensation and corrosion inside the arrester can affect the dielectric withstand of insulating pieces and surfaces, and the spark-over characteristics of the gaps can also be affected. Tightness is a must for good performance of arresters. Heavy external pollution: The surface currents on heavily contaminated housings, especially for multi-unit arresters, affect the voltage distribution and may create important temperature rises, jeopardizing the grading system of conventional arresters or the blocks in MOV arresters. Discharges inside the arresters: Decomposition products resulting from gas discharges in the arrester can impair the chemical stability and the dielectric surface properties of the internal parts, especially of the varistors. Varistor deteriorations: ZnO blocks in MOV arresters, as well as grading resistors in SiC gapped type arresters, may suffer from changes of their characteristics during service. This results in higher leakage currents and losses. For conventional arresters, the final stage of deterioration is sparking at service voltage; for MOV arresters, the final stage is thermal runaway. Grading capacitor deterioration: Less frequent than grading resistor deterioration, but essentially the same effect. Gap deterioration by arrester duty: Spark-over characteristics will be affected.
The failure rate of arresters depends on the keraunic level (number of thunderstorm days/year), the system voltage, and the margin used in the selection of the rated voltage. For healthy and well-designed arresters, the failure rate should not be higher than about 1/1,000 per year.
77
Once a particular category of arresters (make, environment, age) suffers from one of the above-mentioned problems, the failure rate becomes much higher. Diagnostic techniques are then necessary to make decisions on the replacement policy. Otherwise diagnostic techniques are not likely to be more intensively used than just being included in the maintenance programs. 3.1.3.3
DIAGNOSTIC METHODS
Table 3-3 summarizes the diagnostic techniques used most widely for surge arresters, together with their field of application, present status, effectiveness, and specific references. Table 3-3: Most Important Diagnostic Techniques Used for Surge Arresters
PROBLEMS
External pollution
DIAGNOSTIC TECHNIQUES
SERVICE CONDITIONS OF 8 THE EQUIPMENT
STATUS OF THE DIAGNOSTIC 9 TECHNIQUE
CONVENTIONAL SURGE ARRESTERS - Visual inspection ON - Measurement of external leakage ON current
Heating of grading resistors
-Thermovision
Deterioration of grading system
- Leakage current under controlled voltage - Watt loss under controlled voltage - 60 Hz spark-over voltage
PROVEN EFFECTIVENESS OF THE DIAGNOSTIC TECHNIQUE 10
A ?
L L
ON
A
M
OFF-S OFF-S OFF-S
A A A
H H H
ON ON
A ?
L L
ON ON ON ON OFF-L
A A A B A
L M H H H
REFERENCE
38 38 38
METAL-OXIDE SURGE ARRESTERS
External pollution
Deterioration of varistor blocks
8
- Visual inspection - Measurement of external leakage current - Leakage current - Harmonic decomposition of leakage current - Peak of resistive current - 3rd harmonic of resistive current - Reference voltage
OFF-S = equipment out of service at site, OFF-L = equipment out of service in laboratory, ON = equipment in service
9
A = generally applied, B = development stage 10 H = high, M = medium, L = low
78
39 38 40
3.2
GENERAL DIAGNOSIS TOOLS 3.2.1
3.2.1.1
OIL QUALITY ASSESSMENT FACTORS AFFECTING THE HEALTH AND LIFE OF POWER T RANSFORMERS 11
The three main components subject to deterioration and contamination in a transformer are the paper, which is used for conductor insulation; the pressboard, which is used for the major insulation and winding support; and the insulating oil. Water, air or gas bubbles, particles of different origin, oxygen, and oil ageing products are agents of degradation. The presence of these elements in the transformer can directly reduce the dielectric strength of the insulation system or result in acceleration of the rate of ageing of the insulation system. The level of possible contamination of a transformer over years depends on its design, especially on the effectiveness of the oil preservation system, and sources of contamination. Detection of possible sources of contamination in the particular transformer is a critical step of its condition assessment. The CIGRE working group 12.18 has suggested some possible sources of typical contamination that are listed in Table 3-4. The objects of primary concern should be transformers that have poor sealing, worn-out oil pump bearings, sources of overheating, aged oil and free-breathing transformers operating with variable load. Table 3-4: Sources of Typical Contamination of Power Transformers Contaminant
Source
Water Entering as a Vapor
Direct exposure of the insulation to air during installation and inspection. Ingress by viscous movement of wet air through unsealed oil expansion systems (conservator tanks) and through loose or cracked gaskets (at flange connections). As a byproduct of the ageing of the insulation system
Liquid Water
Damaged water heat exchangers. When the transformer is under less than atmospheric pressure because of bad gaskets and loose connections (the top seal of draw-lead bushings, the seals in explosion vents, leaks through poor sealing of nitrogen blanketed transformer). Condensation in the coolest regions. From manufacturing process Dress and test dirt Oil ageing Wear of aged cellulose Overheating of metals (carbon) Carbon from OLTC Wear of the pump bearings
Particles
Storage Mode Most of the water is stored in the thin structure that operates at oil bulk temperature (20-30% of the total insulation mass). Presence of “wet zones” (typically bottom part of insulation of outer winding). Concentration in the vicinity of hotspots Bound water-in–oil. Typically on the bottom parts of the tank and coolers. Diffusion into the oil. Temperature migration. Movement of ice by oil flow.
Migration in oil. Sediment under effect of gravity, oil flow and particularly effect of electrical and electromagnetic field that attracts the conductive particles and stimulates depositing them on the winding surfaces, pressboard barriers, and bushing porcelain.
11
This section is extracted by permission from CIGRE WG12.18 – Brochure N° 227, 2003 ‘Life Management of Transformers’, CIGRE, Paris
79
Processes of insulation deterioration involve slow diffusion of water, gases, and ageing products, and therefore affect basically only a part of the insulation structure, the so called “thin structure” (conductor insulation, pressboard sheets, etc.), which comprises typically 40-60 % of the total mass. The moisture distribution is a function of the system moisture content, thermal distribution, and also the dimensions of the cellulosic insulation structures. Parts of the insulation that are in contact with less heated layers of bulk oil may have notably higher moisture content. Hydrolysis is a dominant mechanism of insulation ageing decomposition at normal operating temperature. Accordingly, adsorbed moisture and oil ageing products (acids particularly) have to be considered in order to estimate the degree of ageing. The heated mass of conductor insulation (hotspots) that is subjected to accelerating decomposition due to elevated temperature and contributes to formation of by-products, comprises typically 2-10 % of the total mass of transformer insulation. Those heated zones are usually inaccessible for visual inspection or sampling. However, water and acids affect the outer layers of insulation, which are quite accessible for inspection. Information about thermal distribution across the winding is vital to assess the ageing state of insulation. Based on these observations, a review of the methods used to assess the level of contamination in the insulation of transformers is presented below. 3.2.1.2 3.2.1.2.1
METHODS FOR ASSESSING THE Q UALITY OF T RANSFORMER OILS Dielectric Breakdown Strength (BDV)
This test measures the voltage at which the oil electrically breaks down. The test gives a good indication of the amount of contaminants (water, dirt, oxidation particles, or particulate matter) in the oil. The property is measured by applying a voltage between two electrodes under prescribed conditions under the liquid. There are two ASTM procedures: D-877, which specifies a test cup equipped with one-inch diameter vertical electrodes that are 0.100 inch apart; and ASTM D-1816, which specifies a test cup equipped with spherical electrodes spaced either 1 mm or 2 mm apart. This cup includes a stirrer and is therefore sensitive to small amounts of particulates. In the latest IEEE guide for acceptance and maintenance of insulating oils in equipment, it is stated that the preferred method for assessing the dielectric breakdown of transformer oil is the ASTM D-1816 (Note: this is at least 2000 or newer) method. This is because the electrode configuration of the D-1816 method more closely approximates transformer application. Moreover, the method provides a higher sensitivity to the presence of particles and moisture that are detrimental to the operation of transformers. 3.2.1.2.2
Interfacial Tension (IFT)
This test (ASTM D-971-99a) is used to determine the interfacial tension between the oil sample and distilled water. The oil sample is put into a beaker of distilled water at a temperature of 25 °C. The oil should float because its specific gravity is less than that of water. There should be a distinct line between the two liquids. The IFT number is the 80
amount of force (dynes) required to pull a small wire ring upward a distance of 1 cm through the water/oil interface. A dyne is a very small unit of force equal to 0.000002247 pound. Good clean oil will make a very distinct line on top of the water and give an IFT number of 40 to 50 dynes per centimeter of travel of the wire ring. As the oil ages, it is contaminated by tiny particles (oxidation products of the oil and paper insulation). These particles extend across the water/oil interface line and weaken the tension between the two liquids. The more particles are present, the weaker the interfacial tension and the lower the IFT number. The IFT and acid numbers together are an excellent indication of when the oil needs to be reclaimed. Low IFT numbers are an indication of highly contaminated oil, which can lead to sludging. If such oil is not reclaimed, sludge will settle on windings, insulation, etc., and cause loading and cooling problems. There is definitely a relationship between the acid number, the IFT, and the number of years in service. The accompanying curve (see Figure 3-1) shows the relationship and is found in many publications (this chart was originally published in the AIEE transactions in 1955). Notice that the curve shows the normal service limits both for the IFT and the acid number. 3.2.1.2.3
Acid Neutralization Number
The acid number (acidity) is the amount of potassium hydroxide (KOH) in milligrams (mg) that it takes to neutralize the acid in 1 gram (g) of transformer oil. The higher the acid number, the more acid that is in the oil. New transformer oils contain practically no acid. Oxidation of the insulation and oil forms acids as the transformer ages. The oxidation products form sludge and precipitate out inside the transformer. The acids attack metals inside the tank and form soaps (more sludge). Acid also attacks cellulose and accelerates insulation degradation. Sludging has been found to begin when the acid number reaches 0.40. At this point it is necessary to reclaim or replace the oil. The acid number is measured using the latest version of ASTM method D974. Figure 3-1 shows a plot of the relationship between acid number and interfacial tension as a function of the number of normal years of service for a transformer.
81
Figure 3-1: Interfacial Tension, Acid Number, and Years in Service 3.2.1.2.4
Power Factor
Power factor indicates the dielectric loss leakage current of the oil. A high power factor indicates deterioration and/or contamination by-products such as water, carbon, or other conducting particles; metal soaps caused by acids; attacking transformer metals; and products of oxidation. The test method for power factor is the latest version of ASTM D924, and the measurement is typically performed at 25 °C and 100 °C. Some ionic contaminants can often pass undetected at 25 °C but will reveal their presence as unacceptably high readings in the 100 °C test. ABB recommends always measuring the oil power factor at both suggested temperatures. A high power factor at 25 °C and a low power factor at 100 °C typically indicate the presence of moisture, since the moisture will evaporate at 100 °C. On the other hand, a high power factor reading at both temperatures or only at 100 °C typically indicates the presence of contaminants. 3.2.1.2.5
Test for Oxygen Inhibitor
Moisture is destructive to cellulose and even more so in the presence of oxygen. It is therefore important to mitigate the effects of the presence of oxygen in transformer oil. Oxygen inhibitors are the key to minimizing the effects of oxidation of oil. The two most common inhibitors used are 2-6 ditertiary butyl para-cresol (DBPC) and ditertiary butyl phenol (DBP). The first choice of attack by oxygen in the oil is the inhibitor molecules. This keeps the oil free from oxidation and its harmful by-products. However, as the transformer ages, the inhibitor is used up and needs to be replaced. Oxygen inhibitor content is measured using the latest version of ASTM method D2668. 3.2.1.2.6
Furan Analysis
2-Furfuraldehyde and some related substances, all belonging to a group of chemical compounds called furans, are formed when paper degrades. High furan content or a high production rate may indicate a high rate of paper degradation. When DGA results are not conclusive, furan analysis may aid the interpretation and give a more accurate
82
diagnosis. Section 3.3.2.2 provides a detailed discussion about analysis of furans in transformers. 3.2.1.2.7
PCB Content
Environmental legislation often requires that oil contaminated with PCB is given special treatment. For this reason service providers may sometimes refuse to handle oil that has not been proven to be PCB-free. There may also be strict rules for the disposal of PCB-containing oil. 3.2.1.2.8
Corrosive Sulphur
In recent years there have been a significant number of failures, in different types of equipment, due to the formation of copper sulphide in the cellulosic insulation. Also, other problems due to the action of corrosive sulphur compounds in oil have been reported. It has become apparent that commonly accepted tests for corrosive sulphur used in oil specifications (ASTM D1275 (copper strip) or DIN 51353 (silver strip)) are not adequate. Several oils that have passed these tests have caused copper sulphide formation in real life and in some cases have resulted in failure of the transformer. New tests have been developed that have higher sensitivity and are more relevant for the failure mechanisms involved. A new more severe copper strip test has been introduced (ASTM D1275 method B), and a covered conductor deposition test (“CCD”) has been developed to identify oils that may cause copper sulphide precipitation in cellulosic insulation. A simplified version of the latter test is presently under consideration as a new IEC standard test for corrosive sulphur. 3.2.1.3
MOISTURE IN T RANSFORMER INSULATION SYSTEMS [41]
The presence of moisture in a transformer deteriorates the transformer insulation by decreasing both the electrical and mechanical strength. In general, the mechanical life of non-upgraded Kraft paper insulation is reduced by the presence of moisture; the rate of thermal deterioration of the paper is proportional to its water content [42]. Recent studies performed by SINTEF Energy Research have shown that if normal life is defined as ageing under dry, oxygen-free conditions, a moisture content of 1 % in non-upgraded Kraft insulation can reduce life expectancy to 30 % of normal life. For 1 % moisture content in thermally upgraded Kraft insulation, the life expectancy is approximately 60 % of normal life. If the moisture content increases to 3-4 %, the life expectancy of the nonupgraded Kraft insulation will drop to approximately 10 % of normal life expectancy and thermally upgraded Kraft insulation will drop to approximately 25 % of normal life expectancy [43]. Electrical discharges can occur in a high-voltage region due to a disturbance of the moisture equilibrium causing a low partial discharge inception voltage and higher partial discharge intensity [44]. Water in mineral oil transformers also brings the risk of bubble formation when water from the surface of the cellulosic insulation migrates into the oil and increases the local concentration of gases in the oil [45]. In the upcoming sections we discuss the presence of water in the main components of insulation system: oil and paper.
83
3.2.1.3.1
Transformer Oil
Mineral transformer insulating oils are refined from predominantly crude oils. The refining processes could include solvent extraction, dewaxing, hydrogen treatment, or combinations of these methods to yield mineral insulating oil that meets the specification. It is mainly a mixture of hydrocarbon compounds of three classes: alkanes, naphthenes, and aromatic hydrocarbons. These molecules have little or no polarity. Polar and ionic species are a minor part of the constituents, but their presence may greatly influence the chemical and electrical properties of the oil. Polar compounds found in transformer oil usually contain oxygen, nitrogen, or sulfur. Ionic compounds are typically organic salts found only in trace quantities. Insulating oils, such as transformer oil, have a low affinity for water. However, the solubility increases markedly with temperature for normally refined naphthenic transformer oil. Water can exist in transformer oil in three states. In practical cases, most water in oil is found in the dissolved state. Certain discrepancies in examining the moisture content using different measurement techniques suggest that water also exists in the oil, tightly bound to oil molecules (bound moisture), and especially in deteriorated oil. When the moisture in oil exceeds the saturation value, there will be free water precipitated from the oil in suspension or drops. Moisture in oil is measured in parts per million (ppm) using the weight of moisture divided by the weight of oil (g/g). 3.2.1.3.2
Relative Humidity
Relative humidity can be defined in terms of the moisture –mixing ratio r versus the saturation mixing ratio rs, %RH r rs which is a dimensionless percentage. Relative humidity for air is the water vapor content of the air relative to its content at saturation. Relative humidity for oil is the dissolved water content of the oil relative to the maximum capacity of moisture that the oil can hold (the saturation limit). The higher the %RH, the closer the oil is to saturation. In a transformer, it is preferable to keep the %RH below 10-20 %, depending on voltage class (see Figure 3-2 for moisture content curves at different %RH).
84
Figure 3-2: Relative Humidity Curves for Transformer Oil 12 NOTE: Below 30 °C, the curves are not very accurate. 3.2.1.3.3
Paper (Cellulose)
The following four terms are often used interchangeably in the context of solid transformer insulation: pressboard, paper (or Kraft paper), transformer board, and cellulose. Although in the context of particular transformer insulation they may indicate different parts, e.g., paper tape, paper cylinders, transformer board cylinders, angle rings, blocks, etc. In the context of moisture equilibrium, they all generally refer to electrical-grade paper insulation manufactured from unbleached sulfate cellulose, basically consisting of a long chain of glucose rings. Insulation paper used in transformers can be completely dried, degassed, and oil impregnated. Insulation paper can be manufactured to different densities, shapes, and other properties for different applications. Water in paper may be found in four states: adsorbed to surfaces, as vapor between the cellulose fibers, as free water in capillaries, and as absorbed free water in the body of the insulation. The paper can contain much more moisture than the oil. For example, a 150 MVA, 400 kV transformer with about seven tons of paper can contain as much as 223 kg of water. If it is assumed that such a transformer contains 80,000 liters of oil and assuming a 20 ppm moisture concentration in oil, the total mass of moisture in the oil is about 2 kg. This amount is much less than the moisture in the paper. The unit for moisture concentration in paper is typically expressed in percent, which is the weight of the moisture divided by the weight of the dry oil-free pressboard.
12
From IEEE Std 62-1995
85
3.2.1.3.4
Where Does the Water Come From
Moisture can be in the insulation when it is delivered from the factory. If the transformer is opened for inspection, the insulation can absorb moisture from the atmosphere. If there is a leak, moisture can enter in the form of water or humidity in air. Moisture is also formed by the degradation of insulation as the transformer ages. Most water penetration is the flow of wet air or rainwater through poor gasket seals due to pressure differences caused by transformer cooling. During rain or snow, if a transformer is removed from service, some transformer designs cool rapidly and the pressure inside drops. The most common moisture ingress points are gaskets between bushing bottoms and the transformer top and the pressure relief device gasket. Small oil leaks, especially in the oil cooling piping, will also allow moisture ingress. With rapid cooling and the resultant pressure drop, relatively large amounts of water and water vapor can be pumped into the transformer in a short time. It is important to repair small oil leaks. The small amount of visible oil is not important in itself, but it indicates a point where moisture will enter the transformer. It is critical for life extension to keep transformers as dry and as free of oxygen as possible. Moisture and oxygen cause the paper insulation to decay much faster than normal and form acids, sludge, and more moisture. Sludge settles on windings and inside the structure, causing transformer cooling to be less efficient; therefore, the temperature rises slowly over time. Acids cause an increase in the rate of decay, which forms more acid, sludge, and moisture at a faster rate [46]. This is a vicious cycle with increasing speed, forming more acid and causing more decay. 3.2.1.3.5
Moisture Equilibrium between Oil and Paper in Transformers
Since there is more water in the cellulose than in the oil and a significant part of the protection of the transformer relies on the integrity of the cellulose insulation, it is important to know the moisture in the cellulose. Unfortunately, this cannot be measured directly without obtaining a sample of pressboard or paper from inside the transformer. Methods have been developed to estimate the moisture of the cellulose insulation from the moisture in the oil, based on the partitioning of water between the oil and the cellulose under certain conditions. When the transformer is in equilibrium operation, this provides a quick way of examining the moisture content in paper to predict future failure by measuring the moisture in oil. A set of moisture equilibrium curves is shown in Figure 3-3. The original curves have been modified to include the insulation moisture limits for different voltage classes of transformers. Given the average oil temperature of the transformer and the measured moisture content of the oil, the moisture content of the cellulose can be estimated from the chart in Figure 3-3. It can also be determined if the moisture content is excessive and action is required. Unfortunately, during regular operation of a transformer, the moisture in the oil and the cellulose are never in equilibrium. Moisture constantly migrates from the cellulose into the oil as the transformer load increases and the windings “heat” up. The reverse occurs when the load is reduced and the transformer windings “cool” down. Equilibrium is especially difficult to establish at low transformer temperatures. The situation improves somewhat as the transformer oil temperature gets above 50 °C. It is important for users of these curves to understand they may not be getting a true measure of the moisture in 86
the insulation. Advanced methods, such as the Dielectric Frequency Response (DFR) analysis allow the direct measurement of moisture in the cellulose insulation. This method is described in 3.3.3 of this handbook. 5.0
o
0C
o
o
10 C
o
20 C
o
30 C
40 C
4.5 4.0 o
50 C
% Moisture in Paper
3.5 IEEE C57.106-2002 Insulation Moisture Limits
3.0 o
60 C
2.5
69kV >69kV - <230kV 230kV
70oC
2.0 o
80 C
1.5
90oC
1.0
o
100
0.5 0.0 0
5
10
15
20
25
30
35
40
45
50
Moisture in Oil (PPM)
Figure 3-3: Oommen Curves for Low Moisture Region of Moisture Equilibrium for Paper-Oil Systems [47]. (Note: Moisture limits from C57.106-2002 and shown in Table 3-6 have been inserted into the equilibrium plots.)
In order to obtain the average temperature of the transformer, it is advisable to measure the temperature of the oil at the top and bottom oil sampling valves and then take an average. It is also advisable to use a calibrated thermometer for these measurements instead of relying on the readings of the temperature gauges. The data from the moisture equilibrium curves and the recommended limits for moisture in the solid insulation can be combined into a chart that gives the maximum allowed equilibrium moisture in the oil at any given temperature and each voltage range. This chart is shown in Figure 3-4. The chart indicates, for example, that at 60 °C the moisture content in a 145 kV transformer at equilibrium should be no more than 30 ppm, whereas for a 69 kV transformer the limit is approximately 65 ppm. Based on the measured moisture in oil, the temperature, and the voltage class of a transformer, this chart can be used to provide some indication of the moisture condition of a transformer.
87
Maximum Recommended Moisture in Oil Based on Recommended Maximum Moisture in Cellulose
Moisture Limit in Oil (ppm)
100
69kV >69 - <230kV
90 80
230kV
70 60 50 40 30 20 10 0 0
10
20
30
40
50
60
70
80
90
100
o
T emp ( C) Figure 3-4: Maximum Recommended Moisture in Oil versus Temperature 3.2.1.3.6
Cautions in Estimation of Moisture Using Moisture Equilibrium Curves
As discussed above, the moisture content of the oil samples taken from transformers can be measured using the Karl Fischer method. The moisture in the board is read from the equilibrium curves by projecting the measured moisture in oil onto the corresponding measurement temperature curve. There is potential for significant errors in this method at low temperatures and for low oil moisture contents due to the steepness of the equilibrium curves in this region. For example, if the measured moisture in oil is 10 ppm, and considering a measurement error of ±2 ppm, the moisture can range from 3.2 - 4.0 % by weight at 20 °C and between 0.8 - 1.1 % at 60 °C (see Figure 3-5). The spread is smaller at higher temperatures and much worse at lower temperatures. If this method is to be used, the temperature of the insulation must be at least 50 °C in order to get reliable results. There is also always the question about whether the transformer is ever in equilibrium during normal operation. If there are concerns about the moisture content of the insulation, it is advisable that advanced diagnostic methods, such as dielectric frequency response, be used.
88
5.0
o
o
0 C
o
10 C
o
20 C
o
30 C
40 C
4.5 4.0 o
50 C
% Moisture in Paper
3.5 3.0 o
60 C
2.5 o
70 C
2.0
o
80 C
1.5
o
90 C
1.0
o
100
0.5 0.0 0
5
10
15
20
25
30
35
40
45
50
Moisture in Oil (PPM)
Figure 3-5: Moisture Estimation Using Equilibrium Curves 3.2.1.4
LIMITS FOR MEASUREMENT OIL QUALITY PARAMETERS [48]
The following tables (Table 3-5 and Table 3-6) show the various limits for assessing moisture in a transformer as set forth in the IEEE Std. C57.106-2002. These limits can be used as guidelines in making maintenance decisions about transformers. For example, if the %RH of water in the oil is greater than 30% and the corresponding moisture in the cellulose is greater than the limit specified for the voltage class, the transformer insulation may need to be dried. It would be advisable in this situation to contact ABB. Since a dry-out is an expensive process, advanced diagnostic methods, such as Dielectric Frequency Response Analysis (DFR), can be applied to directly verify the insulation moisture measurement. An independent assessment of a fresh sample of oil would also be made to reassess the original diagnosis. Table 3-5: General Guidelines for Interpreting Data Expressed in Percent Saturation Percent Saturation, Water-in-Oil 0-5 6-20
21-30 >30
.
Condition of Cellulosic Insulation
Dry insulation Moderate—wet, low numbers indicate fairly dry to moderate levels of water in the insulation. Values toward the upper limit indicate moderately wet insulation. Wet insulation Extremely wet insulation
89
Table 3-6: Recommended Maximum Limit of Water Content in Mineral Insulating Oil of Operating Gas Blanketed, Sealed, or Diaphragm Conservator Transformers a Average Oil Temperature
b
Suggested Maximum Water Contents in mg/kg and Percent Saturation 50°C 60°C 70°C c c c mg/kg % saturation mg/kg % saturation mg/kg % saturation 27 15 35 15 55 15 12 8 20 8 30 8 10 5 12 5 15 5
69 kV >69 - <230 kV 230 kV and greater NOTES 1 - These values are, by necessity, approximate but are adequate for maximum water-in-oil guides. 2 - The oil sample should, if practical, be taken when the load and oil temperatures have been relatively constant for 48 h. The intent is to obtain a sample when the moisture content in the transformer is close to equilibrium. If the load and/or ambient are variable, the oil temperature can be maintained relatively constant by controlling the amount of cooling in operation. If you are confident that the temperature gauges are in calibration, then record the top oil temperature at the time that the sample is taken. For Oil Natural Air Natural (ONAN) and Oil Natural Air Forced (ONAF) ratings, subtract 10 °C from the top oil to obtain the average oil temperature. If you are unsure of the gauge accuracy, record the actual sample temperature and add 5 °C to approximate the average oil temperature. 3 - The above values are based on the following approximate percent by weight of water in solid insulation values (see IEEE Std 62-1995): 69 kv 3% maximum >69 - <230 kv 2% maximum 230 kv and greater 1.25% maximum 4 - Saturation values (mg/kg) at 100% saturation: 50 °C - 175 / 60 °C - 245 / 70 °C - 335 a) The data in this table is from sealed transformers and may also apply to free-breathing type transformers. b) Calculated from formulas 1 and 2 in Clause 44 from Bruce, C. M., Christie, J. D., and Griffin. Paul [49] c) Equivalent measurement is parts per million, ppm.
Table 3-7 and Table 3-8 are the recommended limits for oil quality tests performed on new and service aged transformers (always refer to the latest IEEE standards for the current suggested limits). Note that these are the suggested limits for acceptable conditions. If any measurements are beyond the suggested limits, it is advisable to take another sample to confirm the first result. If the results are confirmed, it is recommended you contact ABB for advice on further action. Table 3-9 provides some guidelines on actions to be taken based on the results of oil quality measurements. Table 3-7: Test Limits for New Mineral Insulating Oil Received in or Processed for New Equipment Test and Method 69 kV
Value for Voltage Class >69 - <230 kV 230 kV - <345 kV
345 kV and above
a
Dielectric strength , ASTM D1816-97, kV minimum, b 1 mm gap : b 2 mm gap : Dissipation factor (power factor), ASTM D924-99e1, 25°C, % maximum: 100°C, %maximum: Interfacial tension, ASTM D971-99a, mN/m minimum: Color, ASTM D1500-98, ASTM units maximum: Visual examination, ASTM D1524-94 (1999):
90
25 45
30 52
32 55
35 60
0.05 040
0.05 040
0.05 0.30
0.05 0.30
38
38
38
38
1.0
1.0
1.0
0.5
Bright and clear
Bright and clear
Bright and clear
Bright and clear
Test and Method 69 kV Neutralization number (acidity), ASTM D974-02, mg KOH/g maximum: Water Content, ASTM D1533-00, mg/kg d maximum : Oxidation inhibitor content when specified, ASTM D2668-96, Type I oil, % maximum: Type I oil, % minimum: Type II oil, % maximum: Type II oil, % minimum: Total dissolved gas, ASTM D2945-90 (1998):
c
0.015
Value for Voltage Class >69 - <230 kV 230 kV - <345 kV c c 0.015 0.015
20
10
0.3 >0.08
0.08 0.0 0.3 >0.08
10
345 kV and above c
0.015
10
0.5% or per manufacturer’s 0.5% or per e requirements manufacturer’s e requirements a) Oil dielectric testing in accordance with ASTM D877-00 has been replaced by ASTM D1816-97. b) Alternate measurements of 0.04 in and 0.08 in respectively for gaps. c) This value is more stringent than the ASTM D3487 requirement. d) Equivalent measurement is parts per million, ppm. e) This value should be obtained from a sample collected 24 to 48 hrs after the transformer is filled and applies only to transformers with diaphragm conservator systems.
Table 3-8: Suggested Limits for Continued Use of Service-Aged Insulating Oil Test and Method 69 kV
Value for Voltage Class >69 - <230 kV 230 kV and above
a
Dielectric strength , ASTM D1816-97, kV minimum, b 30 28 23 1 mm gap : b 50 47 40 2 mm gap : a Dissipation factor (power factor) , ASTM D924-99e1, o 0.5 0.5 0.5 25 C, % maximum o 5.0 5.0 5.0 100 C, % maximum Interfacial tension, ASTM D971-99a, 32 30 25 mN/m minimum Neutralization number (acidity), ASTM D974-02, 0.10 0.15 0.20 mg KOH/g maximum Water content Refer to Table 3-6 Oxidation Inhibitor Content, ASTM D2668-96, 0.09% minimum, if in original oil. Type II Oil a) Older transformers with inadequate oil preservation systems or maintenance may have lower values. b) Alternate measurements of 0.04 in and 0.08 in respectively for gaps.
91
Table 3-9: Maintenance Guidelines for In-Service Oils [50] o
Power Factor Results at 25 C 0.5%
Suggested Action Acceptable
>0.5% but 1.0%
Investigate. Oil may require replacement or clay treatment.
>1.0 but 2.0%
Investigate. Oil may cause failure of equipment. Oil may require replacement or clay treatment.
2.0%
Remove from service. Investigate. Oil may require replacement or clay treatment.
Neutralization (mg KOH/gm) Results
Suggested Action
<0.05
Acceptable
0.05 but <0.15
Clay treat or replace at convenience. For 345 kV, clay treat or replace oil in immediate future.
0.15 but <0.50
Clay treat or replace oil in immediate future.
0.50
Replace oil.
IFT (dynes/cm) Results 25
Acceptable
22 but <25
Clay treat or replace at convenience. For 345 kV, clay treat or replace oil in immediate future.
16 but <22
Clay treat or replace oil in immediate future.
<16
3.2.1.5
Suggested Action
Replace oil.
MOISTURE AND BUBBLE EVOLUTION IN T RANSFORMERS
Water in a transformer reduces the insulation capability in the active part. Water affects the electric strength, power factor, ageing, losses, and mechanical strength of the insulation [51,52]. Not only does moisture in the cellulose decrease the breakdown strength of the insulation system and increase the ageing process, there is also potential danger due to enhanced chances of partial discharge activity and eventual breakdown of the insulation. Bubbles in a transformer may arise from several causes: 1) excessive gas generation from faults, 2) nitrogen supersaturation in the case of gas-blanketed units, and 3) gas/vapor release from overload conditions, particularly for paper insulated systems such as large and medium power transformers. In experiments on gas evolution performed at ABB [53, 54, 55], the following key observations were made: o Bubble evolution temperature decreased exponentially with increasing moisture content. o Bubble evolution temperature decreased significantly with increasing gas content of oil at high moisture levels in the cellulose insulation.
92
The studies revealed that bubble evolution in paper-wrapped windings under overload conditions is significantly influenced by the moisture in paper which tends to be released as bubbles. At low moisture levels in paper, systems with low gas content and gas saturated systems behave somewhat similarly. It appears the dissolved gas is not the determining factor for bubble generation. Indeed, the data showed that bubble evolution from overload conditions may not happen below 200oC in very dry transformers, regardless of the gas content. A service aged transformer with two percent moisture may release at 140oC when overloaded. An empirical mathematical relationship to predict bubble evolution temperature [56] is shown graphically in Figure 3-6. 200
Values are calculated for 1 atmosphere
180
Bubble Evolution Temperature,
o
C
Gas Conte nt 0% 1% 2% 3% 4% 5% 6% 7% 8% 9%
160 Ze ro ga s conte nt systems
140
Observe d for N2 sa turated system s
120
100
0.0
1.0
2.0
3.0
4.0
% Moisture in Coil
Figure 3-6: Bubble Evolution Temperature vs. Moisture Content in Paper and Gas Content in Oil
If the loading guidelines suggested by IEEE Std C57.91 for transformers under various load conditions are superimposed on Figure 3-6, some rather critical decisions can be
93
made for what transformers can be operated under what load conditions. The resulting chart is shown in Figure 3-7. 200
190
Bubble Evolution Temperature,
o
C
180 Zero gas conte nt
170
Normal Life Expectancy Loading Planned Loading Beyond Nameplate
160
Long-term Emergency Loading
150
Short-term Emergency Loading
Observe d for N2 sa turated syste ms
140
130
120
110
100 0.0
1.0
2.0
3.0
4.0
% Moisture in Coil
Figure 3-7: Loading Guidelines Based on Moisture Content of Cellulose Insulation
The loading guidelines shown in Table 3-10 can be derived from Figure 3-7 and IEEE C57.91. The table should be read as follows: a transformer with approximate gas content of 9 % and moisture content of up to 2.0 % can be operated under long-time emergency conditions so long as the hottest spot temperature never exceeds 140 °C. However, it should never be operated under short-term emergency conditions. Another important observation is that transformers with insulation moisture content greater than 0.8 % may be exposed to significant risk of failure if operated under short-term emergency loading conditions.
94
Table 3-10: Loading Limits Based on Moisture Content Hottest Spot Temperature (°C) 120 130
Cellulose Moisture (%) Zero gas N2 saturated content system system 3.9 3.3 2.9 2.6
140
2.2
2.0
180
0.8
0.8
Overload Type Normal Loading Planned O/L Beyond N/P Long Time Emerg. (1-3 mo.) Short-Time Emerg. (½ -2 hrs)
Overload Level with 40°C Ambient 0% 6% 12% 40%
A word of caution should be given here regarding the preceding discussion. It is our experience that an accurate determination of the transformer hotspot temperature, especially on older transformers, can only be made after an updated engineering calculation using modern design programs. Relying on readings from hotspot gauges or on test reports may result in significant underestimation (or in some cases overestimation) of the true hotspot temperatures. Also it is important to get a proper measure of the moisture content of the paper insulation before subjecting a transformer to overload conditions. At present, the Dielectric Frequency Response method (see section 3.3.3.4) is the most accurate means of estimating the moisture content of the paper insulation in transformers. For most transformers, especially those that are continuously loaded, a more significant effect of moisture in the insulation is the increased ageing associated with the moisture in the cellulose insulation. Ageing calculations given in IEEE Std C57.91 assume dry, oxygen-free insulation. Dry insulation is assumed to be approximately 0.5% moisture or less. Field measurements done by ABB have demonstrated that most transformers in the utility network have moisture levels higher than this. Since the ageing rate of insulation is dependent on the temperature, the moisture level in the insulation, and the oxygen level in the oil, the actual ageing rates are often much higher than might be assumed for normal dry transformers.
95
3.2.2 3.2.2.1
DISSOLVED GAS IN OIL ANALYSIS (DGA) [57] INTRODUCTION
For many years the method of analyzing gasses dissolved in the oil (DGA) has been used as a tool in transformer diagnostics. The method has been used for several purposes: to detect incipient faults; to supervise suspect transformers; to test a hypothesis or explanation for the probable cause of failures or disturbances which have already occurred; and to ensure that new transformers are healthy. DGA could also be used as part of a scoring system in a strategic ranking of a transformer population. What is said about DGA for transformers is also applicable to reactors, instrument transformers and bushings. It is worth noting that DGA is a fairly mature technique and is employed by several ABB transformer companies around the world either in own plant or in co-operation with affiliated or independent laboratories. In assessing dissolved gases in oil, the rate of increase of different gases during a time interval is the most important indicator of the health of the unit. The actual gas levels may of may not be of consequence for the operation or the health of the transformer. The idea behind the use of dissolved gas analysis is based on the fact that during its lifetime, all oil/cellulose insulated systems generate decomposition gases under the influence of various stresses - both normal and abnormal. The gases that are of interest for the DGA analysis are shown in Table 3-11. Table 3-11: Dissolved Gases in Mineral Oil-filled Transformers Gas
Symbol
Hydrogen Methane Ethylene Ethane Acetylene Propene
H2 CH4 C2H4 C2H6 C2H2 C3H6
Propane
C3H8
Carbon monoxide Carbon dioxide Oxygen
CO CO2 O2
Nitrogen
N2 TDCG
Total dissolved combustible gases
Comments
Not used under ANSI/IEEE standards Not used under ANSI/IEEE standards
(=H2+CH4+C2H4+C2H6 +C2H2+CO)
All these gases except oxygen and nitrogen may be formed during the degradation of the insulation. The amount and the relative distribution of these gasses depend on the type and severity of the degradation and stress. 96
Over the years several different schemes have been proposed as evaluation schemes for DGA. Several of these techniques are presented in the IEEE Standard C57.104 and IEC Publication 60599. A number of faults can not be detected by DGA. One example is faults that are not in contact with the oil. Other examples are faults in which only very small energies are released or in which the energy is spread over a large surface or large volume. Such faults are typically associated with sporadic discharges or weak discharges. 3.2.2.2
PROCEDURE
The procedure for performing DGA consists of essentially four steps: - Sampling of oil from the transformer - Extraction of the gases from the oil - Analysis of the extracted gas mixture through gas chromatography. - Interpretation of the analysis according to an evaluation scheme. 3.2.2.3
SAMPLING
Suitable locations for sampling are valves in the cooler/radiator circuit. Because of design limitations it may not always possible to take samples from these locations. Other places from which to draw samples are the cover, bottom valve, the conservator and from the Buchholz relay. In addition, care must be taken to make sure the sample is not exposed to the atmosphere and that gases are not lost during sampling or transportation to the laboratory. For more general information about sampling of gases refer to the latest version of IEC Standard 60567 or ASTM Standard 3613. Figure 3-8 shows the sampling methodology used by ABB. 3.2.2.4
EXTRACTION
The removal of the gases from the oil can be accomplished by various methods: - Partial degassing (single-cycle vacuum extraction) - Total degassing (multi-cycle vacuum extraction) - Stripping by flushing the oil with another gas. - The head-space technique in which gases are “equalized” between a free gas volume and the oil volume. 3.2.2.5
ANALYSIS
After extraction the gas mixture is fed into adsorption columns in a gas chromatograph (GC) where the different gases are adsorbed to various degrees and reach the detector after different periods of time. In this way the gas mixture is separated into individual chemical compounds and their concentrations are calculated in volume gas at standard temperature and pressure (STP) per oil volume and expressed in parts per million (ppm). It should be emphasized that this extraction and analysis may involve analytical errors. It may therefore be difficult to directly compare results from two different laboratories. One should not jump from one lab to another but instead try to stick with one wellreputed lab. 97
SAMPLING OF OIL FOR GAS ANALYSIS Important things to consider : The syringe piston must be clean at use. Used hoses shall not be returned to ABB Transformers. Please remember to note the number of the syringe in the questionaire.
Connect the hose and T-piece to the syringe according to the picture.
Connect the hose from the sampling valve to the T-piece.
Put the hose with the T-piece in a bucket and open the valve on the transformer. Flush min. 3 times the valve and hose volume. Let the oil flow during the sampling.
Turn the handle on the syringe valve as in the picture and suck carefully in about 15 ml. of oil into the syringe.
Hold the syringe so that the valve points upwards and press the air and oil out. No airbubbles should be left.
Suck carefully 20 ml of oil into the syringe. No air bubbles shall be seen in the syringe. Close the valve on the syringe by turning the handle on the syringe valve as in the picture.
Setfo/ta 980903 KR Gasanalys provtagning engelsk
Figure 3-8: ABB Method for Sampling Oil for Gas Analysis
98
3.2.2.6
INTERPRETATION
In order to properly interpret the results of the gas analysis, it is necessary to determine the gas production rate for the period under consideration, i.e. how much the gas levels have changed over a given time period. The absolute gas levels seldom give a sufficient good basis for the interpretation. 3.2.2.7
AIR
Oxygen (O2) and nitrogen (N2) come from the air. Air contains about 20% oxygen and about 80% nitrogen. The levels in the oil could be respectively 30,000 and 80,000 ppm at air saturation. Oxygen and nitrogen have different solubility in oil. It is unusual to measure oxygen levels below 1,000 ppm and nitrogen levels below 2,000 ppm. The air content may be used to check the sampling procedure. The air content must not jump up and down between subsequent samples. If that is the case, one can suspect that the samples have not been taken with sufficient accuracy. The oxygen level could decrease at high temperatures of the oil. Oxygen is also consumed during periods of strong ageing of oil and cellulose. A small amount (up to 200 ppm) of carbon dioxide, CO2 may also come from air, but only if the oil is saturated with air (around 10%). 3.2.2.8 3.2.2.8.1
GAS SPECTRUM – TYPES OF F AULTS Hot Metal Surface
The hydrocarbons: methane (CH4), ethylene (C2H4), ethane (C2H6), propene (C3H6), propane (C3H8) etc. are mainly produced from hot oil. Acetylene (C2H2) is not produced until temperatures close to 1000 ºC. One example is glowing spots due to circulating currents in the core. The oil boils at around 320 ºC. This means that that it is difficult to obtain a stable temperature on a metal surface above this temperature limit. The oil starts to degrade already at 80-100 ºC, even if the degradation rate is very slow. One needs a higher temperature to form for example C2H4 and C3H6 than CH4 and C3H8. More gas is formed at higher temperatures. This together makes it possible to use ratios between hydrocarbons to get an estimation of the temperature around the fault. 3.2.2.8.2
Examples of Hot Metal Surfaces
The following are examples of situations in a transformer that could result in hot metal faults: A bolted joint which has lost totally or partly its clamping force A very high resistance between the cleats and leads and the bushing. A damaged draw rod or a wrongly assembled draw rod that makes a bad contact at the connection. Bad contact in soldered or welded leads. When there is a current running in the draw rod of the bushing. Sliding contacts from the selector that becomes hot with time. Currents due to stray fluxes in the tank. 99
Inadvertent grounds that create circulating currents. Increased resistance of the selector contacts for the tap changer. Circulating currents in the core. A low resistance between different core steel packages or to metallic parts or to high burrs on the sheets. Induced currents due to non compensated currents in the core window. Currents in metal pieces which should have been insulated or which have damaged insulation. Consider which joints there are in the unit, core bolts, etc. Closed loops for currents because of damaged insulation between parallel conductors. The insulation of the steel band around the core becomes damaged. 3.2.2.9
OVERHEATED CELLULOSE
Carbon oxide (CO) and carbon dioxide (CO2) come mainly from hot cellulose. They are produced at moderate temperatures (< 150 ºC) with the ratio CO/CO2 = 0.3. 3.2.2.9.1
Examples of Overheated Cellulose
Overheated conductor insulation Insulated multiple grounds which conduct a high current Parallel conductors with common covering which come into electrical contact with each other Conductors for the cleats and leads Winding conductors, obstructed cooling, loosened/wrongly positioned oil guiding ring Overcurrents because of leakage fields Circulating currents in the yoke bolts Any of the conditions in the “Hot metal surface” list that involve surfaces that are covered with cellulose. 3.2.2.10
ELECTRICAL FAULTS
Electrical faults mainly produce hydrogen (H2) and acetylene (C2H2). For a low energy partial discharge, hydrogen is the main gas that is generated. For a high energy partial discharge, acetylene and other hydrocarbons may also be found. 3.2.2.10.1
Examples of Electrical Faults
When a joint used for equalizing a potential becomes lose, one end can be at a floating potential with partial discharges. Sometimes this fault can include overheating of the cellulose Continuous strong partial discharges between parallel conductors with a certain potential difference. A strong partial discharge will sooner or later lead to a flashover Break in a soldered connection which cause partial discharges Floating potential, shielding ring, toroids Partial discharges between turns/conductors which are next to each other Partial discharges due to inadequate impregnation or air bubbles enclosed in the insulation.
100
3.2.2.11 3.2.2.11.1
FACTORS AFFECTING GAS CONCENTRATION IN TRANSFORMERS Type and Brand of Oil
Recently it has been shown that different oils show different gassing patterns. In particular, some additives, for example oxygen inhibitors, influence the gassing pattern. 3.2.2.11.2
Oxygen
It has long been known that the concentration of oxygen has an impact on the ageing of materials. The ageing of both the solid and liquid insulation materials has an impact on the gassing rate. It has been experienced that the factor of the gassing with/without oxygen is dependent on temperature. 3.2.2.11.3
Load
An increase in the load gives directly an increase in the temperature. A higher temperature gives a higher gassing rate. 3.2.2.11.4
Oil Preservation Systems
Presently, state-of-the-art gas analysis is done mostly on oil samples taken from transformer units. The interpretation of gas analysis results is based on gas-in-oil composition. Under identical conditions, a transformer with gas space allows part of the gases to be distributed into the gas space. Therefore, the gas concentration in oil would be less than the total gas generated. The three main types of oil preservation systems are illustrated in Figure 3-9. It is readily seen that only Type II comes close to preserving all the gases in the oil. While both Types I and II are sealed systems, Type III allows gases to be lost to the atmosphere.
Figure 3-9: Oil Preservation Systems for Power Transformers
If there are increasing levels of nitrogen, oxygen, and carbon dioxide in a conservator type transformer, there is a possibility the tank has a leak or the oil may have been poorly processed. In this case, it is advisable to check the diaphragm or bladder for leaks and to check for oily residue around the Buchholz relay and other gasketed openings. There should be fairly low nitrogen and especially low oxygen in a
101
conservator type transformer. With time some air could leak through the bladder and raise the oxygen and nitrogen levels. 3.2.2.11.5
Gas Mixing
Concentration of gases in close proximity to an active fault will be higher than in the DGA oil sample. As distance increases from a fault, gas concentrations decrease. Equal mixing of dissolved gases in the total volume of oil depends on time and oil circulation. If there are no pumps to force oil through radiators, complete mixing of gases in the total oil volume takes longer. With pumping and normal loading, complete mixing equilibrium should be reached within a few days and will have little effect on DGA if an oil sample is taken then or long after a problem begins. 3.2.2.11.6
Temperature
There is an old chemist's rule of thumb stating that a small increase in temperature (515 ºC) can yield a two or threefold increase in gassing rate. The basic explanation of this phenomenon is found in the well-known Arrhenius equation, which holds true for most chemical reactions. Gas production rates increase exponentially with temperature and directly with volume of oil and paper insulation. Temperature decreases as the distance from the fault increases. Temperature at the fault centre is highest, and oil and paper there will produce the most gas. As distance from the fault increases the temperature decreases, and the rate of gas generation also decreases. Because of the volume effect, a large heated volume of oil and paper can produce the same amount of gas as a smaller volume at a higher temperature. It is impossible to tell the difference by just analyzing the DGA. It is important to note that the ambient temperature directly influences the gassing rate. If there is a fault, the higher the ambient temperature, the higher would be the gassing rate. A gas generation chart [58] [59] is shown in Figure 3-10. Note that temperatures at which gases form are only approximate. Moreover, the figure is not drawn to scale and is only to be used for purposes of illustrating temperature relationships, gas types, and quantities as fault temperature vary in a transformer. These relationships represent what generally has been proven in controlled laboratory conditions using a mass spectrometer. The vertical band at left side of the chart shows what gases and approximate relative quantities are produced under partial discharge conditions (low energy discharge events). The total hydrogen produced by a partial discharge in oil could be as much as 75% of the total gases, the remaining part being composed of small percentages of hydrocarbons, in decreasing order C2H2 > CH4 > C2H4 > C2H6. With paper or pressboard added to the system, some CO is also produced. Discharges in cellulose alone produce CO and H2 in large quantities, in approximately equal quantities. Various gases begin forming in a transformer at specific temperatures. From Figure 3-10 we can see relative amounts of gas as well as approximate temperatures. Hydrogen and methane begin to form in small amounts around 150 °C. Methane (CH4), 102
ethane (C2H6), and ethylene (C2H4) production peaks at certain temperatures and declines as temperature increases beyond the peak. At about 250 °C, production of ethane (C2H6) starts. At about 350 °C, production of ethylene (C2H4) begins. This suggests that low temperature thermal faults will produce virtually no ethylene, but plenty of ethane and methane. Acetylene (C2H2) starts above 700 °C. This indicates that a thermal fault of greater than 700 °C can produce trace amounts of acetylene. Larger amounts of acetylene may only be produced above 900 °C and by internal arcing. The C2H4/C2H6 ratio is a good indicator of the hotspot temperature for mild to moderate cases of overheating. The following expression is generally used as an approximation of the oil decomposition temperature in terms of the C2H4/C2H6 ratio [60]:
T ( o C ) 100
C2 H 4 C2 H 6
150
Figure 3-10: Combustion Gas Generation versus Temperature 3.2.2.11.7
Gas Solubility in Oil
Transformers with gas space above oil have the possibility of distribution of gases between the liquid and gas space. These gases, except for the nitrogen in the gas space and trace amounts of oxygen, are generated during transformer operation and afterwards distribute between the oil and gas space according to the laws of distribution. In a closed system, if gas generation proceeds at a slow rate, and mixing is effective, equilibrium is attained soon. The deciding factors in gas distribution are the solubility of 103
the gas in the liquid medium and the prevailing temperature. The more soluble gases would be found in a higher proportion in the oil than the less soluble ones. On the other hand, the less soluble gases would be found in a higher proportion in the gas space. The solubility of gases in oil varies with temperature and pressure. The solubility of all transformer gases increase proportionally with pressure. The solubility of hydrogen, nitrogen, carbon monoxide, and oxygen increases with temperature. The solubility of carbon dioxide, acetylene, ethylene, and ethane decreases with increasing temperature. The solubility of methane remains almost constant with temperature. Figure 3-11 shows the distribution coefficient (or Ostwald coefficient) of gases at 1 atmosphere. These coefficients are used to compute the gas space concentration corresponding to the concentration in oil and vice versa.
Gas Solubility Coefficients in Oil
10
1
CO2
C2H6 C2H4 C2H2
CH4 O2 CO N2
0.1
H2
0.01 0
20
40
60
80
100
o
Temperature ( C)
Figure 3-11: Gas Distribution Coefficients at 1 Atmosphere
From the chart it is clear that the solubility of acetylene in oil is much greater than that of hydrogen in oil. Indeed at 25 °C and 1 atmosphere, the solubility of acetylene is 122 % and that of hydrogen is 5.6 %. It is clear that transformer oil has a much greater capacity for dissolving acetylene than hydrogen. It should be noted that gas from the gas space is lost as the pressure in the gas space is released. 3.2.2.11.8
Other Factors
Below is a list of factors that are known to influence the gassing rate. However, there is presently no consensus on how the individual factors affect the gassing rate.
104
-
-
-
-
-
-
Temperature distribution in the oil and in the cellulose Since the gassing is strongly temperature dependent, the temperature distribution will be important for the gassing. Average winding temperature When the temperature distribution is not exactly known, the average winding temperature rise could be a good approximation. Ambient temperature Governs the absolute temperatures in the transformers Oil production process It has been shown that how the oil is manufactured can influence the gassing. The oil production process could be more or less harmful to the oil. Transformer history What the transformer has gone through could be accumulated in the insulation. The most common cases are when gasses are dissolved in the cellulose and released at degassing or at temperature changes Repair Tests No load loss test Electrical tests Unaged insulation material New cellulose has weak links in the material, which are cut early in the ageing process, giving higher gassing rates in the beginning Type of cellulose insulation: The manufacturing processes and the ingredients in the board have an influence on the gassing rate Kraft, Insuldur, Thermally upgraded Pressboard -
-
-
Low density, High density Laminated wood Different manufacturers Laminated polyester or casein glued board
Type of design: Since the gassing is measured in ppm/day or ml/day, it is of importance the volumes of oil, solid insulation and its ratio. Size = rating Oil volume Solid insulation volume Design materials: It has been shown that many design materials have impact on gassing. Most famous is perhaps inadequately cured epoxy inside radiators and reactor cheeses that produces hydrogen. Another famous type of material is the catalytic material. Among this group are zinc and stainless steel in transformers; as well as core steel insulation. These materials also enhance hydrogen production : Glue, Epoxy Paint 105
-
Zinc Stainless steel Phenomenon Transport in and out of insulation: It has been shown that the solubility of carbon oxide (CO) and carbon dioxide (CO2) is temperature dependent. This means that the content of these gases will change when the temperature changes. These gases will go out into the oil to a certain extent when the oil gets colder. “Sweating”: If the level of a particular gas in the solid insulation is high, it could take a substantial amount of time before the gas in the insulation is in equilibrium with the gas in the oil.
3.2.2.12 3.2.2.12.1
DGA INTERPRETATION METHODS Key Gas Method of Interpreting DGA
In this method, one looks for the most prominent gas - the one which differs most from an expected "normal" level (or change). For example, during overheating of cellulose the main decomposition gases are CO and CO2. During a partial discharge or corona activity, H2 is formed. If the partial discharges involve cellulose, carbon oxides will be present as well. During a more severe electric discharge, for example arcing, C2H2 will be produced. Normally H2 and smaller amounts of CH4 and C2H6 will also be produced during arcing discharges. Further, if cellulose is involved in the fault, CO will be produced. If oil is overheated, the hydrocarbons are the main gases produced – normally the saturated hydrocarbons such as C2H6 at lower temperatures and unsaturated hydrocarbons such as C2H4 at higher temperatures. At very high temperatures, overheated oil will produce C2H2. CO2, O2 and N2 can also be absorbed from the air if there is an oil/air interface or if there is a leak in the tank. For Type I preservation systems that have a nitrogen blanket, nitrogen in the oil may be near saturation. As described above, each key gas is identified with a certain type of fault. There are four fault patterns that can be associated with key gases as shown in Table 3-12. The key gas is frequently the predominant gas in the mixture of generated gases in the oil, but occasionally another gas could be in high concentration. Such variations are possible, because over a wide range of temperatures each gas attains a maximum generation rate at a certain temperature. Depending on the temperature present at the fault site, one gas or the other may be in larger proportion. It should be noted that small amounts of H2, CH4, CO2, and CO are produced by normal ageing. Thermal decomposition of oil-impregnated cellulose produces CO, CO2, H2, CH4, and O2. Substantial decomposition of cellulose insulation begins at only about 100°C or less. Faults will produce internal hotspots of far higher temperatures than these, and the resultant gases show up in the DGA.
Table 3-12: Key Gas and Fault Type Guide
106
Fault Pattern Conductor Overheating
Oil Overheating
Key Gas
Secondary Gases
CO2/CO (Carbon Oxides)
CH4 and C2H4 if the fault involves an oil-impregnated structure
C2H4 (Ethylene)
CH4 and smaller quantities of H2 and C2H6. Traces of C2H2 if fault is severe or involves electrical contacts.
Metal discoloration. Paper insulation destroyed. Oil heavily carbonized.
Partial Discharge
H2 (Hydrogen)
CH4 and minor quantities of C2H6 and C2H4
Arcing
C2H2 (Acetylene)
H2, and minor quantities of CH4, C2H4
3.2.2.12.2
Possible Findings Discoloration of paper insulation. Overloading and/or cooling problem. Bad connection in leads or tap changer. Stray current path and/or stray magnetic flux.
Weakened insulation from ageing and electrical stress. Pinhole punctures in paper insulation with carbon and carbon tracking. Possible carbon particles in oil. Possible loose shield, poor grounding of metal objects. Metal fusion, (poor contacts in tap changer or lead connections). Weakened insulation from ageing and electrical stress. Carbonized oil. Paper destruction if it is in the arc path or is overheated.
Individual and Total Dissolved Key-Gas Concentration Method
A four-condition DGA guide to classify risks to transformers with no previous problems has been developed in IEEE C57.104 [61]. The guide uses combinations of individual gases and total combustible gas concentration. This guide is not universally accepted and is only one of many tools used to evaluate transformers. The four conditions are defined below: Condition 1: Total dissolved combustible gas (TDCG) below this level indicates the transformer is operating satisfactorily. Any individual combustible gas exceeding specified levels in Table 3-13 should have additional investigation. Condition 2: TDCG within this range indicates greater than normal combustible gas level. Any individual combustible gas exceeding specified levels in Table 3-13 should have additional investigation. A fault may be present. Take DGA samples at least often enough to calculate the amount of gas generation per day for each gas (see Table 3-14 for recommended sampling frequency and actions). Condition 3: TDCG within this range indicates a high level of decomposition of cellulose insulation and/or oil. Any individual combustible gas exceeding specified levels in Table 3-13 should have additional investigation. A fault or faults are probably present. Take DGA samples at least often enough to calculate the amount of gas generation per day for each gas (see Table 3-14). Condition 4: TDCG within this range indicates excessive decomposition of cellulose insulation and/or oil. Continued operation could result in failure of the transformer (see Table 3-14). If TDCG and individual gases are increasing significantly (more than 30 ppm/day), the fault is active and the transformer should be de-energized when Condition 4 levels are reached. A sudden increase in key gases and the rate of gas production is more important in evaluating a transformer than the amount of gas. One exception is 107
acetylene (C2H2). The generation of any amount of this gas above a few ppm indicates high energy arcing. Note however, that trace amounts (a few ppm) can be generated by a very hot thermal fault (500 °C). One-time arcs caused by a nearby lightning strike or a high-voltage surge can also generate acetylene. If C2H2 is found in the DGA, oil samples should be taken weekly to determine if additional acetylene is being generated. If no additional acetylene is found and the level is below the IEEE Condition 4, the transformer may continue in service. However, if acetylene continues to increase, the transformer has an active high-energy internal arc and should be taken out of service. Further operation is extremely hazardous and may result in catastrophic failure. Table 3-13 assumes that no previous DGA tests have been made on the transformer or that no recent history exists. If a previous DGA exists, it should be reviewed to determine if the situation is stable (gases are not increasing significantly) or unstable (gases are increasing significantly). Deciding whether gases are increasing significantly depends on the particular transformer. Table 3-13: Dissolved Key Gas Concentration Limits in Parts Per Million (ppm) CO (Carbon Monoxide) Condition 1 100 120 1 50 65 350 Condition 2 101-700 121-400 2-9 51-100 66-100 351-570 Condition 3 701-1,800 401-1,000 10-35 101-200 101-150 571-1,400 Condition 4 >1,800 >1,000 >35 >200 >150 >1,400 * CO2 is not included in adding the numbers for TDCG because it is not a combustible gas
Status
H2 (Hydrogen
CH4 (Methane
C2H2 (Acetylene
C2H4 (Ethylene
C2H6 (Ethane
CO2 (Carbon Dioxide) 2,500 2,500-4,000 4,001-10,000 >10,000
TDCG 720 721-1,920 1,921-4,630 >4,630
Compare the current DGA to earlier DGAs. If the production rate (ppm/day) of any one of the key gases and/or TDCG (ppm) has suddenly gone up, gases are probably increasing significantly. Refer to Table 3-14, which gives suggested actions based on total amount of gas in ppm and rate of gas production in ppm/day. Before going to Table 3-14, determine transformer status from Table 3-13; that is, look at the DGA and see if the transformer is in Condition 1, 2, 3, or 4. The condition for a particular transformer is determined by finding the highest level for any individual gas or by using the TDCG. If the TDCG number shows the transformer in Condition 3 and an individual gas shows the transformer in Condition 4, the transformer is in Condition 4. Always be conservative and assume the worst until proven otherwise [62].
108
Table 3-14: Actions Based on Dissolved Combustible Gas Conditions
Condition 1
Condition 2
Condition 3
Condition 4
TDCG Level or Highest Individual Gas (See Table 4) 720 ppm of TDCG or highest condition based on individual gas from Table 3-13
721-1,920 ppm of TDCG or highest condition based on individual gas from Table 3-13 1,941-4,630 ppm of TDCG or highest condition based on individual gas from Table 3-13 >4,630 ppm of TDCG or highest condition based on individual gas from Table 3-13
TDCG Generation Rates (ppm/Day) <10
Sampling Intervals and Operating Actions for Gas Generation Rates Sampling Interval
10-30 >30
Annually: 6 months for EHV transformers Quarterly Monthly
<10
Quarterly
10-30
Monthly
>30
Monthly
<10
Monthly
10-30
Weekly
>30
Weekly
<10
Weekly
10-30
Daily
>30
Daily
Operating Procedures Continue normal operation.
Exercise caution. Analyze individual gases to find cause. Determine load dependence. Exercise caution. Analyze individual gases to find cause. Determine load dependence.
Exercise extreme caution. Analyze individual gases to find cause. Plan outage. Call manufacturer and other consultants for advice. Exercise extreme caution. Analyze individual gases to find cause. Plan outage. Call manufacturer and other consultants for advice. Consider removal from service. Call manufacturer and other consultants for advice.
NOTES: 1. Either the Highest Condition Based on Individual Gas or Total Dissolved Combustible Gas can determine the condition (1, 2, 3, or 4) of the transformer. For example, if the TDCG is between 1,941 ppm and 2,630 ppm, this indicates Condition 3. However if hydrogen is greater than 1,800 ppm, the transformer is in Condition 4, as shown in Table 3-13. 2. When the table says “determine load dependence,” this means, if possible, find out if the gas generation rate in ppm/day goes up and down with load. Perhaps the transformer is overloaded. Take oil samples every time the load changes; if load changes are too frequent, this may not be possible. NOTES: 3. Either the highest condition based on individual gas or total dissolved combustible gas can determine the condition (1, 2, 3, or 4) of the transformer. For example, if the TDCG is between 1,941 ppm and 2,630 ppm, this indicates Condition 3. However if hydrogen is greater than 1,800 ppm, the transformer is in Condition 4, as shown in Table 3-13. 4. When the table says “determine load dependence,” this means, if possible, find out if the gas generation rate in ppm/day goes up and down with load. Perhaps the transformer is overloaded. Take oil samples every time the load changes; if load changes are too frequent, this may not be possible. 5. To get TDCG generation rate, divide the change in TDCG by the number of days between samples that the transformer has been loaded. Down-days should not be included. The individual gas generation rate ppm/day is determined by the same method.
Sampling intervals and recommended actions: When sudden increases occur in dissolved gases, the procedures recommended in Table 3-14 should be followed. Table 3-14 is paraphrased from Table 3 in IEEE C57.104-1991. The table indicates the recommended sampling intervals and actions for various levels of TDCG in ppm. An increasing gas generation rate indicates a problem of increasing severity; therefore, as the generation rate (ppm/day) increases, a shorter sampling interval is recommended (see Table 3-14). Some information has been added to the table from IEEE C57-104-1991 as can be inferred from the text. If the cause of the gassing can be determined and the risk can be assessed, the sampling interval may be extended. For example, if the core is tested 109
with a M -meter and an additional core ground is found, even though Table 3-14 may recommend a monthly sampling interval, an operator may choose to lengthen the sampling interval since the source of the gassing and generation rate is known. A decision should never be made on the basis of just one DGA. It is very easy to contaminate the sample by accidentally exposing it to air. Mishandling may allow some gases to escape to the atmosphere and other gases, such as oxygen, nitrogen, and carbon dioxide, to migrate from the atmosphere into the sample. If you notice a transformer problem from the DGA, the first thing to do is take another sample for comparison. 3.2.2.12.3
Rogers Ratio Method
In interpreting gas analysis results, relative gas concentrations are found to be more useful than actual concentrations. For most purposes, only five gas concentrations (H2, CH4, C2H6, C2H4, and C2H2) are sufficient. According to the scheme developed by R.R. Rogers [63] and later simplified by the IEC, three gas ratios define a given condition. It is important to note that in developing the ratio analysis, Rogers considered gas measurements from mostly conservator type transformers with open expansion tanks (Type III transformers). Like the key gas analysis discussed above, this method does not provide guaranteed answers, but is only an additional tool to use in analyzing transformer problems. The three-ratio version of the Rogers Ratio Method uses the following ratios: R1 = C2H2/C2H4 R2 = CH4/H2 R3 = C2H4/C2H6
Note that the Rogers Ratio Method is for analyzing faults and not for detecting the presence of faults. Its use requires the establishment of a problem based on the total amount of gas (using IEEE limits) or increased gas generation rates. A good system to determine whether there is a problem is to use Table 3-13 (latest version) in the Key Gas Method. If two or more of the key gases are in Condition 2 and the gas generation is at least 10% per month of the L1 limit (Table 3-17), there is a high likelihood of a problem. If a gas used in the denominator of any ratio is zero, or is shown in the DGA as not detected (ND), use the detection limit of that particular gas as the denominator. This gives a reasonable ratio to use for diagnosis. A further refinement in applying the ratio methods is to subtract gases that were present prior to any sudden gas increases. This takes out gases that have been generated up to the point of analysis due to normal ageing and prior problems. This is especially true for ratios involving gases that are generated during normal ageing, H2, and the cellulose insulation gases CO and CO2 [64]. In using these ratios, it is advisable to never make a decision based only on a ratio if either of the two gases used in that ratio is less than 10 times the amount the gas chromatograph can detect [64]. This rule makes sure that instrument inaccuracies have little effect on the ratios. If either of the gases is lower than 10 times the detection limit, it 110
is most likely that the transformer does not have the particular problem that this ratio deals with. When a fault occurs inside a transformer, there will be more than enough gases present to make the ratios valid. Detection limits for the key gases are shown in Table 3-15. Table 3-15 also provides possible diagnoses based on the values of the three ratios. Table 3-15: Rogers Ratios for Key Gases
Code Range of Ratios
<0.1 0.1-1 1-3 >3 Case
Fault Type
C2H2/ C2H4
CH4/ H2
C2H4/ C2H6
0 1 1 2 C2H2/ C2H4 0
1 0 2 2 CH4/ H2 0
0 0 1 2 C2H4/ C2H6 0
0
No fault
1
Low energy partial discharge
1
1
0
2
High energy partial discharge
1
1
0
3
Low energy discharges, sparking, arcing
1-2
0
1-2
4
High energy discharges, arcing
1
0
2
5
Thermal fault less than 150°C (see note 2)
0
0
1
0
2
0
0
2
1
0
2
2
6
7
8
Thermal fault temp. range 150-300°C (see note 3) Thermal fault temp. range 300-700°C Thermal fault temp. range over 700°C (see note 4)
Gas C2 H2 C2 H4 CH4 H2 C2 H6
Detection Limits 1 ppm 1 ppm 1 ppm 5 ppm 1 ppm
10 x Detection Limits 10 ppm 10 ppm 10 ppm 50 ppm 10 ppm
Problems Found Normal ageing Electric discharges in bubbles, caused by insulation voids, super gas saturation in oil or cavitation (from pumps), or high moisture in oil (water vapor bubbles). Same as above but leading to tracking or perforation of solid cellulose insulation by sparking or arcing. This generally produces CO and CO2. Continuous sparking in oil between bad connections of different potential or to floating potential (poorly grounded shield etc); breakdown of oil dielectric between solid insulation materials. Discharges (arcing) with power follow through; arcing breakdown of oil between windings or coils, between coils and ground, or load tap changer arcing across the contacts during switching with the oil leaking into the main tank. Insulated conductor overheating This generally produces CO and CO2, because this type of fault generally involves cellulose insulation. Spot overheating in the core due to flux concentrations. Items below are in order of increasing temperatures of hotspots. Small hotspots in core. Shorted laminations in core. Overheating of copper conductor from eddy currents. Bad connection on winding to incoming lead or bad contacts on load or no-load tap changer. Circulating currents in core. This could be an extra core ground, (circulating currents in the tank and core). This could also mean stray flux in the tank. These problems may involve cellulose insulation, which will produce CO and CO2.
Notes: 1. There will be a tendency for ratio C2H2 /C2H4 to rise from 0.1 to above 3 and the ratio C2H4 /C2H6 to rise from 1-3 to above 3 as the spark increases in intensity. The code at the beginning stage will then be 1 0 1. 2. These gases come mainly from the decomposition of the cellulose, which explains the zeros in this code. 3. This fault condition is normally indicated by increasing gas concentrations. CH 4/H2 is normally about 1, the actual value above or below 1, is dependent on many factors, such as the oil preservation system (conservator, N 2 blanket, etc.), the oil temperature, and oil quality. o 4. Increasing values of C2H2 (more than trace amounts), generally indicates a hotspot higher than 700 C. This generally indicates arcing in the transformer. If acetylene is increasing and especially if the generation rate is increasing, the transformer should be de-energized as further operation is extremely hazardous.
General Remarks: 1. Values quoted for ratios should be regarded as typical (not absolute). There may be transformers with the same problems whose ratio numbers fall outside the ratios shown at the top of the table. 2. Combinations of ratios not included in the above codes may occur in the field. If this occurs, the Rogers Ratio Method will not work for analyzing these cases. 3. Transformers with on-load tap changers may indicate faults of code type 2 0 2 or 1 0 2 depending on the amount of oil interchange between the tap changer tank and the main tank.
111
If samples from Type I transformers (N2 blanket) are compared to those from Type II transformers (sealed conservator), it is necessary to make adjustments to gas concentrations and consequently some gas ratios used for diagnostic purposes. Fortunately, major adjustment is required only for the hydrogen concentration. Details of the adjustment procedure were derived by Oommen [65]. The only gas ratio that needs significant adjustment is the CH4/H2 ratio. The adjustment factor is 0.44 at 25 °C. This means that a gas ratio obtained from measurement on a Type I transformer should be multiplied by 0.44 to equate to a measurement on a Type II transformer. Since Rogers developed his method based on sample from Type III transformers, there is some uncertainty about strict enforcement of ratio codes to all types of transformers. With this qualification, it may be pointed out that the ratio codes are of great value in diagnosing transformer faults. The severity of faults identified in transformers using the Rogers ratio patterns is shown in Table 3-16. The level of urgency in correcting a problem will obviously depend on the severity of the fault. While it may be sufficient to place a transformer with an overheating conductor problem on a watch list, one with an arcing fault might require immediate removal from service and subsequent investigation. Table 3-16: Order of Severity of Transformer Faults Increasing Order of Severity 1 2 3 4 5 6 7 8
3.2.2.12.4
Fault Patterns Normal Conductor Overheating Oil Overheating, Mild Oil Overheating, Moderate Oil Overheating, Severe Partial Discharge, Low Energy Partial Discharge, High Energy Arcing
Pattern # in Table 3-15 0 5 6 7 8 1 2 3,4
IEC Method
The IEC method (See IEC 60599 latest version is second edition 1999-03) uses five different types of faults and three basic ratios. The method is very similar to the Rogers Ratio above. The faults and ratios are as follows: PD Partial discharges D1 Discharges of low energy D2 Discharges of high energy T1 Thermal fault, T < 300 °C T2 Thermal fault, 300°C < T < 700 °C T3 Thermal fault, T > 700 °C Basic ratios: C2H2/C2H4, CH4/H2 and C2H4/C2H6 3.2.2.12.4.1
Carbon Dioxide/Carbon Monoxide (CO2/CO) Ratio
The formation of CO2 and CO from oil-impregnated paper insulation increases rapidly with temperature. Incremental (corrected) CO2/CO ratios less than 3 are generally considered as an indication of probable paper involvement in a fault, with some degree 112
of carbonization. Normal CO2/CO ratios are typically in the range 5 - 9. Ratios above 10 generally indicate a thermal fault with the involvement of cellulose. If CO is increasing around 70 ppm or more per month (generation limit from IEC 60599), there is probably a fault. In order to get reliable CO2/CO ratios in the equipment, CO2 and CO values should be corrected first for possible CO2 absorption from atmospheric air; and CO2 and CO background generation (see 6.1 and clause 9 of IEC 60599). The background generation result from the ageing of cellulosic insulation, overheating of wooden blocks and the long term oxidation of oil. For example, if air-breathing equipment is saturated with approximately 10% of dissolved air, there could be up to 300 l/l (ppm) of CO2 just from the air. In sealed equipment, air is normally excluded but may enter through leaks. The concentration of CO2 will be in proportion to the amount of air present. When excessive paper degradation is suspected (CO2/CO < 3), it is advisable to ask for a furanic compounds analysis or a measurement of the degree of polymerization of paper samples, if this is possible. 3.2.2.12.4.2
IEC C2H2/H2 Ratio
In power transformers equipped with on-load tap changers (OLTC), the tap changer operations produce gases corresponding to discharges of low energy in the main tank (D1). If some oil or gas communication is possible between the OLTC compartment and the main tank, or between the respective conservators, these gases may contaminate the oil in the main tank and lead to wrong diagnoses. The pattern of gas decomposition in the OLTC, however, is quite specific and different from that of regular low energy discharges in the main tank. 3.2.2.12.4.3
IEC Recommended Method of Interpretation
a) Reject or correct inconsistent DGA values. Calculate the rate of gas increase since the last analysis, taking into account the precision of the DGA results. If all gases are below typical values of gas concentrations and rates of gas increase, report as "Normal DGA/healthy equipment". If at least one gas is above typical values of gas concentrations and rates of gas increase, calculate gas ratios and identify fault. Check for eventual erroneous diagnosis. If necessary subtract last values from present ones before calculating ratios, particularly in the case of CO and CO2. If DGA values are above typical values but below 10 times the analytical detection limit, see the section in IEC 60599 on “Uncertainty of ratios”. b) Determine if gas concentrations and rates of gas increase are above alarm values. Verify if fault is evolving towards final stage. Determine if paper is involved. c) Take proper action according to the best engineering judgment. It is recommended to: 1) Increase sampling frequency (quarterly, monthly or other) when the gas concentrations and their rates of increase exceed typical values, 2) Consider immediate action when gas concentrations and rates of gas increase exceed alarm values.
113
3.2.2.12.5
Duval Triangle Method for Diagnosing a Transformer Problem Using Dissolved Gas Analysis [66]
Duval developed this method in the 1960s using a database of thousands of DGAs and transformer problem diagnoses. This method has proven to be accurate and dependable over many years and is now gaining in popularity. The method and how it is used is described below. Before this method is applied, it is best to follow these steps: 1. First determine whether a problem exists by using the IEEE method above, and/or Table 3-17 below. At least one of the hydrocarbon gases or hydrogen (H2) must be in IEEE Condition 3, and increasing at a generation rate (G2) from the table below, before a problem is confirmed. To use Table 3-17 below without the IEEE method, at least one of the individual gases must be at L1 level or above and the gas generation rate at least at G2. If there is a sudden increase in H2 with only carbon monoxide (CO) and carbon dioxide (CO2) and little or none of the hydrocarbon gases, use the (CO2/CO ratio) below to determine if the cellulose insulation is being degraded by overheating. 2. Once a problem has been determined to exist, use the total accumulated amount of the three Duval Triangle gases and plot the percentages of the total on the triangle to arrive at a diagnosis. Also, calculate the amount of the three gases used in the Duval Triangle, generated since the sudden increase in gas began. Subtracting out the amount of gas generated prior to the sudden increase will give the amount of gases generated since the fault began. Detailed instructions and an example are shown below. a) Take the amount (ppm) of methane (CH4) in the DGA and subtract the amount of CH4 from an earlier DGA, before the sudden increase in gas. This will give the amount of methane generated since the problem started. b) Repeat this process for the remaining two gases, ethylene (C2H4) and acetylene (C2H2). c) Add the three numbers (differences) obtained by the process of step b) above. This gives 100 % of the three key gases generated since the fault. d) Divide each individual gas difference by the total difference of gas obtained in step c) above. This gives the percentage increase of each gas of the total increase. e) Plot the percentage of each gas on the Duval Triangle, beginning on the side indicated for that particular gas. Draw lines across the triangle for each gas parallel to the hash marks shown on each side of the triangle (see Figure 3-12). The triangle coordinates, corresponding to DGA results in ppm, can be calculated as follows: %C2H2 = 100x/(x+y+z); %C2H4 =100y/(x+y+z); %CH4 = 100z/(x+y+z); where x = C2H2, y = C2H4, z = CH4.
114
The diagnostic regions in the triangle are defined as: PD = Partial Discharge T1 = Thermal Fault less than 300 °C T2 = Thermal Fault between 300 °C and 700 °C T3 = Thermal Fault greater than 700 °C D1 = Low Energy discharge (Sparking) D2 = High Energy discharge (Arcing) DT = Mix of Thermal and Electrical Faults Table 3-18 provides examples of the typical faults in transformers for each of the diagnostic categories in the Duval analysis triangle. The table is derived from the IEC draft 60599 (Edition 2) [64].
Figure 3-12: Coordinates and Fault Zones of the Duval Triangle
CAUTION: Do not use the Duval Triangle to determine whether or not a transformer has a problem. Notice, there is no area on the triangle for a transformer that does not have a problem. The triangle will show a fault for every transformer whether it has a fault or not. Use the key gas or TDCG methods to determine if a problem exists before applying the Duval Triangle. The Duval Triangle is used only to diagnose what the problem is. As with other methods, a significant amount of gas must already be present before this method is valid.
115
Table 3-17 : L1 Limits and Generation (G1, G2) Rate Per Month Limits Gas
L1 Limits
H2 CH4 C2 H2 C2 H4 C2 H6 CO CO2
100 75 3 75 75 700 7,000
G1 Limits (ppm per month) 10 8 3 8 8 70 700
G2 Limits (ppm per month) 50 38 3 38 38 350 3,500
NOTE: In most cases, acetylene (C2H2) will be zero, and the result will be a point on the right side of the Duval Triangle. Compare the total accumulated gas diagnosis and the diagnosis obtained by using only the increase-in-gases after a fault. If the fault has existed for some time, or if generation rates are high, the two diagnoses will be the same. If the diagnoses are not the same, always use the diagnosis of the increase in gases generated by the fault, which will be the more severe of the two. Table 3-18: Example of Faults from the Duval Analysis of Power Transformers Fault Type Partial discharges Discharges of low energy
Discharges of high energy
Overheating less than 300°C Overheating 300 to 700°C
Examples Discharges in gas-filled cavities in insulation, resulting from incomplete impregnation, high moisture in paper, gas-in-oil super-saturation or cavitation (gas bubbles in oil), leading to X wax formation on paper. Sparking or arcing between bad connections of different floating potential, from shielding rings, toroids, adjacent discs or conductors of different windings, broken brazing, closed loops in the core. Additional core grounds. Discharges between clamping parts, bushing and tank, high voltage and ground, within windings. Tracking in wood blocks, glue of insulating beam, winding spacers. Dielectric breakdown of oil, load tap changer breaking contact. Flashover, tracking or arcing of high local energy, or with power follow through. Short circuits between low voltage and ground, connectors, windings, bushings, and tank, windings and core copper bus and tank, in oil duct. Closed loops between two adjacent conductors around the main magnetic flux, insulated bolts of core, metal rings holding core legs. Overloading the transformer in emergency situations. Blocked or restricted oil flow in windings. Other cooling problems, pumps valves, etc. Stray flux in damping beams of yoke. Defective contacts at bolted connections (especially bus bar), contacts within tap changer, connections between cable and draw rod of bushings. Circulating currents between yoke clamps and bolts, clamps and laminations, in ground wiring, bad welds or clamps in magnetic shields. Abraded insulation between adjacent parallel conductors in windings. Large circulating currents in tank and core. Minor currents in tank walls created by high uncompensated magnetic field. Shorted core laminations.
Overheating over 700°C Notes: 1. X wax formation comes from Paraffinic oils (paraffin based); however, naphthenic oils are not immune to X wax formation 2. The last overheating problem in the table is for faults over 700°C. Recent laboratory discoveries have found that acetylene can be produced in trace amounts at 500°C, which is not reflected in this table. Transformers that show trace amounts of acetylene are probably not active arcing but may be the result of high-temperature thermal faults. It may also be the result of one arc, due to a nearby lightning strike or voltage surge. 3. A bad connection at the bottom of a bushing can be confirmed by comparing infrared scans of the top of the bushing with a sister bushing. When loaded, heat from a poor connection at the bottom will migrate to the top of the bushing, which will display a markedly higher temperature. If the top connection is checked and found tight, the problem is probably a bad connection at the bottom of the bushing.
116
3.2.2.12.6
ABB's Advanced Dissolved Gas Analysis Software (ADGA)
It has been ABB’s experience that the design and application of a transformer can make it have its own unique gassing pattern. ABB has developed an internal software package that combines DGA raw data, ratios, trending, key indicators, and ABB's resident design expertise and transformer construction knowledge to interpret the results. By combining ABB's design and manufacturing knowledge with the analysis capabilities of the software, the analysis is able to offer greater analytical depth than what is standard practice in the industry. The program has the ability to pinpoint specific sources and causes of gas generation, rather than simply identify general categories of gas generation. Figure 3-13 shows the results of an analysis performed with this software. In addition to the individual gas concentrations, the program requests the rate of generation of each gas and a series of inputs relating to the type of oil preservation system and application of LTC, etc. The results are a prioritized list of diagnoses and colour-coded pictorials of the severity of each gas concentration and diagnostic ratio. The likely sources of the fault can be obtained by activating an explanation screen.
Figure 3-13: Advanced DGA Analysis of Power Transformer Gas-in-Oil Sample
117
3.2.3 ANALYSIS OF PARTICLES IN TRANSFORMER OILS [67] Transformer manufacturers and utilities currently use particle contamination as another means of monitoring oil quality in transformers. This is due to the increasing awareness of the factors that influence the dielectric strength of oil. High-level particle contamination is recognized as an important factor. The breakdown strength of transformer oil is a function of the concentration, size, shape, and type of the particles and the moisture level in the oil. In performing these analyses, identification of the particles is important in determining the source of particle generation in operating transformers. The chief sources of particulate matter in transformers are cellulosic dust and fibers and residual dirt. Iron particles, particles of copper, and other metals could exist from manufacturing operations. The factory filtering and flushing operations remove most of these particles; therefore, the particle level would be relatively low. Some undesirable conditions in service, such as pump problems and electrical discharges, tend to generate particles; therefore, the periodic monitoring of particle level should be considered part of the preventive maintenance program. Many field problems are detected by electrical tests and gas analysis, but a few, such as pump bearing, wear may not be apparent. Pump bearing wear is of particular interest, because metallic particles generated could reduce the dielectric strength of the transformer insulation. 3.2.3.1
OIL SAMPLING FOR PARTICLE ANALYSIS
In taking samples for particle count analysis, the oil should be taken from the bottom valve of transformers via flexible tubing. At least a gallon of oil should be allowed to flow out to purge the lines before the sample bottle is introduced into the flowing stream. The bottle itself should be clean; ultrasonic cleaning is preferable in most cases. Large bottles should be rinsed in the oil stream even if they are pre-cleaned. The bottles should be capped soon after sampling. In spite of these precautions, particle contamination from outside sources may not be completely eliminated. When high counts are measured, a second sample should be taken to check for sampling errors. 3.2.3.2
PARTICLE COUNTING [68]
Particle size analyzers are used to perform particle counting in transformer oils. These instruments use the principle of light blockage to estimate the size of each particle as it passes through a micro cell in which a transverse light beam is applied. The crosssectional area of the particle is automatically estimated, and this area is converted to an equivalent circle or ellipse. The measured particle size may be expressed as the diameter of this circle or as the major diameter of the ellipse. Since most particles are non-spherical, especially dust and wear particles, the ellipse approximation is preferred. Until 2000, the optical particle counters used for transformer fluid analysis were calibrated using a standard suspension of what is known as ACFTD (Air Cleaner Fine Test Dust) particles in a hydrocarbon fluid (MIL 5606) of comparable viscosity. The standard for calibrating particles based on the ACFTD method is ISO 4406-1999 [69]. The ACFTD calibration method has since been replaced with ISO 11171 [70] and ASTM method D6786, which specifies a solution of Medium Test Dust (MTD). The conversion of a sample of particle sizes from ACFTD to MTD methods is given in Table 3-19. 118
Table 3-19: Particle Size Conversion ACFTD Size ( m) 1.0 3.0 5.0 10.0 15.0 20.0 50.0 100.0
MTD Size ( m) 4.2 5.1 6.4 9.8 13.6 17.5 38.2 70.0
Counting is done in the cumulative mode, i.e., for any specified size, the number of particles above that size would be measured. The ACFTD method suggested reporting cumulative particle counts 1, 5, 10, 15, 25, 50, and 100 m sizes. These correspond roughly to the recommended sizes of 4, 6, 10, 14, 21, 38, and 70 m sizes for the newer MTD method. The level of contamination in a unit is determined via a contamination code that depends on the number of cumulative particles in a defined range per milliliter of oil. The contamination code is determined with reference to the scheme given in ISO-44061999. A segment of the scheme is shown in Table 3-20. To determine the contamination code, particle levels at three sizes are used, 4 m, 6 m, and 14 m. These roughly correspond to the ACFTD sizes of 1 m, 5 m, and 15 m. Table 3-20: Particle Contamination Code Number of Particles per Milliliter 5000 to 10,000 2500 to 5000 1300 to 2500 640 to 1300 320 to 640 160 to 320 80 to 160 40 to 80 20 to 40 10 to 20 5 to 10
3.2.3.2.1
CODE Number 20 19 18 17 16 15 14 13 12 11 10
Normal and Abnormal Particle Count Levels
From experiments performed by ABB, it appears that units with greater than 150 particles above 5 m per milliliter of oil using the MTD method (or 150 particles above 3 m per milliliter of oil using the ACFTD) deserve further analysis and possibly inspection if other tests prove positive. These values are not intended to be an upper limit on the permissible particles in operating transformers. However, particle size analysis should be supplemented by quantitative trace metal analysis as described below.
119
3.2.3.3
T RACE METAL CONTENT OF PARTICLES
The sources of particles with metallic content have already been mentioned. In this section the technique used to measure trace metallic levels and the results obtained will be described. 3.2.3.3.1
Method of Measurement
Several methods exist for trace metal analysis of oil samples. The most commonly used methods at present are ICP (inductively coupled plasma) atomic absorption and atomic emission and x-ray fluorescence. The atomic absorption technique is especially suited for very low-level contamination levels (in the parts per billion ranges). Unlike emission spectroscopy and x-ray fluorescence, it does not directly identify all the elements present in a sample; the presence of each element has to be tested using standards in atomic absorption spectroscopy, and a selection of metals is detected by ICP. Atomic absorption is therefore a time consuming technique if several elements are to be tested. In the AAS technique the sample is “atomized” in a flame or furnace at temperatures in the 1,500-3,000 °C range. For each element to be tested, a separate hollow cathode lamp of that element is mounted and energized to produce emission lines of characteristic wavelengths. The emission beam is allowed to pass through the vapor. If the vapor has atoms of the same element, these atoms would absorb energy from the beam in proportional to the concentration of atoms. The exact methodology has to be worked out for each type of analysis. If particles are extremely fine, e.g., below 10 microns, the sample would be more or less homogeneous, and the furnace technique could be used. Only micro liters of the oil sample are required, and no sample preparation is needed. However, the reproducibility of the furnace technique is not high when small samples are used, and many particles suspended in oil are greater than 10 microns. This type of analysis would give metallic content of both suspended and dissolved material. This procedure of only analyzing suspended particles has been found to be reproducible and correlates well with units having known sources of contamination. Meaningful metal analysis can be confined to four elements: iron, copper, lead, and zinc. All these elements could be analyzed easily by the flame technique using air/acetylene flame. The selection of iron and copper needs no explanation. Lead and zinc are elements normally found in the pump bearing alloy material. It must be pointed out that lead and zinc could be present in oil from other sources such as solders, zinc plated parts, and paints; also, the wear of the alloy may not produce particles of the same composition. Lead and zinc are relatively low melting, and may be partly lost during wear process and sample preparation. Iron oxide is a component of dirt, dust, and impure clay; therefore, a bad sample could show excessive iron content. 3.2.3.3.2
Normal and Abnormal Metallic Content of Particles in Oil
The metallic content of particles is expressed, for convenience, in parts per billion (ppb) units, which could be better stated as micrograms/ml. For very clean oil, the levels of iron, copper, lead, and zinc approach detection limits, 1-2 ppb. An upper limit of 5 ppb is
120
typically observed for each element in clean oil with total particle count not exceeding 500. Based on a limited study of 200 samples taken by ABB from both factory and field units, the following levels appear normal for both factory and field units: Iron: 10 ppb, max. Copper: 20 ppb, max. If levels greater than these are measured, further study may be required. Most units with reported bearing problems show higher than average upper levels. Considerable caution should be used in the application of these limits. First, the analysis technique between laboratories should be standardized. Secondly, the total volume of oil in the transformer should be taken into account. The oil volume in large power transformers could vary from 10,000 to 30,000 gallons. If particles originate from general degradation processes, the particle concentration would be uniform regardless of the size of the transformer. If, however, particles originate from a localized mechanical problem, the total oil volume would influence particle concentration. This is especially true of oil samples tested from residual oil after flushing operations. Both the particle level and metallic level could be higher than normal. However, such concentrated samples may still be of value for metal identification. The levels suggested above do not correct for transformer size. 3.2.3.4
DIAGNOSTIC EXAMPLES OF PARTICLE ANALYSIS
Table 3-21 shows some examples of problem diagnoses using particle analysis. They show that excessive high particle levels may indicate wear and degradation. Also, excessive copper content may be associated with pump bearing wear problems in some cases. These examples and others reported in the open literature demonstrate that particle level analysis coupled with AAS is a useful technique to monitor metallic contamination in transformer oil. Table 3-21: Diagnostic Examples of Particle Analysis Case Description Pump failure from impeller and thrust bearing wear. Sample taken from bottom of unit after pump failure.
Pump problem from radial bearing wear. Sample was taken from a unit with suspected pump problems. Pump motor winding short. This analysis was performed after a pump winding failure in a factory situation.
METALLIC CONTENT (ppb) Iron Copper Lead Zinc 8.8 107.7 15.5 6.9
Total Particles 58,225
Visible Particles 31
750
6
17.6
75
2.7
3.8
619
3
3.5
116.8
12.1
17.2
Comments The excessive copper content confirms the problem. Shiny metallic particles were visible. Pump bearing wear may not always produce such high levels, but AAS and particle counting could still be used to test whether the problem exists. Visual inspection showed that the rear radial bearing had frozen on the axle; the pump was, however, still operating. Although particle count is deceptively low, the metallic analysis showed excessive copper content. The shorting caused gas generation from oil decomposition in the pump housing.
121
3.2.3.5
EFFECT OF PARTICLES ON DIELECTRIC STRENGTH OF INSULATING OIL13 [71]
The effect of particles on the dielectric strength of transformers has been characterized to a large extent. Experimental investigations have been numerous and most of them show a sizeable reduction of dielectric strength, especially if a large oil volume is used and the voltage is applied over a long time period. Since investigations were mostly carried out on bare electrodes, they are relevant only for the case of discharges initiated in the oil. For discharges initiated at the electrode-to-oil interface, the effect of particleinitiated discharges on the insulation is obviously considerable but has not yet been characterized. The measurement of the particle content in an oil sample has shown large discrepancies when results from different laboratories are compared. Measurements on different samples, carried out in a single laboratory, appear to be much more consistent and successive measurements on the same sample have shown very good repeatability. Particle counting is somewhat hampered by the very small volume of the oil sample compared to the total oil volume of oil in the transformer. Depending on the sampling valves and techniques used, it is possible to measure completely different particle concentrations in the same transformer. In spite of these difficulties, it is necessary to establish recommendations since the detrimental effect of particles has been identified conclusively in a number of failures either in the field or during factory acceptance tests. The experience of utilities and manufacturers reveals that this type of failure is observed almost exclusively on EHV transformers. This is believed to be linked to the smaller ratio of test voltage to service voltage and the large oil volume found in EHV transformers. The most vulnerable part of the transformer is the high-voltage bushing shield and high-voltage lead, especially if the insulation is provided mainly by a large oil volume without subdividing barriers. This effect appears to be enhanced when these components are located in a turret. 3.2.3.5.1
Current filtering practices on new transformers
It is quite normal for a newly manufactured transformer to have a significant content of particles, mainly cellulose. It is now common to apply a filtering procedure to the oil, before proceeding with the acceptance tests. This precaution applies mainly to EHV transformers. In a study by a CIGRE working group, most of the manufacturers that were consulted do not actually count particles but establish a factory procedure that simply calls for a certain number of passes of the oil through a filter. After installation at the site, a similar procedure of oil filtering is recommended for these more sensitive transformers. This precaution allows some contamination to be eliminated that could originate from the coolers, the erection procedure or the oil itself. Only a few manufacturers have set limits on the particle count acceptable before commissioning. In those few cases, the applicable limit is 1,000 particles larger than 5 m per 100 ml oil volume. A more realistic measurement of particles is somewhat easier at this stage since the filtering creates a large oil circulation outside the transformer tank and allows for the use of on-line particle counting with a continuous supply of homogenized oil. 13
CIGRE SC A2 (ex 12) WG 17, - Particles in Oil, Nov. 1999
122
3.2.3.5.2 3.2.3.5.2.1
Classification of contamination level Bare electrodes
Most of the reported experiments are made with bare electrodes, using test cells as specified by IEC 60156 or ASTM D-1816. However, some of the tests have been carried out with plane electrodes or bushing shields of very large dimensions. The presence of particles, whether conducting material or cellulose fibers, always reduces the average breakdown voltage. The reduction factor varies widely and it cannot be readily related to the oil volume under stress, voltage application method or type of contaminant. The particle counting method is another possible cause of the dispersion. It must be noted that these reductions in dielectric strength are applicable only to the oil and cannot be applied to a system where the electrodes are covered with solid insulation. It is the CIGRE Working Group’s opinion that, because of its small volume, the IEC electrode is not the best configuration for evaluating the effect of particles. In normal transformer oil, the amount of particles per unit of volume is rather small and the standard procedure for oil testing does not allow sufficient time for the particles to move to the right place. Coaxial test cells have been suggested by France and tried by others. This gives a continuous oil flow and therefore a larger oil volume is actually tested. The coaxial test cell appears to be the best tool presently available to quantify the effect of particles on the dielectric strength of insulating oil. The effect of moisture is significant, especially in the presence of cellulose fibers. This can be best illustrated with a set of results from Sinz [72]. The effect of moisture is obvious, as is the better sensitivity of the coaxial test cell as compared to the IEC test cell. It is therefore recommended that the water content be reported along with the particle content especially when dealing with cellulose particles. The voltage application method is also questioned. It is argued by some researchers that the step voltage procedure allows the test cell to be under voltage for a longer time and increases the probability of a particle moving closer to the area of maximum field stress. It is also noted that from a practical point of view, the average breakdown voltage is not as interesting as the minimum breakdown voltage. It is suspected that the particles might increase the dispersion of the breakdown voltage and it is recommended that the dispersion be reported along with the average values. It appears that the IEC test method is not appropriate for showing the detrimental effect of the particles. There is a need to develop a standardized method that would call for a large oil volume and a long duration of voltage application. 3.2.3.5.2.2
Covered electrodes
Very little experimental data is available on the effect of particles with electrodes coated with insulating material. For natural (factory) contamination, a reduction of 29% on the average breakdown voltage was found. Hydro-Québec, in collaboration with EHV Weidmann, has run some tests with plane electrodes and a combination of pressboard sheets and pressboard spacers to simulating the main insulation between high-voltage and low-voltage windings in a large 123
transformer. The introduction of aluminum powder in the insulating oil only slightly reduced the average breakdown voltage (7%), but the reduction on the minimum value was more significant (32%). It is possible that the breakdown mechanism involved here is quite different from the one in section 3.2.3.5.2.1. 3.2.3.5.3
Contamination deposited on insulating surface
Some researchers have endeavored to quantify the impact of conducting particles when deposited on insulating structures. Hydro-Québec, in collaboration with EHV Weidmann, has investigated the effect of aluminum deposited on spacers in the main insulation of a transformer. In this case, the aluminum was diluted in a solvent which was then applied with a brush on the side of the pressboard spacer. Two pressboard pieces spaced 12mm apart were used to simulate a 12-mm oil duct; three pressboard pieces equally spaced at 6-mm were used to simulate two, 6-mm oil ducts. The reduction in average breakdown value was 24 % for the single duct and 14% for the double oil duct. A similar test, without the pressboard barrier, was carried out on a larger scale by ABB at the request of Hydro-Québec. Here again the aluminum powder was applied with a brush. With this contamination, the average breakdown voltage was reduced from 400 kV to 280 kV, a reduction of 30 %. Table 3-22: Typical contamination levels encountered on power transformer insulating oil (ISO class)
Maximum count per 100 ml
Contamination designation
Typical occurrence
5 m
15 m
Up to 8/5
250
32
None
IEC cleanliness requirement for sample bottle filled with a clean solvent
9/6 to 10/7
1000
130
Low
Excellent oil cleanliness encountered during factory acceptance test and transformer commissioning
11/8 to 15/12
32000
4000
Normal
16/13 to 17/14
130000
16000
Marginal
Contamination level found on a significant number of transformers in service
High
Contamination level rare and usually indicative of abnormal operating conditions
18/15 and above
Contamination level typical for transformers in service
Vincent [73] reported an experiment with a piece of pressboard contaminated with carbon particles and subjected to divergent fields in a rod-plane configuration. In this case, carbon particles were collected on the surface of the pressboard by subjecting it to an AC electric field in an oil container that is heavily polluted with carbon. The electric field which allowed the particles to be collected was perpendicular to the surface while the test field was tangential. During the test with the 1-min step voltage application, it was observed that the electric field near the tip of the rod had a cleansing effect on the 124
pressboard, progressively removing most of the deposited carbon. The breakdown voltage of the contaminated sample was therefore not significantly lower than the clean one. 3.2.3.5.4
Recommended corrective action
Corrective action for the reduction of particle content should be initiated only after proper evaluation of the dielectric strength of the oil. For screening purposes, the IEC 60156 test procedure is adequate but if there is a discrepancy between the contamination level and the dielectric strength of the oil, the dielectric test should be repeated with a procedure capable of showing the detrimental effect of particles, if any. For the purpose of these recommendations, a “marginal” dielectric performance is defined as a reduction of 30% or more of the new oil characteristics. The recommended action for EHV transformers in service is summarized in Table 3-23. Table 3-23: Recommended action for contaminated oil
Contaminatio n level
Dielectric strength
Recommended action
Good
No further action.
Poor
Identify type of particles.
Good
Probably dirt or dry cellulose. Repeat dielectric strength with a test procedure appropriate for particles.
Normal
Marginal Marginal Good
Identify type of particles. Check moisture content. Filtering may be considered. Recheck particle count. Recheck dielectric strength with a test procedure appropriate for particles. Investigate source of particles.
High Marginal
Filtration or replacement is strongly recommended.
125
3.2.4 WINDING RESISTANCE TEST This test is a measure of the resistance of the conductors in the transformer winding. The resistance measurement is corrected to either 75 °C or 85 °C, depending on the average winding temperature rise of the transformer. The correction temperature is the average winding rise plus 20 °C. If the temperature rise for the transformer is 55 °C, the winding resistance is corrected to 75 °C, and if it is 65 °C, the resistance is corrected to 85 °C. The winding resistance will typically change if there are shorted turns, loose connections on bushings, loose connections or high-contact resistance in tap changers and broken winding strands. These conditions will typically lead to hotspots in the winding or the affected areas and generate hot metal gases in the oil. The gases to look for in a DGA in case of poor connections are ethylene, ethane, and to some extent, methane. If the DGA suggests the possibility of any of the situations mentioned above, a winding resistance test is in order.
Figure 3-14: Low Resistance Ohmmeter - Biddle Model 247001 (Courtesy of Megger)14 3.2.4.1
MEASUREMENT METHOD FOR WINDING RESISTANCE MEASUREMENT
Winding resistance measurements are performed with a low-resistance ohmmeter such as shown in Figure 3-14. For a three phase wye-connected transformer, the resistance is measured for each phase-to-neutral winding; if delta-connected, the resistance is measured for each phase-to-phase winding. Note that for delta-connected transformers, the measured resistance for each phase is composed of a parallel combination of the winding under test and the series combination of the remaining windings. It is therefore recommended to make three measurements for each phase-to-phase winding in order to obtain the most accurate results. It is also recommended to allow the transformer to sit de-energized until temperatures are equalized (difference between top and bottom temperatures does not exceed 5 °C – ANSI/IEEE C57.12.90) before making resistance measurements. According to IEC 60076-1, in order to reduce measurement errors due to changes in temperature, some precautions should be taken before the measurement is made. For Dry type transformers, the transformer shall be at rest in a constant ambient temperature for at least 3 hours. For Oil immersed transformers, the transformer should be under oil and without excitation for at least 3 hours. In addition, it is important to ensure that the average oil 14
From website: http://www.megger.com/us/.
126
temperature (average of the top and bottom oil temperatures) is approximately the same as the winding temperature. To avoid an inadmissible winding temperature rise during the measurement, it is also recommended that the measuring current should be limited to no more than 10 percent of the rated current of the winding. In order to diagnose possible problems, the measured results are compared to the factory values, values of other phases of the same transformer, or sister units, if available. Before making such comparisons, the resistance has to be converted to a common temperature base of 75 °C or 85 °C, depending on what is reported on the transformer factory test sheet. The corrected resistance is calculated as:
RCT
RM (CF CT ) CF Winding Temp( o C )
where: RCT = Corrected resistance CF = 234.5 for copper windings; 225 for aluminum windings (IEEE C57.12.90) CF = 235 for copper windings; 225 for aluminum windings (IEC 60076-1) CT = 75 for 55 C rise transformers; 85 for 65 C rise transformers RM = Measured winding resistance Consistency in measurements and record keeping are the keys to making the proper analysis using this test. If the unit has a tap changer, it is important to compare resistances for the same tap position. The contact resistance of other tap positions can be investigated by moving taps and repeating the measurements. A measurement is deemed acceptable and no further investigation is needed if the individual phase readings are within 2% of the other phase readings for three phase transformers or within 2% of the reported factory value for single phase transformers. Changes greater than 2% may be due to loose connections, broken conductor strands, short circuits, or bad tap changer contacts, or they can be caused by uncertainty in the temperature correction. For very low resistance values, it is not uncommon for measurements to be outside of the 2% limit even in a perfectly normal transformer. In such cases the measurement tolerances of test equipment may not be sufficient to resolve the acceptable 2% limit between measurements. When readings are outside the 2% range, it is recommended to investigate further or to consult the transformer manufacturer to determine acceptability of the results.
127
3.2.5 TRANSFORMER TURNS RATIO TEST (TTR) The function of a transformer is to transform power from one voltage level to another. The ratio test ensures that the transformer windings have the proper turns to produce the voltages required. The “turns ratio” is a measure of the RMS voltage applied to the primary terminals to the RMS voltage measured at the secondary terminals: r
Np Ns
Ep Es
Where: r = voltage ratio E = open-circuit voltage N = number of turns p = primary s = secondary The IEEE standard (IEEE Standard 62) states that when rated voltage is applied to one winding of the transformer, all other rated voltages at no load shall be correct within one half of one percent of the nameplate readings. It also states that all tap voltages shall be correct to the nearest turn if the volts per turn exceed one half of one percent of the desired voltage. The ratio test verifies that these conditions are met. The IEC 60076-1 standard defines the permissible deviation of the actual to declared ratio as follows: Principal tapping for a specified first winding pair: the lesser of ± 0.5% of the declared voltage ratio or 0.1 times the actual short-circuit impedance. Other taps on the first winding pair and other winding pairs must be agreed upon, and must not be lower than the smaller of the two values stated above. Deviations in turns ratio readings indicate problems in one or both windings. In particular, the TTR test is useful for identifying shorted turns or open circuits in the windings, incorrect winding connections, and other internal faults or tap changer defects. If possible, the ratio at each tap setting should be checked against the nameplate ratio for each tap. Measurements are typically made by applying a known low voltage across the highvoltage winding (as a primary) so that the induced voltage on the secondary is lower, thereby reducing hazards while performing the test. For a three phase delta/wye or wye/delta transformer, a three phase equivalency test is performed, i.e. the test is performed across corresponding single windings. The appropriate test configurations for various connections for three phase two-winding transformers are shown in Table 3-24. One of a variety of test sets used for performing these measurements is shown in Figure 3-15.
128
Figure 3-15: Three Phase TTR Test Set (Courtesy of Megger)15
The TTR test value should not be greater than 0.5 % or less than 0.5 % of the calculated values. For a three phase three-winding transformer, the following measurements will be made in a TTR assessment. Table 3-24: TTR Measurement Configurations Connection Delta-Delta
Delta-Wye
Wye-Wye
Wye-Delta
Apply Voltage Across Winding H1-H2 H1-H3 H2-H3 H1-H2 H1-H3 H2-H3 H0-H1 H0-H2 H0-H3 H0-H1 H0-H2 H0-H3
Measure Voltage Across Winding X1-X2 X1-X3 X2-X3 X0-X3 X0-X2 X0-X1 X0-X1 X0-X2 X0-X3 X1-X2 X1-X3 X2-X3
Calculate Voltage Ratios VH1-H2/VX1-X2 VH1-H3/VX1-X3 VH2-H3/VX2-X3 VH1-H2/VX0-X3 VH1-H3/VX0-X2 VH2-H3/VX0-X1 VH0-H1/VX0-X1 VH0-H2/VX0-X2 VH0-H3/VX0-X3 VH0-H1/VX1-X2 VH0-H2/VX1-X3 VH0-H3/VX2-X3
For a three-winding transformer, the ratios can be from the primary to both the secondary and the tertiary windings and can be used in further diagnosing which winding may have a problem. For example, in a wye/wye/wye configuration, Table 3-25 can be used to diagnose possible problems in the 0-1 phase of the transformer. Table 3-25: Using TTR to Diagnose Winding Problems Measure Voltage Apply Voltage H0-H1 H0-H2 H0-H3
15
X0-X1
Y0-Y1
Possible Diagnosis
Ratio Abnormal Ratio Abnormal
Ratio OK Ratio Abnormal Ratio Abnormal
Problem in X0-X1 Winding Problem in H0-H1 Winding
Ratio OK
Problem in Y0-Y1 Winding
®
From Megger Website: http://www.megger.com/us/products/ProductDetails.php?ID=233&Description=ttr.
129
Note that the TTR test can only indicate if one of the problems listed above is present in the transformer. It cannot pinpoint the exact location of the fault. This must be investigated via an internal inspection, which may involve un-tanking the transformer.
130
3.2.6 INSULATION RESISTANCE The insulation resistance test, also called Megger test, is used to determine the leakage current resistance of the insulation. The resistance is a function of the moisture and impurity content of the insulation as well as the insulation temperature. At a constant voltage, the resistance also depends on the strength of the electric field across the insulation and therefore is a function of the size and construction of the transformer. Primarily, this measurement gives information about the condition of the insulation and ensures that the leakage current is adequately small. 3.2.6.1
MEASUREMENT
Insulation resistance of a transformer is measured by means of a resistance meter using a DC voltage. In measuring resistance, it is recommended to always be sure that the tank and core are grounded. Each winding of the transformer is then short circuited at the terminals. Resistance measurements are made between each winding and all other windings grounded. Windings are never left floating during insulation resistance measurements. When any winding is installed with a solid ground, the ground must be removed in order to measure the insulation resistance of that winding to the other windings grounded. If the ground cannot be removed, the insulation resistance of that winding cannot be measured. It is treated as part of the grounded section of the circuit. Insulation resistance is expressed in mega ohms (M ). On a two winding transformer the following measurement configurations are used: 1. Measure from the high voltage winding to the low voltage winding and ground [H-LG] 2. Measure from the low voltage winding to the high voltage winding and ground [L-HG] 3. Measure from the high and low voltage winding to ground [HL-G] This test is easily performed in the field. Many manufacturers require that this test be performed prior to energizing a transformer, to preclude start up failure caused by entry of moisture into the transformer during shipment or storage. The test can also detect other ground circuits that may exist in the transformer that may have been caused by shipping damage. The test checks the complete circuit – bushings, leads and coils. The measurement duration is 1 minute. The resistance readings R15 and R60 are taken 15 and 60 seconds after connecting the voltage. In order to compare these readings with future measurements, it is important to record on the test report, the temperature, measuring voltage, the meter used, as well as the measured resistances. Since insulation resistances may vary with applied voltage, any comparisons must be made with measurements at the same voltage. WARNINGS The following precautions should be taken in performing the insulation resistance test:
131
The test should be discontinued immediately if the current begins to increase without stabilizing Under no conditions should the test be made while the transformer is under vacuum After the test has been completed all terminals should be grounded for a period of time sufficient to allow any trapped charges to decay to a negligible value 3.2.6.2
INTERPRETATION
The IEC Standard 60076-1 and the IEEE Standard C57.12.90 provide no limits for insulation resistances. However, the ratio R60:R15, also called the absorption ratio, is normally in the range 1.3 – 3 in a dried transformer. The condition of the insulation can also be determined by comparing the measured resistance at 1 minute, R60, to a minimum value for the voltage class of the winding. This comparison is performed only after all measurements are converted to their 20 °C equivalents using the coefficients in Table 3-26. For example, if the measured value is 20 M at 12 °C, according the table this measurement is equivalent to 11,8 (=20 x 0,59) M at 20 °C. The minimum measured resistance corrected to 20 °C is given by the relationship16 : R60
CE kVA
Where: kVA is the rated capacity of the winding under test, C is a constant: o 0.8 for oil-filled transformers at 20 °C, or o 16.0 for dry, compound filled or untanked oil filled transformers E is the voltage rating of the winding under test R60 is the 1 minute reading of insulation resistance of winding to ground with other windings grounded or between windings in M at 20°C Table 3-26: Insulation Resistance Correction Factors For Conversion of Test Temperature to 20 °C [74]
16
Temp (oC)
Coefficient
Temp (oC)
Coefficient
Temp (oC)
Coefficient
0 5 10 11 12 13 14 15 16 17
0.25 0.36 0.50 0.54 0.59 0.62 0.66 0.70 0.76 0.82
24 25 26 27 28 29 30 31 32 33
1.33 1.40 1.50 1.60 1.74 1.85 1.98 2.10 2.30 2.45
41 42 43 44 45 46 47 48 49 50
4.20 4.50 4.80 5.10 5.60 5.95 6.20 6.80 7.20 7.85
M. Horning et. al., Transformer Maintenance Guide, pp. 108-109, 2001
132
3.2.6.3
Temp (oC)
Coefficient
Temp (oC)
Coefficient
Temp (oC)
Coefficient
18 19 20 21 22 23 24
0.86 0.96 1.00 1.08 1.15 1.25 1.33
34 35 36 37 38 39 40
2.60 2.80 3.00 3.20 3.40 3.70 3.95
55 60 65 70 75 80
11.20 15.85 22.40 31.75 44.70 63.50
POLARIZATION INDEX
Polarization index is the relationship between the measured resistance after 10 minutes and that measured after 1 minute. Since the conduction processes are enhanced for an insulation system that is contaminated with moisture or impurities, the leakage current will increase at a greater rate than for a dry, clean insulation. Consequently, under the same test configuration, the insulation resistance of a wet or contaminated insulation system will settle faster and at a lower value than that for a dry insulation. The result is that the polarization index for a wet insulation will be lower than that for a dry insulation system. Since the polarization index is a ratio, it does not require conversion to a common temperature base before comparisons can be made. It also does not require for there to be previous measurements before an assessment of the insulation condition can be made. The following guidelines are used to assess the condition of insulation based on the polarization index. Table 3-27: Polarization Index Interpretation Guide
Polarization Index <1 >2
Insulation Condition Unsatisfactory Good
133
3.2.7 INSULATION POWER FACTOR TESTS Insulation power factor tests are performed on transformer insulation to determine the condition of the capacitive insulation between the windings, between windings and core, and between windings and the tank or other grounded components in the transformer. There are three test modes essential to the evaluation of an insulation system: Ungrounded Specimen Test (UST), Grounded Specimen Test (GST), and Grounded Specimen Test with Guard (GST/g). These configurations allow various sections of the insulation system to be tested separately. Power factor test instruments typically have three leads: an output high-voltage lead for energizing the test object, input measurement, and ground leads that measure current through the insulation system. Internally, switches allow either input lead to be connected to a current/wattmeter input or guard, depending on the testing configuration. In the UST configuration, current flowing in the insulation between the high-voltage lead and the measurement lead is measured by connecting the measurement lead to the current/wattmeter input. The ground lead is connected to the guard, and therefore currents that flow through the ground lead are not measured by the meter. In the GST configuration, all currents flowing from the HV lead to ground are measured by the meter. This is accomplished by internally connecting both the measurement and the ground leads to the input of the current/wattmeter. In the GST/g configuration, the measurement lead is connected to the guard, and the ground lead is connected to the input to the current/wattmeter device. The only measured current is what is in the direct path from the HV lead to ground. The UST values can also be calculated from the difference between the measured GST and the GST/g values. The reason for making all these measurements is to allow for the evaluation of the various sections of insulation in the transformer. However, the most important of these measurements is the UST test, since it measures across the major insulation of the transformer. The power factor is calculated from the measured current and watts loss recorded by the meter according to the following equation: PF(%) = 10 x Loss(Watts)/Current(mA) A system that is widely used by utilities in measuring power factor of insulation systems is Doble Engineering’s M4000 Automated Insulation Analyzer shown in Figure 3-16.
Figure 3-16: Doble M4000 Automated Insulation Analyzer 17
17
From the Doble Engineering Website: www.doble.com
134
3.2.7.1
T WO-WINDING T RANSFORMER
In order to perform power factor tests on a three phase, two-winding transformer, it is necessary to connect all high-voltage bushings together and all low-voltage and neutral bushings together.
Figure 3-17: Schematic of Two-Winding Transformer Insulation Capacitance for Power Factor Measurements 18
The capacitance between these two terminals and between each terminal and the ground terminal, represented by the tank and core, are shown schematically in Figure 3-17. In Figure 3-17, the capacitances are defined as follows: CH represents the insulation between the high-voltage winding conductor and the grounded tank and core. The capacitance takes into account the HV bushings, structural insulating members, the de-energized tap changer insulation, and the insulating fluid. CL represents the insulation between the low-voltage winding conductors and the grounded tank and core. The capacitance takes into account the LV bushings, the winding insulation, the structural insulating members, the LTC insulation, and the insulating fluid. CHL represents the insulation between the high- and low-voltage windings and includes the winding insulation barriers and the insulating fluid.
18
The IEC equivalent nomenclature for the winding terminals is as follows: H1=1U; H2=1V, H3=1W; X1=2U; X2=2V; X3=2W, X0=2N
135
3.2.7.1.1
Testing of Two-Winding Transformers
For a two-winding transformer, there are six different tests that are performed to assess the insulation condition in the various parts of the transformer insulation. For each test, high voltage is applied to one set of windings, and current from the other winding and the ground terminal are fed into the measurement equipment. Table 3-28 shows which measurement lead is applied to the transformer windings for each test configuration. It also shows which measurement leads, if any, are guarded and ultimately the insulation capacitance that is measured. Figure 3-18 - Figure 3-23 show the actual test setup for the tests described in Table 3-28. Table 3-28: Power Factor Measurement Setup for Two-Winding Transformers Test Mode
HV Winding
LV Winding
Tank/Core
GST GST/g
HV Lead HV Lead
Gnd. Lead Gnd. Lead
UST
HV Lead
Meas. Lead Meas. Lead (on guard) Meas. Lead
GST GST/g UST
Meas. Lead Meas. Lead (on guard) Meas. Lead
HV Lead HV Lead HV Lead
Gnd. Lead (on guard) Gnd. Lead Gnd. Lead Gnd. Lead (on guard)
Measured Capacitance CH+CHL CH CHL CL+CHL CL CHL
Figure 3-18: Power Factor Measurement of CHL + CH Insulation (GST)
136
Figure 3-19: Power Factor Measurement of CH Insulation (GST/g)
Figure 3-20: Power Factor Measurement of CHL Insulation (UST)
137
Figure 3-21 : Power Factor Measurement of CHL + CL Insulation (GST)
Figure 3-22: Power Factor Measurement of CL Insulation (GST/g)
138
Figure 3-23: Power Factor Measurement of CHL Insulation (UST)
3.2.7.2
T HREE-WINDING T RANSFORMER
The various insulation capacitances of a three-winding transformer are shown in Figure 3-24. The power factor of each of these insulation sections can be examined by the measurement configurations defined in Table 3-29.
Figure 3-24: Schematic of Three-Winding Transformer Insulation Capacitance for Power Factor Measurements
139
Table 3-29: Power Factor Measurement Configuration for Three-Winding Transformers Test Mode
HV Winding
LV Winding
TV Winding
Tank/Core
GST/g
HV Lead
Gnd. Lead
CL
Gnd. Lead
CT
UST
Meas. Lead (on guard) Meas. Lead (on guard) HV Lead
Meas. Lead (on guard) Meas. Lead (on guard) HV Lead
Gnd. Lead
GST/g
Meas. Lead (on guard) HV Lead
Measured Capacitance CH
CHL
UST
HV Lead
UST
Gnd. Lead (on guard)
Gnd. Lead (on guard) Gnd. Lead (on guard) Gnd. Lead (on guard)
GST/g
3.2.7.3
Meas. Lead (on guard) Meas. Lead Gnd. Lead (on guard) HV Lead
Gnd. Lead (on guard) Meas. Lead Meas. Lead
CHT CLT
TYPICAL I NSULATION POWER FACTOR VALUES
In a study conducted by Doble Engineering Company, the power factor for the highvoltage winding to ground insulation for 760 transformers shows the distribution shown in Figure 3-25. The corrected power factor for up to 95 percent of the transformers was below 0.7 %.
Figure 3-25: High Voltage to Ground Insulation Power Factor for Representative Good Insulation Systems
140
3.2.7.4
GENERAL GUIDELINES FOR ASSESSING POWER F ACTOR VALUES
In making an assessment of a power factor reading, it is advisable to compare the test results to previous measurements. The rate of increase in power factor would show a condition that has stabilized or is rapidly deteriorating. The following are general guidelines provided by Doble Engineering in assessing power factor results for oil-filled power transformers: Table 3-30: Power Factor Diagnosis for Oil-Filled Power Transformers Power Factor Reading 0.5% >0.5% BUT 0.7% >0.7% BUT 1.0% (& Increasing) >1.0%
Possible Insulation Condition Good Deteriorated Investigate Bad
For oil-filled distribution transformers, the power factor numbers in the table are doubled. For power factor values that are classified as bad or investigate, other test methods are necessary to positively identify the cause of the high power factor. Such tests include dissolved gas-in-oil analysis, moisture-in-oil analysis, dielectric frequency response analysis (DFR), frequency response analysis (FRA/SFRA), and power factor tip-up test. Most of these tests are discussed in more detail in later sections. A discussion of the power factor tip-up test follows. 3.2.7.5
POWER FACTOR T IP-UP T ESTS
The power factor tip-up test is performed by applying voltage in equal steps from zero to the maximum allowed voltage. The test is performed on the section of insulation with highest power factor reading. For each applied voltage, the current and watts loss through the insulation is measured, and the power factor is calculated. If moisture or other polar contaminants are the cause of the high power factor, the measured power factor will be essentially the same for all applied voltages. If the power factor increases with voltage, there is likely ionic contamination and/or carbonization of the oil or windings for oil-filled transformers. For dry type transformers, the problem may be due to ionic contaminants or the presence of voids in the winding insulation.
141
3.2.8 CORE INSULATION RESISTANCE MEASUREMENT Generally, the core laminations in a core form type transformer are insulated from ground, and the core is deliberately grounded at a single point. Measurement of the core insulation resistance allows for investigating accidental grounds which result in circulating currents if there is more than one connection between the core and ground. The dielectric withstand of the core-to-ground insulation is typically specified to be above 2 kV AC. The intentional core ground connection is usually mounted under a manhole at the top of the transformer or through the tank wall via a small low-voltage bushing. Either design allows the ground to be easily disconnected and allows a measurement of the resistance between core and ground. However, there are shell form designs in which the core ground is inaccessible. In such cases this measurement cannot be made. Several factors can lead to an inadvertent ground connection to the core: the coreground insulation can deteriorate to a point where the insulation becomes resistive; the core-ground insulation can become damaged during transportation of a transformer; or the core-ground insulation can become damaged in a through-fault incident. If an unintentional core ground is established as a result of any of the above conditions, there will likely be circulating currents in the core. The result will be hotspots in the core and surrounding metal structures. The presence of these hotspots can be detected using a DGA screening. Key gases to look for are ethane, ethylene, and/or possibly methane. Depending on the location of the hotspots, cellulose may be involved, and the gases may include CO and CO2. 3.2.8.1
MEASUREMENT AND DIAGNOSIS OF INADVERTENT CORE GROUNDS
The gas signature attributable to hotspots due to inadvertent core grounds can also be present if there is a poor connection at the bottom of a bushing or a bad tap changer contact. Therefore, this test is only necessary if a winding resistance test shows that all connections are good and if the tap changer contacts are assessed to be in good condition. The test is performed using a standard DC Megger® such as the one shown in Figure 3-26. The two test leads of the Megger test set are connected between the isolated core-ground lead and the transformer ground. A DC voltage of no more than 1000 volts is applied across the leads, and the resistance is measured. Depending on the resulting resistance, Table 3-31 can be used to guide what action must be taken.
142
Figure 3-26: DC Megger Test Set (Courtesy of Megger)19
Table 3-31: Diagnosing Inadvertent Core-Ground Problems Measured Core Ground Resistance 1000 M 100 M 10 to < 100 M 1 to < 10 M
Possible Interpretation New transformer. Good coreground insulation. Service aged transformer. Acceptable core ground insulation. Deteriorating core ground insulation. Deteriorated insulation is possible cause of circulating currents.
200-1000 Ohms
Possible high-resistance ground between core and ground.
< 10 Ohms
Solid connection between core and ground.
Action NONE NONE Investigate cause of deterioration and mitigate. Investigate and correct before re-energization. Check to make sure a limiting resistor is not being used in the core-ground circuit. If not, there is a possible high-resistance ground that must be corrected. Investigate and correct before re-energization.
If the core-ground insulation is less than 10 M , the first step in investigating the inadvertent ground connection is to switch to an ohmmeter and measure the resistance between the core and ground. This should help establish whether there is a solid ground connection or a high-resistance ground present. In either case, there are field techniques available in eliminating the unintentional grounds (see IEEE Standard 62).
19
From AVO website: http://www.avomegger.com/.
143
3.2.9
EXCITATION CURRENT TESTS
The excitation current test is one of the means of identifying problems associated with the core or winding of the transformer. The test can possibly detect core problems such as shorted core laminations and poor joints. Winding problems detected include short circuited or open circuited turns, poor electrical connections, tap changer problems, and other possible core and winding problems. The exciting current consists of a magnetizing component and a loss component. The magnitude of the magnetizing component is determined by the shape of the performance curve of the core steel, its operating flux density, and the number of turns in the primary winding. The loss component is determined by the losses in the core. Joint construction severely affects the magnitude of the excitation current. Changes in the hysteresis and eddy current characteristics due to handling the steel also affect the excitation current. To perform the test, voltage is applied to the primary windings one at a time with all other windings left open. The excitation current of a transformer is the current which the transformer draws when voltage is applied to its primary terminals with the secondary terminal open. It is important to perform the excitation current tests before any direct current (DC) tests. DC tests leave a residual magnetism in the core that would distort an excitation current test. Before performing an excitation current test, the following steps are necessary [75]: Disconnect all loads and de-energize the transformer. It is recommended that the test voltage be applied to the HV windings. Exercise caution in the vicinity of all transformer terminals because voltage will be induced in all windings during a test. Winding terminals normally grounded in-service should be grounded during tests, except for the particular winding energized for the test. For routine tests, the load tap changer (LTC) should be set to neutral, then to one step above neutral, then to one step below neutral, and then to full raise or full lower. To ensure that the tap selector is functioning properly throughout the entire range of selection, you may want to perform tests on all LTC positions. Test voltages should not exceed the rated line-to-line voltage for deltaconnected windings or rated line-to-neutral voltage for wye-connected windings. These tests are generally made at 2.5, 5, or 10 kV, as the capacity of the test equipment permits. Test voltages should be the same for each phase. Because of the nonlinear behavior of exciting current, test voltages should be set accurately if results are to be compared. If excitation tests have previously been performed, the same test voltage should be used for the current test.
144
Excitation current tests performed on all tap positions of a transformer with a reactance-type load tap changer can have the following patterns. The currents measured on the even steps and neutral positions are similar to each other but different from those measured on the odd steps. The currents measured on the odd steps are similar to each other. The difference is attributed to how the reactorswitching device is connected to the tap winding when the tap is on an even or odd position. For the even numbered and neutral positions, the two contacts of the reactor-switching device are on the same stationary contact. For odd numbered positions, the switching contacts bridge adjacent stationary contacts [76]. 3.2.9.1
MEASUREMENT SETUP
The excitation current test can be performed using any high-voltage source and a precision amplifier. However, since both are present in a power factor test set, these test sets are normally used to perform the excitation current test. The testing mode for all measurements is set to UST (Ungrounded Specimen Test). See Figure 3-27, Figure 3-28, and Figure 3-29 for the setup of the excitation current measurements for various transformer configurations. Table 3-32 is a summary of the test connections and the means for analyzing test results. For single phase transformers, the test is performed with high-voltage windings energized alternately from opposite ends and reading the excitation current in both configurations. The two currents obtained should be the same. Currents recorded for single phase transformers should be compared either with similar units or with data obtained from previous tests on the same unit. If single phase excitation current tests were included in the factory test specifications, comparing test data reveals changes undergone between the factory and the field. For three phase wye-connected transformers, the three measurements routinely made are H1-H0, H2-H0, and H3-H0. The usual pattern of the exciting current values is such that two of the measured currents are high and similar, and the remaining one is lower. The lower value is usually associated with the winding wound on the middle leg because the reluctance of the magnetic circuit associated with this winding is lower than the other two windings. This should also be done on the individual phases of three phase transformers if the unit is suspect, or if the initial exciting current measurements are questionable. For three phase delta-connected transformers, the three measurements routinely made are H1-H2, H2-H3, and H3-H1. The usual pattern for these transformers is two measured currents that are approximately equal and higher than the third measured current. Again, the lower current value is ordinarily associated with the winding wound on the middle leg [77]. With delta-connected transformers, the two highervalued currents are occasionally not equal. This can be attributed to the shunting affect of the un-energized winding being parallel with the energized winding. Test procedures are available to eliminate the shunting effect of the un-energized winding [76].
145
Table 3-32: Excitation Current Test Connection Using Power Factor Test Set20 Transformer Type and Connection
Energized Lead
Measurement 21 Lead
Floating Terminals
Measured Excitation Current
Normal Current Pattern
Single Phase
H1 H2
H2 H1
X1 X2 X1 X2
IH1-H2 IH2-H1
IH1-H2 ~ I H2-H1
Three Phase Core Form W ye-Connected 3-limb core
H1 H2 H3
H0 H0 H0
H 2 H 3 ,X1 X2 X3 H 1 H 3 ,X1 X2 X3 H 1 H 2 ,X1 X2 X3
IH1-H0 IH2-H0 IH3-H0
(IH1-H0 ~ IH3-H0 ) > I H2-H0
Three Phase Shell Form W ye-Connected D core
H1 H2 H3
H0 H0 H0
H 2 H 3 ,X1 X2 X3 H 1 H 3 ,X1 X2 X3 H 1 H 2 ,X1 X2 X3
IH1-H0 IH2-H0 IH3-H0
(IH1-H0 ~ IH3-H0 ) > I H2-H0
Three Phase Core Form W yeConnected 5-limb core
H1 H2 H3
H0 H0 H0
H 2 H 3 ,X1 X2 X3 H 1 H 3 ,X1 X2 X3 H 1 H 2 ,X1 X2 X3
IH1-H0 IH2-H0 IH3-H0
IH1-H0 ~ IH2-H0 ~ I H3-H0 (The middle phase may be slightly higher)
Three Phase Shell Form W ye-Connected 7-limb core
H1 H2 H3
H0 H0 H0
H 2 H 3 ,X1 X2 X3 H 1 H 3 ,X1 X2 X3 H 1 H 2 ,X1 X2 X3
IH1-H0 IH2-H0 IH3-H0
(IH1-H0 ~ IH3-H0 ) > I H2-H0
Three Phase DeltaConnected
H1 H2 H3
H2 H3 H1
X1 X2 X3 X1 X2 X3 X1 X2 X3
IH1-H2 IH2-H3 IH3-H1
(IH2-H3 ~ I H3-H1 ) < I H1-H2
Ground Lead
H3 H1 H2
Table 3-32 lists the forms of transformer construction, the associated magnetic core configuration, and the usual pattern of core excitation current measurements. In old designs with non-step lap cores, the quality of the joint gaps has a large effect on the magnitude of the exciting current such that end phases can have significantly different measured values of exciting current. The magnitude of the difference can well be in the same range or even higher than the difference between the measured exciting current of the middle and end phases. Therefore, the rules on the relative magnitudes of the exciting current may not apply to these cores. In such cases, only much greater differences need to be considered as an indication of a problem.
20
The IEC equivalent nomenclature for the winding terminals is as follows: H1=1U; H2=1V, H3=1W; H0=1N; X1=2U; X2=2V; X3=2W, X0=2N 21 All measurements are performed with the test set in UST mode. If the secondary winding is wye connected, the neutral (X0) should be connected to ground.
146
Figure 3-27: Excitation Current Test Method for Single Phase Transformers
Figure 3-28: Excitation Current Test Method for Three Phase Wye-Connected Transformers
Figure 3-29: Excitation Current Test Method for Three Phase Delta-Connected Transformers
147
3.2.9.2
ANALYSIS OF EXCITATION CURRENT RESULTS
If the excitation current is less than 50 mA, the difference between the two higher currents for a three phase transformer should be less than 10 %. If the excitation current is greater than 50 mA, the difference should be less than 5 %. In general, if there is an internal problem, these differences will be greater. When this happens, other tests should also show abnormalities and an internal inspection should be considered. If factory tests or prior tests exist, the results should be compared with them to assess any deviations. High precision does not appear to be necessary in excitation current tests. The serious faults that have been found have increased excitation current magnitudes by greater than 10% over normal values [75].
148
3.2.10 INFRARED THERMOGRAPHY ANALYSIS OF TRANSFORMERS AND ACCESSORIES Thermography is a method of inspecting electrical and mechanical equipment by obtaining heat distribution pictures. This inspection method is based on the fact that most components in a system show an increase in temperature when malfunctioning [78]. Any localized problems caused by a change in local resistance will consume more power and generate heat. The local temperature of the resulting hotspot will be higher than the surrounding temperatures or that of a reference point. By observing the heat patterns in operational system components, infrared thermography is now used to detect loose connections, unbalanced load and overload conditions, component deterioration, and other potential problems [79]. 3.2.10.1
T HE T HERMOGRAPHY PROCESS
The inspection tool used by thermographers is the thermal imager (infrared camera). These are sophisticated devices that measure the natural emissions of infrared radiation from a heated object and produce a thermal picture. Modern thermal imagers are portable with easily operated controls (see Figure 3-30 for an example IR camera). As physical contact with the system is not required, inspections can be made under full operational conditions, resulting in no downtime.
Figure 3-30: Infrared Camera - FLIR Model ThermaCAM® P65 22
When an object is heated, it radiates electromagnetic energy. The amount of energy is related to the object’s temperature. The thermal imager can determine the temperature of the object without physical contact by measuring the emitted energy. The energy from a heated object is radiated at different levels across the electromagnetic spectrum. In most industrial applications, it is the energy radiated at infrared wavelengths which is used to determine the object’s temperature. The thermal imager focuses the emitted energy via an optical system onto a detector. The detector converts infrared energy into an electrical voltage which is used to build the thermal picture in the operator’s viewfinder on board the thermal imager after amplification and complex signal processing.
22
FLIR website: http://www.flirthermography.com/cameras/camera/1016/.
149
3.2.10.2
CRITERIA FOR EVALUATING INFRARED MEASUREMENTS
When carrying out thermographic inspections, faults are often identified by comparing heat patterns in similar components operating under similar loads. There is typically software available with the infrared camera to analyze the temperature signature of the object under test. A reference point is established on the object for normal temperature. The temperature rise of all other points on the object is then evaluated in relation to the reference point temperature. If there are hotspots on the object, the criticality of the hotspots is evaluated in regards to the magnitude of deviation from the reference temperature (temperature rise above reference). There are several guidelines for diagnosing the criticality based on the temperature rises. For example, in performing temperature-rise tests on transformers, it is recommended that the surface temperature of the tank, as measured by an infrared camera, be no more than 20 °C higher than the top oil temperature of the transformer [80]. Criteria established by NASA in evaluating electrical components at its facilities are given in Table 3-33. Table 3-33: Infrared Temperature Criteria 23
3.2.10.3
Criticality
Temperature Above Reference, Industry
Nominal
0 to 10 oC
Intermediate
10 to 20 oC
Serious
20 to 40 oC
Critical
over 40 oC
Condition Nominal possibility of permanent damage. Repair next maintenance period. Possibility of permanent damage. Repair soon. Probability of permanent damage to item and surrounding area. Repair immediately. Failure imminent.
EXAMPLE USES OF INFRARED T HERMOGRAPHY DIAGNOSTICS ON POWER T RANSFORMERS [81]
This section provides a few examples24 of the use of infrared thermography to diagnose problems in transformers and accessories. 3.2.10.3.1
Loose connection at bushing outlet terminal
When there is a loose connection at the terminal from the bushing to the bus work, it will lead to overheating of the bushing top terminal when under load. The thermograph will show the bushing terminal as hot, while the body of the porcelain will show normal temperatures. Figure 3-31 shows a thermograph of a hot bushing terminal.
23
NASA RCM Specs. Examples are used courtesy of FLIR Systems: www.flirthermography.com.
24
150
Figure 3-31: Bushing Terminal Overheating Thermograph 3.2.10.3.2
Blocked oil flow in radiators or radiator shut off
In case of a malfunction that stops or restricts the flow of oil through a radiator, this will show up on an infrared scan. The image will reveal dim areas where the oil flow is restricted and brighter areas where normal oil flow is taking place.
Figure 3-32: Thermography of a Shut-Off Radiator Bank
3.2.10.3.3
LTC overheating
Under normal operating conditions and because of I2R and eddy current heating, the main tank of a transformer will have a higher temperature than the LTC tank in which there is essentially no heat generation under non-switching conditions. If hotspots develop in the LTC compartment, this will increase the overall temperature of the LTC compartment, which may become hotter than the main transformer tank. Such a situation will be evident on an infrared scan, as shown in Figure 3-33.
151
Figure 3-33: LTC Compartment Overheating Due to Possible Hotspots in LTC 3.2.10.3.4
Low oil level in transformer or bushing
If a transformer (or especially a bushing) has a low oil level, a thermograph will show a dim image for the region without oil and a much brighter image in the areas with oil. An example of this defect is shown in Figure 3-34.
Figure 3-34: Low Oil Level in Transformer 3.2.10.3.5
Moisture contamination of surge arrester
When the internal components of an arrester become contaminated with moisture due to poor sealing or defects in the porcelain, the resistance of the internal components will increase. Depending on the extent of the contamination, sections of the surge arrester body will show localized overheating as compared to other arresters on the transformer. In this case, the moist regions will show up as dim regions in the thermograph image [82].
152
3.2.11 3.2.11.1 3.2.11.1.1
BUSHINGS
ANSI & IEC – COMMON DIAGNOSTIC T OOLS Oil leakage inspection
A visual inspection for leakage may be performed during normal station supervision. 3.2.11.1.2
Insulator inspection and cleaning
Under conditions of extreme pollution it may be necessary to clean the insulator surface. The bushing MUST be offline before and during any cleaning operations. 3.2.11.1.2.1
Porcelain insulators
Clean the porcelain insulator with water-jet or wiping with a moist cloth. If necessary, ethyl-alcohol or ethyl-acetatte may be used. 3.2.11.1.2.2
Silicon rubber insulators
Clean the porcelain insulator with water-jet or wiping with a moist cloth. If necessay, ethyl-alcohol or ethyl-acetatte may be used. 1,1,1, -Thrichlorethane or Methylchloride are not recommended due to their possibly harmful and environmentally detrimental properties. 3.2.11.1.3
Thermovision
Hot spots on the bushing surface can be detected by using an Infrared (IR)-sensitive camera (see Figure 3-35). At maximum rated current, the bushing outer terminal should show a temperature of about 35-45 °C above the ambient air. Significantly higher temperatures, especially at lower current loading, can be an indication of bad connections.
Figure 3-35 : Measurement indicating poor current path between bushing inner and outer terminal
153
3.2.11.1.4
Oil sampling from bushing
Oil samples shall preferably be taken during dry weather conditions. If, due to some urgent reason, the sample is taken under any other conditions, the following must be observed: -
Clean the area around the sampling plug carefully. Protect the area around the sampling plug from rain.
The internal pressure of the bushing must not be altered before and after the sampling as the bushing is supposed to work within a specified range. This requirement is satisfied if the sample is taken when the mean temperature of the bushing is between 0°C and 30°C. The time when the bushing is open shall be as short as possible. Flushing with dry air or nitrogen is normally not necessary. The oil removed from the bushing shall always be replaced by the same volume of new transformer oil. The new oil shall comply with IEC 296, class II and shall be clean and dry. The gasket shall always be replaced when the bushing is re-sealed. Sampling procedure for GOB, GOE and GOH The sample is taken from a plug in the top of the bushing, preferably with a syringe with a rubber hose connected. The location for the sampling plug is shown in Figure 3-36. The dimension of the gasket is given in Table 3-34. The material of the gasket shall be Nitrile rubber with a hardness of 70 Shore.
154
Figure 3-36 : Location of oil sampling plugs on some of the most common bushing types.
The tightening torque for the M8 sealing plug on GOB, GOE and GOH shall be 20 Nm. The tightening torque for the M16 sealing plug on GOE shall be 50 Nm. Table 3-34: Dimensions for gaskets.
Gasket M8 M16 5/8"
d (mm) 8 14 14
D (mm) 16 35 35
T (mm) 3 4 4
Sampling procedure for GOEK, GOM and other bushings with sampling valve on the flange
Connect the end of the hose to a suitable nipple and connect the nipple to the valve on the flange. The thread in the valve is (R 1/4") BSPT 1/4". Suck out the oil. Depending on the temperature the pressure inside the bushing might be above or below atmospheric pressure. After the sampling is finished the bushing shall not be energized within 12 hours. Sampling procedure for GOA, GOC and GOG
On the GOA, GOC and GOG bushings, the oil samples are taken from the hole for the oil level plug on the top housing as shown in Figure 3-36. If the bushing is vertically 155
mounted, the oil level is right at the plug level at 20°C. The sample is sucked out by a syringe. If the oil temperature is slightly higher than 20°C the oil level will be above the plug level. In such a case the hose on the syringe should be equipped with a nipple as shown in Figure 3-37. The oil plug is removed and the hose with the nipple is attached immediately. If the temperature is below 20 °C, the oil level will be below the plug and the sample is sucked out according to Figure 3-38. The tightening torque for the 5/8" sealing plug shall be 50 Nm.
Figure 3-37 : Sampling on GOA at T>20 °C
Figure 3-38 : Sampling on GOA at T<20 °C
3.2.11.1.5
Dissolved Gas Analysis (DGA)
This method for diagnostics can only be used on oil filled bushings, for example, GOx types. Normally, it is not recommended to take oil samples from bushings. The bushing is sealed and tightness tested at the time of manufacturing. In order to take an oil sample, the bushing has to be opened and this introduces a risk of improper re-sealing after the sampling is finished. However, when a problem is known, for example high power factor over C1, there might be a need for oil sampling and gas analysis. The interpretation of the analysis is done according to Technical Report IEC 61464. If questions remain, ABB can assist with the evaluation. 3.2.11.1.6
Moisture analysis
There is a risk of improperly sealing a bushing if it is opened to take an oil sample. However, when a problem is known, for example high power factor over C1, there might be a need for oil sampling and moisture analysis. 156
It is sometimes difficult to get the proper moisture content in bushing oil. Compared to a transformer, a bushing has a much higher ratio of paper to oil. This means that regardless of the bushing manufacturing process, there will always be much more moisture in the paper than in the oil. In paper the moisture content is measured in percent, whereas in oil the moisture content is measured in parts per million (ppm). Depending on the temperature of the bushing, the moisture will move from the paper to the oil or from the oil to the paper. Due to this, a bushing will always show much higher moisture content in the oil after a certain time of high temperature operation. To get a proper value, the oil sample should be taken at least 48 hours after the entire bushing has reached room temperature. The bushing is delivered from ABB with maximum moisture content in the insulating oil of 3 ppm. If considerably higher concentrations are measured, the sealing system is likely damaged on the bushing. If the moisture content is greater than 10 ppm, a tan measurement of the bushing C1 capacitance should be performed. If the moisture content is greater than 20 ppm, the bushing should be taken out of service. 3.2.11.1.7
Dielectric Frequency Response Analysis (DFRA)
This method which is discussed elsewhere in greater detail in this handbook involves measuring the capacitance and dielectric losses over a frequency spectrum rather than at a fixed frequency. The status of the insulating material can be obtained from analyzing the measured loss and capacitance spectra. This method may in the future become the preferred method and an alternative to DGA for diagnosing bushing problems. The main advantages are that the bushing does not need to be opened and proper analysis can be performed regardless of the temperature of the bushing during the measurement. The shape and frequency shift of the spectra are the main elements used for diagnosis. 3.2.11.1.8
Partial Discharge measurements
Partial discharge measurement is primarily used as routine testing method by the manufacturer. Partial discharge may indicate external corona or internal insulation breakdown. If used for diagnostic on installed transformers it will show the sum of the partial discharges in the bushing and transformer insulation. External discharges in switchyards may be suppressed by use of external connected measuring coils. By use of newly developed acoustic sensors, partial discharges may be located. This method requires skilled personnel, who have knowledge of bushing and transformer design to do the measurement. 3.2.11.1.9
De-polymerization analysis
De-polymerization analysis is a method of determining ageing of cellulose in OIP bushings. The method requires that the bushing is taken apart and a paper sample is taken from the condenser body.
157
3.2.11.2
DIAGNOSTICS TECHNIQUES FOR BUSHINGS COMPLYING WITH THE ANSI/IEEE STANDARDS
3.2.11.2.1
Condenser Bushing Power Factor Tests
Table 3-35 shows a listing of the possible power factor tests for bushing insulation. The test connections for these tests are shown in Figure 3-39 – Figure 3-40. Table 3-35: Power Factor Tests for Bushings Test Mode
Center Conductor
UST GSTg
HV Lead Meas. Lead (on guard)
Potential/ Power Factor Tap Meas. Lead HV Lead
Flange
Measured Capacitance
Insulation Involved
Gnd. Lead Gnd. Lead
C1 C2
Main core insulation Tap insulation core insulation between tapped layer and bushing ground sleeve, portion of liquid or compound filler, portion of watershed near flange
Figure 3-39: Bushing C1 Power Factor Measurement Setup (UST)
158
Figure 3-40: Bushing C2 Power Factor Measurement Setup (GST/g)
In performing power factor tests on bushings, the following practice is recommended: Short circuit the windings under test Clean bushings to minimize the effects of surface leakage currents Ground opposite windings Remove test tap cover from bushing under test Perform C1 test in UST mode If necessary, perform overall test in GST mode Perform C2 test in GST/g mode Replace test cap cover
3.2.11.2.2
Factors Affecting C1 and C2 Capacitance and Power Factor Measurements
As mentioned above, the C1 and C2 capacitance of condenser bushings rated 115 kV and above are strictly controlled by design and are mainly dependent upon the condition of the oil-impregnated paper insulation. The power factor and capacitance test values under normal circumstances are not affected much by external factors. However, under conditions of contamination and high humidity, these measurements may be significantly affected. In addition, capacitively coupled resistive paths to ground may affect these measurements. These may include supporting structures, wooden crates that are moist/wet, resistance between bushing mounting flange and the transformer tank, stray effect from other objects, and external connections during testing. Although, the IEEE Standard C57.19.01 specifies a limit 0.5 % for C1 power factor for oil impregnated paper insulated bushings, ABB Type O Plus C, AB, and T condenser bushings have C1 power factor values that are well below this limit.
159
Condenser bushings rated 69 kV and below as mentioned earlier, have the main C1 capacitance, which is strictly controlled by design. The capacitance and power factor values behave the same behavior and characteristics as those for the 115kV and above bushings. However, these bushings have an inherent C2 capacitance, which is dependent upon a few outer layers of paper with adhesive, an oil gap between the flange and the condenser core, and the tap insulator. Variations in adhesive in the outer paper layers and other factors can result in power factor variations in bushings of the same style number. In addition, the close proximity of the C1 layer with the mounting flange results in greater fringing effect between the two parts. As a result of this, the porcelains, oil, and air surrounding the bushing can affect the C2 power factor test values. In particular, high current Type T condenser bushings with a short mounting flange and a long internal C1 layer/foil tend to exhibit higher power factors because of greater coupling effect between the C1 layer/foil and the surrounding materials. Depending upon the design, the C2 power factor of these bushings can range from 0.1 % to 2 %. It is important to note that the IEEE Standard does not specify any limit for C2 power factor. For bushings rated 69 kV and below, the IEEE Standard only requires stamping of C1 power factor and capacitance on the nameplate. As a result of frequent requests from customers, ABB Inc. Alamo, TN started stamping the C2 power factor and capacitance test values on bushing nameplates since December of 2002. With this addition, the nameplates of all AB, O Plus C, and T condenser bushings are now stamped with factory test values of C1 and C2 power factor and capacitance. However, because of the reasons mentioned above, users may see a greater variation in C2 power factor and capacitance values in different bushings of the same design. It is important to compare the initial test values before installation with the nameplate values. To verify nameplate values (especially for Type T bushings), the measurements should be made with the bushing mounted on a metallic test tank/stand with the lower end porcelain immersed in dry good quality oil. There should be sufficient clearance (at least 16 - 20 inch) from the bushing lower porcelain/terminal to the grounded tank. For C2 measurement, the center conductor should be guarded and the test tap voltage should not exceeding 1 kV. Once the bushing has been installed in the apparatus, it should be retested to establish a benchmark value. It is important to compare the subsequent field test values with the initial benchmark value after installation. Table 3-36 provides typical and questionable power factor values for bushings from several manufacturers and of various types.
160
Table 3-36: Typical Bushing Power Factors 25 Manufacturer
Type
Typical PF (%)
Questionable PF (%)
General Electric
A
Through Porcelain
3
5
General Electric
A
High Current
1
2
General Electric
B
Flexible cable, compound-filled
5
12
General Electric
D
1.0
2.0
General Electric
F
0.7
1.5
General Electric
L
1.5
3.0
General Electric
LC
0.8
2.0
General Electric
OF
0.8
2.0
General Electric
S
1.5
6
General Electric
U
LAPP
ERC
LAPP
PRC, PRC-A
Ohio Brass Ohio Brass Ohio Brass Ohio Brass Westinghouse Westinghouse
Class LKType A ODOF, Class G, Class L ODOF, Class G, Class L S, OS, FS RJ D
Description
Oil-filled upper portion, sealed Oil-filled, sealed Oil-filled upper portion, sealed Oil-filled upper portion Oil-filled expansion chamber Force C & CG, Rigid Core Compound-filled
Epoxy Resin Core, plastic or oil-filled Paper Resin Condenser Core
0.8
0.8
0.4 1.0-5.0 2.0-4.0 Solid Porcelain Semi Condenser
0.8 1.0 1.5
1.5
1.5
Typical C2 power factors for older PRC design range from 4-15% due to injected compound during manufacturing process
1.0 Change of 22% from Nameplate value Change of 16% from Nameplate value 2.0 2.0 3.0
1.5
3.0
Westinghouse
1.0
2.0
0.25-0.5
0.5-1.0
25
Type S Form F, DF & EF were redesigned as Type B, BD, and BE respectively
See special instructions for Type U in section that follows.
Westinghouse
Modern Condenser Bushings
Comment Type S, no form letter (through porcelain) redesigned as Type A
Manufactured prior to 1926 and after 1938 Manufactured between 1926 and 1938
Bushings on OCB and instrument transformers 92 kV to 139 kV (except Type O, O-A1, OC, and O+C) Bushings on power and distribution transformers of all ratings (except Type O, O-A1, OC, and O+C) (e.g. ABB Type A, O+C)
Doble Testing Power Apparatus Bushings, 2004 International Conference of Doble Clients
161
3.2.11.2.3
Bushing Hot Collar Test
In cases where a bushing does not have a bushing tap, the C1 and C2 power factor measurements described above cannot be performed. In such cases, a hot collar test is performed. This test applies to compound-filled bushings, solid porcelain bushings, gasfilled bushings, and oil-filled bushings that are not equipped with taps and for which the bushing overall test cannot be performed. The hot collar test is also useful for various other bushing checks: To check bushing oil level on oil-filled bushings without either sight glasses or liquid level gauges For bushings with suspect or defective oil level gauges, to check bushing oil level As a supplement test when overall or tap tests indicate possible problem. The test is performed by applying single or multiple collars to various sections of the bushing. Figure 3-41 shows the setup for a single-collar test in UST mode. This configuration measures a portion of the insulating watershed, sight glass, core insulation in upper area, and liquid or compound filler in the upper area of the bushing. Figure 3-42 shows a similar setup but in GST mode. In addition to the items measured in the UST mode, this configuration also measures the surface leakage from the collar to the LV lead and from the collar to the bushing flange. Because the test measures smaller sections of material, very small dielectric losses and currents are recorded. Consequently, small changes in either value have tremendous impact on the value of the calculated power factor. It is therefore advisable to use the value of the measured dielectric loss as the determining factor in assessing the results of the hot collar test. The recommended acceptable limits for hot collar tests are 0.1 W at 10 kV and 0.006 W at 2.5 kV. Also, the dielectric loss for the same section in the same type of bushing should be approximately equal. As a cautionary note, because relatively small currents are being measured in this test, it is important to clean and dry the bushings before performing this test. The following cleaners have been suggested by various utilities: dry clean cloth, water and soap, ColoniteTM, and WindexTM with Ammonia. It is never recommended to use evaporative solvents on bushings.
162
Figure 3-41: Hot Collar UST Mode Power Factor Test
Figure 3-42: Hot Collar GST Mode Power Factor Test
A hot collar test can yield one of three results: watt losses in normal range, increased watt losses, or decreased current. Increased values in watt losses ( 0.1 W) typically indicate contamination in the insulation system. Decreased values in current (compared 163
to similar bushings) may indicate the presence of voids in the insulation or low liquid or compound level in the bushing. 3.2.11.2.4
What to do when Bushing Power Factor Tests are Doubtful
The following steps are helpful in confirming or clarifying bad bushing power factor results: 1. 2. 3. 4. 5. 6. 7. 8. 9.
Re-check all connections, including ground lead and bushing flange ground Make sure ground connection is good Check test circuit used for the measurement Check test set and test set leads Visually inspect bushing sheds and oil Clean and dry all surfaces Compare and analyze results of similar bushings Research the history of the bushing for flashover or line surge activity Verify temperature correction factor was used for C1 and overall tests (note that C2 power factors are not temperature corrected) 10. If still uncertain, contact the manufacturer 3.2.11.2.5 3.2.11.2.5.1
Special Case – Type “U” Bushings [83] History
General Electric, a major player in the electrical world since the early 1900s, was engaged in the development and manufacture of apparatus bushings since as early as 1920. In the quest to develop the best bushing in the world, GE created many different types and styles of bushings such as Types A, F, L, LC, OF, T, and U for both transformer and circuit breaker applications. Let’s concentrate on the Type U bushing history and technology first. Type U bushings were manufactured with voltage ratings from 15 kV through 800 kV. A Type U bushing is a condenser design with oil-impregnated paper inside an oil-filled shell. The shell consists of a cap, an upper porcelain weather casing, a metal mounting flange, a lower porcelain, and a lower porcelain support. For sealing purposes, all parts are held together under a centrally clamped spring tension method. The principle behind a condenser bushing is to incorporate equal capacitance layers to provide equal voltage steps, resulting in a uniform voltage gradient throughout the bushing body and over the bushing surface. The type of design and the materials within a condenser core may differ between manufacturers, but the design intention is the same. The type of construction used in some Type U designs was a herringbone pattern, surface-printed ink that formed the capacitive layers. A plain Kraft paper was wound into the condenser between the active ink-lined paper layers. For most of the production, both the lined paper and the plain paper were .008 inches in thickness (see Figure 3-43).
164
Figure 3-43: Surface-Printed Ink Condenser
In 1979, American Electric Power Service Corporation reported increasing power factors in Type U bushings at the Doble Client Conference. Since 1979, the concern for the Type U bushing rising power factor has increased dramatically due to documented accounts of bushing failures. Do you have Type U bushings on your system? Most likely you do. From 1954 to 1986, the time period that GE was manufacturing Type U bushings, GE was the leader with 65 to 70 percent of the US market. They were supplying bushings to their own transformer manufacturing facilities and to other transformer manufacturers, as well as supplying replacement bushings directly to end users. In this timeframe, the Type U bushing was known as the best product on the market, utilizing standardization of parts with a proven field record. So, what is the cause(s) related to the increase in power factor in Type U bushings? Through Doble Client Conferences, utility feedback, insurance company reports, General Electric documents, and our own investigations, ABB has accumulated data and has the following concern for Type U bushings. The condenser design with ink-lined paper with plain Kraft paper allowed a gap at the ends of the active layers in the condenser core. A heavily loaded transformer will generate heat internal to the bushing, subject the bushing to a higher immersion oil temperature, and consequently increase internal temperature in the bushing. The heated bushing oil expands and intensifies the pressure in the confined gas space, which causes an increased quantity of gas to become dissolved in the oil. Cyclic reduction in transformer load and/or reduction of ambient temperature allow cooling of the bushing oil. As the oil cools, it contracts, reducing the pressure of its gas blanket. If the pressure reduction occurs rapidly enough, the gas-saturated oil will develop a tendency to evolve bubbles of gas. This evolution will first occur in the highest 165
electrically stress regions of the bushings, normally between the lined paper and the plain paper layers of the bushing core. A critical combination of gas bubbles and dielectric stress causes partial discharges to occur within the insulation system. The long-term effect of the discharges is an increase in the dielectric losses in the insulation system, resulting in an increased power factor. Have you heard of migrating ink? This is a process that could also be a contributing factor to Type U bushing rising power factors. Although GE designed and specified the herringbone ink process, they did not manufacture the paper, nor did they apply the Rescon conductive ink. The paper/ink process was completed by outside contractors. Reports as early as 1979 show that portions of the Rescon ink “herringbone pattern” had transferred from the printed paper layers to the plain Kraft paper layers. Investigations have revealed where Rescon printed paper made contact with the overlapping plain paper, evidence of corona action or evidence of slight burning was found. (See Figure 3-44) Ink/particulates aggravated GE’s manufacturing system. During the cutting of hued and plain Kraft paper while winding the condensers, ink/paper particulates were generated, further complicating the rising power factor phenomenon. By 1985, GE had made many internal quality improvements to the design and processing of bushings. GE implemented an oil flushing procedure for all bushings in order to reduce the particles that may have originated with the bushing core insulation. Also, GE commissioned a new closed-loop continuous filtration oil system intended to improve bushing oil quality.
Figure 3-44: Rescon Conductive Ink Transfers from the Printed Paper Layers (left) to the Plain Kraft Paper Layers or Conductor (right), Resulting in Corona Action and Slight Burning (circled)
166
What kV ratings of Type U bushings used herringbone ink processing? The herringbone ink process was used in Type U bushings in the voltage range 15-345 kV. However, some Type U bushings in this voltage range have metal foil designed condensers. Most bushings 345 kV and above have foil designed condensers, but many have herringbone lined paper. Should you be concerned only with Type U condenser bushings rated 15-345 kV? Type U bushings were manufactured using a flex seal design. The flex seal is a copper diaphragm located in the top cap of bushings 161 kV and above. The flex seal (see Figure 3-45) was designed to allow for the expansion/contraction or movement of parts during thermal cycling of the bushing.
Figure 3-45: Flex Seal Design
The flex seal diaphragm in many cases, depending on catalog number and application, carries the current from the main conductor to the cap cover to the upper terminal connection. As the diaphragm experienced movement, acting as an accordion, the diaphragm could experience mechanical stresses, which would crack and result in a leak. Since the diaphragm is internal to the bushing, and is placed above normal oil level, where could the bushing leak? During processing of the oil in the transformer, the oil could be evacuated from the bushing by vacuum if the bushing was inclined, or the bushing could become filled with oil during the transformer vacuum/fill process. If the bushing is full of oil (with no expansion space) and if the bushing is applied at higher temperatures, the oil will expand and compromise the gasketing system. The flex seal system is connected to the main conductor with a swell seal gasket and a seal nut. This connection is also under oil and under spring tension of the bushing. The 167
upper connection at the cover relies totally on the cover bolt tightness to adequately carry the current from the flex seal through the cover to the customer terminal connection. If the cover bolts have become loose over time, hotspots will develop, which will compromise the cover gaskets. This situation is best revealed in the field by utilizing thermal scans with infrared apparatus. Hotspots such as this can lead to catastrophic failure if not resolved immediately. GE recognized that the flex seal design could be improved upon, so they introduced the slip seal design in 1976 (see Figure 3-46). The slip seal design totally eliminates the flex seal but still allows the bushing to expand and contract during thermal cycling.
Figure 3-46: Slip Seal Design
What about top terminal overheating issues? Many Type U bushings were designed and manufactured to have the ability to change top terminals in the field. For instance, if a customer damaged the external threading of a top terminal, they could replace the top terminal without removing the bushing from the transformer. Also, draw lead bushings have a removable top terminal to allow disconnection from the transformer winding lead without requiring entry to or removal of oil from the transformer. Type U bushings, if designed to have removable top terminals, require routine maintenance to ensure top terminal tightness. If the top terminal becomes loose, a hotspot may occur. Overheating of the top terminal may deteriorate the bushing’s gasketing system, which could compromise the integrity of the insulating system and possibly result in failure. Slip seal bushings, 161 kV and above, rated 1,600 amperes and above, are perfect candidates for top terminal overheating if adequate maintenance is not performed.
168
How do you know if your Type U bushings have herringbone ink condensers or foil condensers, flex seal systems, slip seal designs, or removable top terminals? Contact ABB! ABB Alamo has the documentation for all GE bushings. We have all of the original design, test, and manufacturing data for Type U bushings. If you have the catalog number and the group number from the nameplate of your bushings, ABB can help identify the type of bushing design to evaluate your critical needs, such as bushing maintenance, repair, refurbishment, or replacement. Can a Type U bushing be refurbished? Depending on the age, voltage class, current rating, design, and the condition of the existing bushing, Type U bushings may be refurbished. Certain Type U bushings are excellent candidates for refurbishment. If the bushing external parts are in good condition and the concern centers on the herringbone ink condenser or flex seal system, it is very economical to refurbish Type U bushings rated 115 kV and above or bushings below 69 kV that have a high current rating (such as 4,000 amps and above). The key to refurbishing Type U bushings is access to the original design documents and having trained, experienced people. All bushings refurbished by ABB will be updated with the latest ABB design enhancements and will carry a new nameplate and warranty. Were Type U bushings manufactured and supplied to the field with oil contaminated with PCB? Yes! We cannot determine the content of PCB in a bushing by the serial number, catalog number or the group number off of the nameplate. The only way to determine the PCB level is to have the oil tested. We can give some guidelines. Bushings manufactured by GE Pittsfield from 1954 to 1973 can have PCB levels that range from 50 to 500 ppm. From 1973 to 1980 we have test reports reporting levels from 2 to 50 ppm PCB. From 1981 to 1986 the levels are normally non-detectable or less than 1 ppm PCB. What criteria should be used to evaluate bushings on your system? If you have bushings with herringbone-lined ink paper condensers, recommendations, “Criteria for Concern,” for Type U bushings in 1979 were:
GE’s
If the capacitance has increased by 10 % or more from nameplate, remove the bushing from service. If the P.F. is below 1.5 %, there is no cause for concern. If the P.F. exceeds 1.5 %, but is less than 3 %, the bushing is in the region for concern. If the capacitance change is below 5 % of nameplate value, there is little risk of failure. If the P.F. exceeds 3 %, remove the bushing from service.
169
In 1985, Doble Company published recommended limits for Type U bushings. A power factor of 1.0 % is questionable, rather than 1.5 %. Today, ABB has approximately a 65 % market share of new bushings sold into the US and is the leading supplier of replacement bushings for Type U bushings to the Utility and Industrials in the United States. ABB has the following recommendations: If the bushing power factor doubles original nameplate value, the bushing is questionable and should be replaced or refurbished. If the capacitance increases to 110 % of the original installation value, the bushing is questionable and should be replaced or refurbished. How can ABB make these recommendations, and on what basis can these statements be made? Being the sounding board for 170 major utilities and many industrials across the US, we have seen the electrical industry increase awareness of Type U bushings due to high power factors and failures of Type U bushings. At the same time, we have noticed maintenance periods have been extended beyond recommended levels. In today’s competitive marketplace, companies have downsized maintenance programs and extended periodic maintenance from 1 year intervals up to 3 years and as high as 5 years or more. Through field surveys and field experience, we have noted that if a Type U bushing is exhibiting a rise in power factor, the rise accelerates very quickly once the action has started. Therefore, many utilities know that if they are on a 3- or 4-year maintenance interval and a bushing exhibits a rising power factor, the bushing will not perform for the next 3- or 4-year period without failure. The normal practice is to remove the bushings from the transformer immediately. Once the corona (partial discharge) activity has started, the remaining service life of the bushing can be very short, and it could fail catastrophically. 3.2.11.2.5.2
Recommendation
If possible, measure power factor and capacitance on a yearly basis. If power factor is on the rise, replace or refurbish bushings. If you have flex seal design bushings, thermal scan the units for hotspots, check for low or high oil levels, and complete power factor and capacitance testing on a yearly basis. If bushings exhibit any of the above-mentioned scenarios, the bushing should be replaced or refurbished.
170
If you have bushings with removable top terminals, proper maintenance must be applied on a yearly basis either by thermal scan or manual inspection methods. For manual inspection of top terminals, check to see if the terminal can be loosened first. If the terminal cannot he removed, the terminal may have seen overheating and/or corrosion build-up and should be removed from service. If the terminal can be removed, inspect the top terminal gasket and look to see if there are signs of corrosion. If the terminal gasket appears to be brittle or have a permanent set, replace the gasket. When replacing the gasket, be sure to lubricate the gasket with petroleum jelly to prevent twisting of the gasket as the terminal is tightened. Tighten the top terminal to the correct torque values with the proper tools or fixtures. Top Terminal Size Inch – Threads 1.125-12 1.500-12
Torque ft lbs (N m) 35 (48) 100 (136)
If bushing top terminals show signs of corrosion or the top terminal cannot be removed, we recommend replacement or refurbishment of the bushing. Top terminal overheating can compromise the bushing gasketing system or create loss of life of the bushing insulating system. This could result in a catastrophic failure if the proper action is not taken. Bottom connected bushings 161 kV and above rated 1,600 amp and above can be refurbished to the new ABB Unified top terminal design per Figure 3-47. The ABB Unified top terminal design eliminates top terminal maintenance and overheating, corrosion, or deteriorating gasketing systems.
Figure 3-47: Unified Top Terminal
171
Who can rebuild or refurbish Type U bushings to be like new? Some major utilities have tried to rebuild their own bushings, a few small business service shops have tried, and other bushing manufacturers have also tried to rebuild Type U bushings. Most rebuilds by people other than ABB rely on guesswork or reverse engineering to determine the makeup and design of the original bushing. GE went through many design changes through the years. GE designed and manufactured over 5,000 different catalog or styles of bushings, and within each catalog or style there are an average of 7 design and manufacturing changes. That means there are over 35,000 different Type U bushing designs in the field today. The key to rebuilding Type U bushings is to have all the documentation, such as the drawings, design changes, manufacturing processes, and test data. ABB has this design and original manufacturing information as well as design engineers and technicians experienced with GE technology. Table 3-37 shows typical design information for Type U bushings. ABB will not rebuild bushings without the original design information. If applicable or economical for the customer, ABB rebuilds Type U bushings to the latest technology. Table 3-37: Typical Type U Bushing Design Information Bushing kV 15-69
115-138
Current Rating
Herringbone Ink Condenser
400 400/1,200 2,0003500 4,000 800 800/1,200 1,800 800
yes yes yes
Foil Condenser Design
Removable Top Terminal yes yes
Flex Seal Design
Slip Seal Design
Economical to Refurbish
yes yes
yes See See Note 2 Note 3 800/1,200 yes See See yes Note 2 Note 3 1,600 yes yes See See yes Note 2 Note 3 See 345 800 See Note1 See Note 1 yes See Note 2 Note 3 800/1,200 See Note 1 See Note 1 yes See See yes Note 2 Note 3 1,600 See Note 1 See Note 1 yes See See yes Note 2 Note 3 550 800 yes yes See See yes Note 2 Note 3 800/1,200 yes yes See See yes Note 2 Note 3 1,600 yes yes See See yes Note 2 Note 3 800 800 yes yes See See yes Note 2 Note 3 800/1,200 yes yes See See yes Note 2 Note 3 1,600 yes yes See See yes Note 2 Note 3 Note 1: To verify herringbone ink or foil design condensers, the bushing catalog # and group # from the nameplate must be supplied. Note 2: To verify if bushing utilizes flex seal design, the bushing catalog # arid group # from the bushing nameplate must be supplied. Note 3: To verify If bushing utilizes slip seal design, the bushing catalog # and group # from the bushing nameplate must be supplied. 161-230
172
yes yes
yes yes yes
Are there other reasons why a customer should refurbish bushings? Depending on state and government regulations, the economical benefit in refurbishment can vary. If a customer buys new product, what happens to the old product? Most likely, the customer must scrap or dispose of porcelain materials, metals materials, and bushing oil on top of dealing with the PCB issues. Sometimes the disposal fees are very expensive. Do you know the regulations and laws of disposal in your state? They are changing daily. Be careful. There are organizations that provide services to decontaminate PCB laden bushings. The decontaminated parts can be used to rebuild a bushing that carries the full warranties of a new bushing. Refurbishing bushings could be an economic and viable solution to your problems. 3.2.11.2.6
Type “T” Bushings
Is the Type “T” bushing a predecessor to the Type “U” bushing manufactured by General Electric? Type “T” bushings were designed and manufactured by General Electric for low-voltage, high-current, low-corona, transformer applications. GE supplied low-voltage, highcurrent, stud type or bulk type bushings (Type “A” bushings) for many years, and then the market demanded a bushing with low corona values. GE’s answer to the market demand was the ultimate low-corona condenser bushing technology, the Type “T.” GE manufactured Type “T” bushings from 1971 to 1985. Type “T” bushings range from 25 kV to 34.5 kV and current ratings 600 ampere draw lead to 18,000 ampere bottom connected. These bushings were designed for low-voltage applications; therefore, GE designed bushings for horizontal and vertical applications. To achieve maximum low corona values, not obtainable by bulk type bushings, GE incorporated a condenser into the design. Why is there a concern with Type “T” bushings? Type “T” bushings are basically designed and manufactured in the same manner as Type “U” bushings. Outside shell and mechanical parts are very similar. What about the condenser core process? The condenser design and process is the same as the Type “U” using herringbone ink lined printed paper. Should you be concerned about all Type “T” bushings? No. Some Type “T” bushings are designed for high-temperature (125 °C) applications. Units designed for high-temperature applications used Nomex winding paper with foil inserts for gradients. The ink process could not be applied to the Nomex winding paper.
173
Is the concern for Type “T” bushings as valid as the concern for Type “U” bushings even though they are a low-voltage bushing? Yes! Even more so. The normal application of these bushings is on the low-voltage side of a transformer with higher current ratings, higher temperatures, and sometimes they are applied in bus ducts. When these bushings are subjected to thermal cycling, gas bubbles trapped in high-stress areas of the lined ink printed paper condenser can create partial discharge leading to a high power factor or failure of the bushing. How do you know if you have herringbone ink lined paper or foil gradients in your Type “T” bushings? Contact ABB. If you know the General Electric catalog number and the group number from the nameplate of the bushing, ABB can research the General Electric drawings in our archives and verify the type of design. If you wish to discuss applications, such as high temperature, ABB can also verify if the units are suitable for 105 °C or 125 °C applications. Many transformer manufacturers, utilities, and contractors tend to misapply bushings in high-temperature applications assuming that higher current rated bushings can be applied at higher temperature ratings. Overload conditions described in IEEE Standard C57.19.100 section 4 are normally abused more with Type “T” and bulk-type bushings than other types of bushings. The updated ABB “Criteria for Concern” (power factor and capacitance values) and recommended maintenance applies to Type “T” bushings as well as Type “U” bushings. Can you buy new bushings to replace Type “T” bushings or can Type “T” bushings be refurbished? Yes & yes! ABB offers direct replacement bushings for Type “T” bushings. ABB manufactures Type “T” bushings today with the same dimensional and electrical characteristics as the General Electric bushings for ease of installation, proper fit, and application, but ABB has incorporated into today’s Type “T” the advanced technology and superior condenser design of the ABB Type O Plus C bushing. Although Type “T” bushings are low voltage, they are typically high current, and the economics of refurbishment is well worth the effort. Normally, a refurbished bushing is approximately 65 % of the cost of a new bushing. Please be aware that GE went through many gasketing system design changes in the early stages of the Type “T” design. ABB utilizes the original GE design data and drawings to update bushings to the best design and latest technology when refurbishing bushings to “as new” condition. 3.2.11.3
DIAGNOSTICS AND CONDITIONING ON ABB BUSHINGS COMPLYING WITH THE IEC STANDARD
In general, bushings delivered from ABB shall be considered maintenance free. However, inspection and field service experience will in some cases lead to the need for diagnostics on bushings. In the following section, a review of different methods and interpretations is given. 174
WARNING Make sure that the transformer is de-energized and out of service before any work is performed on the bushing. 3.2.11.3.1
Capacitance and tan measurement
Prior to taking a condenser bushing into service, and on suspected faults, the capacitance and dissipation factor should be measured and compared with the values given on the rating plate or in the routine test report. In connection with these tests, the electrical connection between transformer tank and bushing flange shall also be checked, for instance with a buzzer. 3.2.11.3.2
Temperature correction
The measured dissipation factor value shall be temperature corrected according to the correction factors given in Table 3-38. GOx stands for all oil-impregnated paper condenser bushings (OIP) and GSx stands for resin-impregnated paper condenser bushings (RIP). For all bushings it shall be assumed that the bushing has the same temperature as the top oil of the transformer. The test should be performed at a temperature as high as possible. Correction shall be made to 20°C. The corrected dissipation factor (tan ) shall be compared with the value on the rating plate or in the test report. Table 3-38 : Correction factors for tan Range (°C) 0-2 3-7 8-12 13-17 18-22 23-27 28-32 33-37 38-42 43-47 48-52 53-57 58-62 63-67 68-72 73-77 78-82 83-87
Correction to 20°C OIP 0.80 0.85 0.90 0.95 1.00 1.05 1.10 1.15 1.20 1.25 1.30 1.34 1.35 1.35 1.30 1.25 1.20 1.10
Correction to 20 °C RIP 0.76 0.81 0.87 0.93 1.00 1.07 1.14 1.21 1.27 1.33 1.37 1.41 1.43 1.43 1.42 1.39 1.35 1.29
Interpretation of the measurement, OIP and RIP bushings
0-25% increase: The value is recorded and no further measures are taken. 25-40% increase: The measuring circuit is checked regarding leakage and external interferences. External interference can come from nearby current carrying equipment and bus bars. If the difference remains, the problem may be due to moisture. The 175
gaskets of the oil level plugs need to be replaced according to the product information for the bushing. The measured value is recorded, and the bushing can be put back into service. 40-75% increase: Perform the measures discussed for 25-40% increase and repeat the measurement within one month. More than 75% increase: The bushing shall be taken out of service. However, if the dissipation factor is less than 0.4%, the bushing may be restored to service even if the increase in percentage from the initial value is greater than 75%. Capacitance: The measured capacitance, C1 shall be compared with the value given on the rating plate of the bushing or with the 10 kV routine test report. If the measurement is more than 3% from the nameplate value, there could be a partial puncture of the insulation. An extremely low value C1 value (disruption) may be due to transport damage and the bushing must not be returned to service. In either case, please contact ABB. The C2 capacitance is influenced by the way the bushing is mounted onto the transformer and should not be used for diagnostics. Comments on dissipation factor of OIP bushings: The dissipation factor is a critical property in oil filled condenser bushings and is mainly determined by the moisture level in the paper and the amount of contamination in the insulation system. The power factor is also very much dependent on the temperature; the principal behavior is shown in Figure 3-48 for different temperatures and moisture levels.
Figure 3-48: Tan
as a function of temperature and moisture level in OIP bushings.
It is clearly visible that the measurements at elevated temperature are more sensitive. At 20 °C, moisture levels between 0.1% and 1% show approximately the same 176
dissipation factor. At elevated temperature (90°C) they differ by a factor of 5 or more. For proper diagnostics, the important property is the dissipation factor at elevated temperature and not the dissipation factor at 20 °C. Comments on dissipation factor RIP bushings: Before a RIP bushing is put in service on a transformer, it is possible for its tan value to deviate from the nameplate value. This deviation is most probably due to moisture penetration into the surface layer of the RIP. For example, this can happen if the bushing is stored without its protective sealed bag. This allows air with high humidity to penetrate the outer surface layer of the bushing. Normally, the tan value will decrease to its initial nameplate value if the bushing is stored indoors, in a controlled humidity environment for a week. If the transformer is energized with the bushing in service, the tan value will decrease to its nameplate value within a couple of hours. Comments on power factor measurements between the test tap and the mounting flange on OIP or RIP bushings: There are several reasons to not use this value as a diagnostic tool. Primarily this dissipation factor is specified to be less than 5% according to IEC 60137. This means that unless specified, no attention is paid to decreasing this dissipation factor value in the same manner as for the dissipation factor over the main insulation. The test tap is connected to the outermost earthed layer on the condenser body. The solid layer outside the earthed layer contains an adhesive together with cellulose to make the condenser body more stable. The dissipation factor of the combination of cellulose and adhesive is much harder to control than that of only cellulose insulation. It is for this reason that the dissipation factor of this insulation section is not used for diagnostic purposes. Moreover, the adhesive material affects the dissipation factor differently for different bushings. It should be pointed out that under operational conditions, the outer layer of the bushing insulation is earthed. Consequently, the insulation between the outer layer and the mounting flange is not subjected to an electrical stress and therefore do not cause any dielectric heat losses. It is likely that if the bushing is placed in contaminated areas, contaminants on the outside of the test tap affect the results. Moisture around the test tap also affects the measurement. It should be pointed out that if the test voltage (500V if the test-tap insulation is delivery tested with 2kV and 2.5 to 5 kV if the test tap is delivery tested with 20kV) is exceeded, partial discharges may occur in the region of the test tap. This will affect the measurement. Taking all the variations mentioned above into account, the dissipation factor of the test tap insulation can vary between 0.4-3.0 %. 177
3.2.12 3.2.12.1
MEASUREMENTS FOR ASSESSING THE CONDITION OF OLTCS/LTCS26
NUMBER OF O PERATIONS
It is common to measure the number of operations of the LTC. From the number of operations, it is possible to estimate the level of deterioration of the device based on experience. This measure is typically a function of the LTC manufacturer and type. 3.2.12.2
RESISTANCE OF THE ELECTRICAL CONNECTIONS
It is known that the initial contact resistance has a very strong influence on the estimated useful life of the contact. If the connection resistance of the contacts is known, it is possible to calculate an estimate of the remaining life of the contacts. This is done with help of a mathematical ageing model that depends on such quantities as the current load, the connection design, ambient temperature, and others. The contact resistance can be measured with a micro-ohmmeter and the transformer in a deenergized state. 3.2.12.3
T EMPERATURE
This measurement is based on the fact that under normal operating conditions, the main tank of a transformer, because of the I 2R and eddy current heating, will have a higher temperature than the LTCcompartment where there is essentially no heat generation under non-switching conditions. Under steady state conditions, the temperature difference between the two tanks will follow a known pattern. As the LTC switch contacts age and wear, their resistance increases and hotspots develop under normal loading conditions. The hotspots will increase the overall temperature of the LTC tank, and the difference between it and the main tank temperature will begin to deviate from the known pattern. The onset of severe contact wear can therefore be estimated by using the temperature difference between the main tank and the LTC. Most of the systems available on the market use magnetic clamp temperature sensors and computer software to measure and track the temperature difference. 3.2.12.4
MOTOR CURRENT
Under normal operating conditions, the motor that drives the LTC gears and switching contacts have a distinctive signature. Any significant deviations from this signature may signal problems (gear or contact wear, binding, etc.) in the LTC mechanism. For LTCs in which the switching mechanism is controlled by a spring, deviations of the motor current from the normal signature can be used to diagnose looseness in the tensioning of the spring. 3.2.12.5
ACOUSTIC SIGNAL
During the switching of the LTC, an acoustic signal is generated [84]. This signal can be measured using a piezoelectric sensor. If there is a change in the gears or the switching contacts, the acoustic signature will be different from the normal case. To perform this diagnosis, the measured acoustic signals are compared with a certain number of past signals using a sophisticated software program. Such a system can 26
See section 1.7.1 for comments on OLTC (IEC designation) or LTC (IEEE designation)
178
be applied online and can generate warning or alarm signals if certain values are exceeded. 3.2.12.6
RELAY T IMING
The switching of the LTC is controlled by relays. The switching conditions of the relays can be used to assess the switching process. This information may be recorded and stored in a data Historian database. Any deviation of the relay timing from normal signatures is an indication of possible faulty conditions in the LTC. 3.2.12.7
GAS-IN-OIL ANALYSIS
When an LTC operates, arcing occurs and the expected fault gases, acetylene and hydrogen, are produced. The presence of certain levels of these gases in LTC oil is therefore normal. However, as the contact wears or coking develops on the contacts, the duration of arcs is increased during LTC operation. The generation of acetylene and hydrogen increase accordingly. The rate of generation of these gases can therefore be used as a means of determining the condition of the LTC contacts. Coking and misalignment of contacts are the most common problems that occur in LTCs. The coking process leads to exponentially increased heating or “thermal runaway” and carbon buildup. It is now well established that the coking problem results in the production of the ''hot metal gases'' (methane, ethane, and especially ethylene) [85]. The concentration of these gases depends on a number of variables including the number of tap changer operations, breathing type, manufacturer, model type, etc. For example, free-breathing LTCs rapidly lose gases to the environment, while sealed LTCs retain much of the gases produced. 3.2.12.7.1 3.2.12.7.1.1
Items Specific to the European Practice Scope
This section deals with the use of Dissolved Gas Analysis as condition indicator in conventional On-Load Tap-Changers (OLTCs) that use mineral oil insulation. By conventional OLTCs, we refer to OLTCs in which arc quenching takes place in the mineral oil. The information in this section is therefore not valid for electronic OLTCs; OLTCs with vacuum interrupters and OLTCs that use insulating liquids other than mineral oil. It is mainly valid for OLTCs that have dehydrating breathers as interface against to the atmosphere. 3.2.12.7.1.2
History
Historically, DGA of oil in OLTCs have been considered worthless because of the large amount of gases normally generated by the arcs. This opinion has however, been reconsidered in recent years and the understanding today is that quite a lot of information can be gained from DGA of oils in OLTCs. 3.2.12.7.1.3
Faults in OLTCs possible to indicate by DGA
There are three basic faults in OLTCs that can be detected by DGA: Discharges and arcings Thermal faults Ageing of cellulose insulation 179
Discharges and unwanted arcs cannot be detected because these are produced during normal operation of the OLTCs. Ageing of cellulose is of no importance in OLTCs manufactured by ABB since cellulose insulation is not used in the designs. Thermal faults are possible to detect. During normal switching, the arcs generate acetylene and hydrogen. In addition, the three gases indicating thermal faults, methane, ethane and ethane are also generated. The temperature in the center of the arc is several thousands centigrade and the molecules are totally degraded. Upon recombination, the resulting gases are mainly hydrogen and acetylene. However, there is a temperature gradient from the plasma channel in the center of the arc to the surrounding oil. This gradient is high enough to produce all the thermal fault gases but in certain ratios to the hydrogen and acetylene produced. This relation between the gases is fairly constant as long as the gases are generated by the arcs alone. If there is another source of thermal fault gases, such as an overheated contact, the relation will change and a fault can be detected in an early stage before any severe failures occur. 3.2.12.7.1.4
The Stenestam ratio
This ratio, named after its inventor, is the following: (CH4+ C2H4+ C2H6)/C2H2 This is the relation between the thermal fault gases and the arc gas acetylene. Hydrogen is not used since it is not reliable; it is highly volatility and has a low solubility in the oil. 3.2.12.7.1.5
Important principals for interpretation of DGAs in OLTC
There are some important things to bear in mind before an interpretation is made Never try to interpret DGAs where the gas amounts are very low. For a useful ratio, the amount of acetylene should be at least 500 ppm. A single sample does not give reliable information. The most reliable information is gained when samples are taken within certain intervals to produce a trend. In cases where the ratio is in the gray zone (between normal and faulty), it is always recommended to take new samples with a certain intervals in order to produce a trend. Sampling and storage of samples are important for getting a correct result. 3.2.12.7.1.6
Interpreting the Stenestam ratio
These are the limits used to interpret the Stenestam ratio: < 0.5 – No overheating present 0.5 to 5 – Take new samples. The higher the value, the shorter the interval 5 - An overheating has occurred. The unit should be taken out of service and be repaired as soon as possible. Contact the manufacturer for advice! In the range 0.5 to 5, the recommended intervals for new samples are as follows: 0.5 to 1 - 3 to 6 months 1 to 3 - 1 to 3 months 3 to 5 - within one month. 180
3.2.12.7.1.7
Typical gas concentrations
The gas concentrations themselves do not give any useful information since the concentrations are dependent on a large number of factors including load, number of operations, piping, breathing system, temperature variations, oil volume, type of connection and type of OLTC. However, to give an idea of what the levels are in some typical cases, the following examples can be given in Table 3-39 (all values in ppm v/v): Table 3-39: Typical Gas Concentrations in OLTCs
Gas
Low current/few operations
“Normal operation”
Industrial service
Hydrogen
1000-5000
1000-15000
<35000
Acetylene
500-5000
2000-30000
30000-150000
Methane
>300
300-2000
<20000
Ethane
<100
<500
<30000
Ethylene
50-300
300-5000
<70000
Propene
<100
100-1000
<15000 1)
Propane
<10
10-200
Carbon monoxide
<700
<700
<700
Carbon dioxide
500-3500
500-3500
1000-3500
Oxygen
15000-35000
10000-35000
1000-35000
Nitrogen
40000-70000
40000-70000
40000-70000
1) The sum of propene and propane As can be seen, the levels can vary very much. In case there are questions concerning the gas concentrations, you are advised to consult the manufacturer. Typically, in order for the manufacturer to provide proper advice about a unit, it is important for the user to supply the following information: OLTC type designation (from the rating plate on the motor drive mechanism) Serial No. of the OLTC (from the rating plate on the motor drive mechanism) No. of operations since last oil replacement Rated load and average load since last oil replacement Type of breather on the conservator Daily load variations Daily oil temperature variations Faults, if any, that have occurred since last oil replacement
181
3.2.12.7.2
Important to bear in mind
The interpretation of DGA in OLTC oils is an evolving field of knowledge. The information in this document is the best of our knowledge today. In the future, it is expected that new information will complete and perhaps revise the content in this document. 3.2.12.7.3
North-American Practice
When an LTC operates, arcing occurs and the expected fault gases, acetylene and hydrogen, are produced. The presence of certain levels of these gases in LTC oil is therefore normal. However, as the contact wears or coking develops on the contacts, the duration of arcs is increased during LTC operation. The generation of acetylene and hydrogen increase accordingly. The rate of generation of these gases can therefore be used as a means of determining the condition of the LTC contacts. Coking and misalignment of contacts are the most common problems that occur in LTCs. The coking process leads to exponentially increased heating or “thermal runaway” and carbon buildup. It is now well established that the coking problem results in the production of the ''hot metal gases'' (methane, ethane, and especially ethylene) [86]. The concentration of these gases depends on a number of variables including the number of tap changer operations, breathing type, manufacturer, model type, etc. For example, free-breathing LTCs rapidly lose gases to the environment, while sealed LTCs retain much of the gases produced. Several users have established threshold gas concentration values for various models and configurations of LTCs. It is advisable that users develop their own set of threshold values. However, in the absence of such data, there are generic threshold values that can be used. Table 3-40 is a summary of normal gas levels from an IEC study of several normal and failed units. Note, however, that this study gave no difference to the breathing configuration or type of interrupting mechanism. Table 3-40: Normal Gas Formation as a Function of Operational Count [87] Number of Operations 500 3,600 49,000
Hydrogen 6,870 12,125 14,320
Gas Concentration (ppm) Methane Acetylene Ethylene 1,028 5,500 900 5,386 35,420 6,400 10,740 53,670 35,839
Ethane 79 400 3,944
A similar table developed by Weidmann-ACTI laboratories provides normal gas concentration levels for various LTC configurations (see Table 3-41).
182
Table 3-41: 90% Values of Gas Concentration for Different Breathing Configurations [88] LTC Configuration Free Breather Free Breather w/Desiccant Sealed Vacuum
Hydrogen 1,418
Gas Concentration (ppm) Methane Acetylene Ethylene 379 2,733 851
Ethane 107
467
141
2,811
473
130
1,781 72
572 61
3,744 42
1,337 49
178 79
Once any of the gases in a unit rises above the “normal” threshold limits, there are several gas ratios that can be used to diagnose the specific problem. Analysis performed by Jakob et al. [88] suggests that regardless of operational count, the ratios of arcing gases to heating gases would remain the same in a problem-free LTC. As the contact surface changes and becomes more resistive, there is a correspondingly greater increase in the generation of heat gases than arcing gases. There is reason for great concern if the concentration of heat gases is more than that of arcing gases in an LTC. The two most useful ratios for diagnosing overheating problems in LTCs are the Ethylene/Acetylene and the Ethylene/Ethane ratios. The calculated ratios for LTCs under “normal” operation based on the data in Table 3-41 are given in Table 3-42. . Table 3-42: Diagnostic Gas Ratios for LTCs LTC Configuration Free Breather Free Breather w/Desiccant Sealed Vacuum 3.2.12.8
Ethylene/Acetylene Ratio 0.31
Ethylene/Ethane Ratio 7.95
0.17
3.64
0.36 1.17
7.51 0.62
MOISTURE
The insulation capability of the oil decreases with the water content. The water content can be measured by a moisture sensor in an online monitoring system. Also, the moisture content and oil breakdown values can be measured at the same time as the gas-in-oil analysis.
183
3.3
ADVANCED DIAGNOSTIC TOOLS
3.3.1 ASSESSMENT OF MECHANICAL PROPERTIES - FREQUENCY RESPONSE ANALYSIS (FRA) This chapter is based on material from references [89], [90], [91], as well as own experience within ABB. 3.3.1.1 3.3.1.1.1
INTRODUCTION Purpose of FRA measurements
Frequency response analysis (FRA) is an advanced, non-destructive diagnostic method used to detect mechanical movements or damages in the active parts of a transformer (windings and core), by comparison with reference data from the same unit or from other, similar units. The goal of FRA is usually to test if physical displacements in the active part of the transformer have occurred with age or after a particular event (e.g. refurbishment, repair, accident, transportation, through fault, quality check, etc.). FRA measurements provide indications of damage to the transformer, which can be investigated further using other techniques or by an internal inspection. A wide range of fault types is expected to induce characteristic changes in the FRA signature, for example: axial winding collapse clamping failure winding buckling turn short circuit broken core grounding circulating currents in core broken delta connection bad short circuiting contacts 3.3.1.1.2
When should FRA measurements be performed?
It is most appropriate to perform FRA test after some incident or condition that has the potential of causing mechanical movement or electrical damage to the transformer assembly. There are a number of good reasons for performing FRA measurements, depending on the circumstances: For prevention Baseline (or “fingerprint”) measurement for future reference, for new transformers usually on the test floor directly after manufacturing As part of a routine diagnostic protocol, to check for changes during service time After installation or relocation, to check for transformer integrity
184
For detection of damages After unusual disturbance during shipment, to check for damages in the active part After failures in operation compromising the transformer condition (e.g. throughfault event, close lightning strike) As a failure diagnostic tool during short circuit testing of a transformer. For sister reference To obtain “good” reference data to compare with a sister unit in trouble 3.3.1.2
STANDARDS
FRA measurement procedures have recently been under study by IEEE and CIGRE committees. The conclusions of Cigré Working Group A2.26 on FRA have been published in spring 2008 [91], The IEEE guide is under preparation and a standard draft of the IEEE WG PC57.149 on FRA [92] will probably be published in the near future. Since 2005, China has an official FRA standard [93] (to our knowledge, as the first and so far only country in the world). An IEC standard is in preparation [94] and will be published in the near future (IEC 60076-18 Ed1). 3.3.1.3 3.3.1.3.1
GENERAL DESCRIPTION OF THE FRA METHOD Principle of the measurement
FRA consists of measuring the electric response (expressed by transfer functions in the frequency domain) of transformer windings over a wide range of frequencies and comparing the results of these measurements with a reference set. A transfer function is obtained as the ratio between the injected signal in a selected access of the transformer and the signal received from another access of the transformer (see Section 3.3.1.5.5 for more information about the tested accesses in transformers). Usually the signal is injected between a transformer bushing and ground, and the response is measured at another bushing to ground (see Figure 3-49). There are basically two distinct ways of injecting the wide range of frequencies required: either via an impulse into the winding (impulse response method) or via a frequency sweep using a sinusoidal signal (frequency response method). The impulse response method has evolved from an earlier test method known as low voltage impulse measurement, or LVI. Due to conversion of the time response into the frequency domain using the technique of Fast Fourier Transform (FFT) it is in principle equivalent to the sweep frequency method. Both methods are currently used within the industry [95]. The impulse response method offers the advantage of a somewhat shorter measurement time than the frequency response method. The frequency response method on the other hand offers the following advantages over the impulse response method: Better signal to noise ratio Equal, or near equal, accuracy across the whole measurement range Wide range of injected frequencies
185
Iin
Iout
Zs Us
Uin
Zp,in
Device Under Test (Transformer)
Zp,out
Uout
Figure 3-49: Principle of FRA measurements
Terminology in Figure 3-49: Us input signal injected to the reference point Zs internal impedance of the signal generator Zp,in internal impedance of the measurement probe at the reference point Uin measured voltage at the reference point, called input or reference voltage Iin current injected to the transformer at the reference point Zp,out internal impedance of the receiver probe at the measurement point, often called FRA measurement impedance (50 for most systems) Uout measured voltage at the measurement point, called output or response voltage Iout current at the measurement point FRA measurements are usually performed in a frequency range from 10-20 Hz up to 1 or 2 MHz. For large power transformers, the interesting frequency range from the point of view of winding integrity is typically from about 10 kHz to 500 kHz. 3.3.1.3.2
Practical set-up
A typical measurement set-up is shown in Figure 3-50. A voltage signal is injected via a signal coax cable at some transformer terminal, and measured at the same injection point with a separate measurement coaxial cable. The transferred signal at some other terminal (usually the other end of the same winding) is measured with a third coaxial cable. It is advisable to choose the coaxial cables all of the same length, in order to compensate for phase lag and damping. All cable shields are connected to ground in the shortest possible way, at both the transformer terminals and the measurement device.
186
Reference Signal Cable
Source Signal Cable
Uin Source signal (swept frequency or impulse)
Phase Bushing
Neutral Bushing
Source and Reference Cable Shield Grounds
Response Signal Cable
Uout
Response Cable Shield Ground
Transformer under test
FRA Device
Figure 3-50: Typical practical connection between FRA device and transformer
The input impedance of the measurement device is usually chosen to equal the wave impedance of the cables (e.g. 50 ), in order to minimize signal distortion due to reflections at the cable ends. 3.3.1.4
COMMERCIAL EQUIPMENT
In recent years, a number of dedicated FRA measurement devices have been developed and introduced into the market. Although FRA measurements can be performed with a general-purpose network analyzer, specialized modern equipment makes the measurements easier and faster. From the extended list of FRA measurement devices available today in the market, in ABB Service groups three of them are the most recognized (Figure 3-51): FRAX from Megger, FRAnalyzer from Omicron and M5300 from Doble. 3.3.1.5
DETAILED MEASUREMENT PROCEDURE
IMPORTANT: All tests should be performed by qualified test personnel who are familiar with the test equipment. They should be capable of basic interpretation of the test results, allowing them to distinguish between valid and invalid results (see Section 3.3.1.7 below), or at least have access to support for this purpose. The following test procedures should be followed when performing the FRA test.
187
3.3.1.5.1
Test preparation
Firstly, the test should be done in a safe and controlled manner irrespective of test location (Local Safety Recommendations). During field measurements, all accesses at the high and low voltage sides of the transformer should be grounded. The transformer under test should be disconnected from any power systems or supplies. Auxiliary accessories should be turned-off or not move during the test (e.g. tap changers, pumps, fans, etc.). The transformer tank will be used as the test reference ground, so insure you have a good electrical connection to the tank. The transformer should be preferably assembled, with bushings mounted, and oil-filled. Core-ground bushings should be connected to the reference ground (= the transformer tank). They normally do not form a part of the test process. Any deviation from the above (like un-mounted bushings, no oil, core ungrounded, etc.) will most likely affect the test results and must be clearly recorded in the test protocol. It is strongly recommended to take pictures: o of the transformer (overall), o of its nameplate, o of typical measurement connection used, o of short circuit connections Product
Picture
FRAX-101 produced by Megger
FRAnalyzer produced by Omicron
M5300 produced by Doble
Figure 3-51: Some commercially available FRA instrumentation used within ABB 3.3.1.5.2
Tap changer position
Transformers with On-Load Tap Changer (OLTC) are suggested to be measured in the tap combination that places all sections of the windings in the 188
circuit. FRA test at other tap positions are allowed in particular circumstances (e.g. to check for mechanical problems in OLTC). Transformers with De-Energized Tap Changer (DETC) are recommended to be measured in the working position. On field measurements, it is necessary to perform FRA measurements using the same OLTC position as defined in the reference measurements in order to make a comparison possible. When no reference exists, proceed as recommended in the two previous points. 3.3.1.5.3
Treatment of un-tested terminals
For terminals not under test, including neutrals, disconnect all terminals not involved in the measurements and leave them in open circuit. When windings not under test are required to be short circuited, the short-circuit wires should be as short as possible using strong wire/braid. 3.3.1.5.4
Test leads:
Three test leads are recommended: Excitation source, reference (= in) signal and response (= out) signal. They should ideally have the same lengths. Test coaxial cable shields involved in the measurements must be grounded at both ends (at the base of the test bushing flanges and at the BNC connection to the test set). The shielded test leads should terminate close to the bushing terminals or flanges, and the area of the loop formed by signal wire, ground connection of the shield, and bushing should be minimized. The test-set ground should be directly connected to the reference ground (= the tank) or follow manufacturer’s recommendations. 3.3.1.5.5
Test Set-up
The internal connection between windings (determining the “vector group”) of a transformer defines the number and the type of FRA measurements to be performed. We distinguish between four major groups of transformers according to their internal connection: Single phase transformers (normal or auto transformers) Single phase transformers with tertiary (normal or auto transformers) Three phase transformers (normal or auto transformers) Three phase transformers with tertiary (normal or auto transformers) Additionally, in the case of three phase transformers, the connection between windings can be Wye (Y), with or without a neutral, or Delta (D). For special zig-zag or extendeddelta transformers, the list of test needs to be adapted following general principles introduced here under. In general, any FRA test on a transformer belongs to one of the following two kinds: 1. Self-winding tests measure the transfer function between the two ends of the same winding (i.e., the signal is injected at one end of the winding and the response measured at the other end of the same winding). If the transformer is 189
connected in a Y, this is between a winding terminal and the neutral, for all three phases of the high- or low-voltage windings. This kind of test is more common and will be discussed in more detail below. 2. Inter-winding tests measure the transfer function between high-voltage and lowvoltage windings on the same phase of the transformer, for all three phases. This kind of test will not be discussed further here. For transformers designed and installed under the ANSI/IEEE standards, the following self-winding test configurations are most common. The tests can be performed with the un-tested terminals open or short-circuited. Open-circuit tests are performed on a winding with all other connections floating and disconnected. (NOTE: The only exception to this is where a delta winding has one corner completed external to the tank). Short circuit tests are performed on a HV winding by shorting together the LV connections, but without grounding them. The neutral is NOT included in the shorting process. Single Phase – Double Wound
Single Phase
Open Circuit Tests All other terminals floating HV Winding LV Winding Test 1 Test 2 H1-H2 X1-X2
Short Circuit Test Terminals shorted together and floating X1-X2 shorted H1-H2 shorted Test 3 Test 4 H1-H2 X1-X2
Single Phase – Auto Transformer
Single Phase
Open Circuit Tests All other terminals floating HV Winding LV Winding Test 1 Test 2 H1-X1 X1-N
Short Circuit Test X1-N shorted together and floating Test 3 H1-X1
Two-Winding Transformers Open Circuit Tests All other terminals floating HV Windings LV Windings Test 2 Test 3 Test 4 Test 5 H2-H1 H3-H2 X1-X0 X2-X0 H2-H0 H3-H0 X1-X3 X2-X1 H2-H1 H3-H2 X1-X3 X2-X1 H2-H0 H3-H0 X1-X0 X2-X0
Delta-Wye Wye-Delta Delta-Delta Wye-Wye
Test 1 H1-H3 H1-H0 H1-H3 H1-H0
Test 6 X3-X0 X3-X2 X3-X2 X3-X0
Delta-Wye Wye-Delta Delta-Delta Wye-Wye
Short Circuit Tests Terminals shorted and floating (neutral not included in the short) HV Windings LV Windings (X1-X2-X3 shorted) (H1-H2-H3 shorted) Test 7 Test 8 Test 9 Test 10 Test 11 Test 12 H1-H3 H2-H1 H3-H2 X1-X0 X2-X0 X3-X0 H1-H0 H2-H0 H3-H0 X1-X3 X2-X1 X3-X2 H1-H3 H2-H1 H3-H2 X1-X3 X2-X1 X3-X2 H1-H0 H2-H0 H3-H0 X1-X0 X2-X0 X3-X0
A three phase auto transformer may have a single common neutral (H0X0) or three separable neutrals (N1, N2, N3). A tertiary winding may be present; it is tested the same way in either version of neutral bushing arrangement. 190
Three Phase Auto Transformer – Common Neutral – Main Windings Open Circuit Tests All other terminals floating
Wye-Wye
Test 1 H1-X1
HV Windings Test 2 Test 3 H2-X2 H3-X3
Test 4 X1-H0X0
LV Windings Test 5 Test 6 X2-H0X0 X3-H0X0
Short Circuit Tests X1-X2-X3 shorted together and floating (H0X0 not included) HV Windings Test 7 Test 8 Test 9 H1-X1 H2-X2 H3-X3
Three Phase Auto Transformer – Neutrals Separable – Main Windings Open Circuit Tests All other terminals floating
HV Windings
Wye-Wye
Test 1 H1-X1
Test 2 H2-X2
LV Windings Test 3 H3-X3
Test 4 X1-N1
Test 5 X2-N2
Test 6 X3-N3
Short Circuit Tests X1-N1 shorted together X2-N2 shorted together X3-N3 shorted together (shorted terminals remain floating) Test 7 Test 8 Test 9 H1-X1 H2-X2 H3-X3
If the tertiary winding is brought out as three separate bushings (the corners of the tertiary delta), then three separate tests may be performed. If only one corner of the delta is brought out, as is the case for external completion of the delta winding, then only one test may be performed. Additional tests to be performed in the case of an auto-transformer with tertiary winding are described in the table below: Three phase Auto transformer – Tertiary Winding Open Circuit Tests All other terminals floating
Single Corner Full Delta
Test 10 Ya-Yb Y1-Y3
Test 11
Test 12
Y2-Y1
Y3-Y2
Short Circuit Tests Y1-Y2-Y3 shorted together and floating Test 13 Test 14 Test 15 Not applicable X1-N X2-N X3-N
In the case of three winding transformers, the normal two winding transformer is extended to take into account the tertiary winding as a winding coupled with the secondary winding. Three-Winding Transformer – (Wye-Delta-Delta) WyeDeltaDelta
Open Circuit Tests – all other terminals floating LV Windings LV Windings Test 1 Test 3 Test 4 Test 5 Test 6 Test 7 Test 8 Test 9 H1-H0 H3-H0 X1-X3 X2-X1 X3-X2 Y1-Y3 Y2-Y1 Y3-Y2 Short Circuit Tests Y1-Y2-Y3 all shorted together and Y1-Y2-Y3 all shorted together X1-X2-X3 all shorted together floating; all other terminals floating and floating; all other terminals and floating; all other terminals floating floating Test 10 Test 11 Test 12 Test 13 Test 14 Test 15 Test 16 Test 17 Test 18 H1-H0 H2-H0 H3-H0 H1-H0 H2-H0 H3-H0 X1-X3 X2-X1 X3-X2 HV Windings Test 2 H2-H0
191
Three-winding Transformer – (Delta-Wye-Wye) DeltaWyeWye
3.3.1.6
Open Circuit Tests – all other terminals floating HV Windings LV Windings LV Windings Test 1 Test 2 Test 3 Test 4 Test 5 Test 6 Test 7 Test 8 Test 9 H1-H3 H2-H1 H3-H2 X1-X0 X2-X0 X3-X0 Y1-Y0 Y2-Y0 Y3-Y0 Short Circuit Tests Y1-Y2-Y3 all shorted together Y1-Y2-Y3 all shorted together X1-X2-X3 all shorted together and floating; all other terminals and floating; all other and floating; all other floating terminals floating terminals floating Test 10 Test 11 Test 12 Test 13 Test 14 Test 15 Test 16 Test 17 Test 18 H1-H3 H2-H1 H3-H2 H1-H3 H2-H1 H3-H2 X1-X0 X2-X0 X3-X0
REPORTING OF FRA MEASUREMENTS
An attempt to standardize FRA reporting, including a proposal for a specific XML data format, is currently made by an IEC working group [94]. A complete protocol of FRA measurement should contain: 3.3.1.6.1
General information:
Date and time where the measurements are performed, Place where the measurements are performed, Location of the transformer (e.g., inside or outside), Ambient temperature Customer name and person of contact, Reason for test (routine, incident, new, warranty, etc) 3.3.1.6.2
Transformer information:
Complete nameplate information (preferably, a clear photograph of it) Photographs of the test object as measured, showing the positions of the bushings and connections Reference number (factory code, serial number) Rated voltage levels (HV and LV) Rated power Vector/Coupling group Year of manufacture Type of construction (e.g., core form or shell form), number of legs (3- or 5-leg), winding type, etc. Temperature of test object (e.g., top oil temperature), On-Load Tap Changer (OLTC) position De-Energized Tap Changer (DETC) position Active part oil-filled (yes/no) Bushings mounted (yes/no/test bushings) Core demagnetisation performed (yes/no) 3.3.1.6.3
Description of each measurement:
Terminal on which the input voltage was applied Terminal on which the response signal was measured 192
Terminals not under test which were left floating Terminals not under test which were short-circuited and/or grounded Name of the file containing the measured data (magnitude and phase) 3.3.1.6.4
Instrumentation:
Name of the FRA equipment Frequency bandwidth Injected voltage level Number of points per decade Type of internal calculation, if performed (e.g., ratio, impedance, admittance, etc.) Internal impedances of the voltage source, reference probe and response probe (if deviating from the “standard” 50 ) 3.3.1.6.5
Cabling:
Length and connection of coaxial cables Length and connection of not-shielded cables 3.3.1.7
BASIC INTERPRETATION AND ON-SITE QUALITY CHECK
When performing an on-site FRA measurement campaign on a power transformer it is essential to insure good quality and reproducibility of the data before leaving the site. The reason is that it will usually be difficult, costly, or perhaps even impossible to return later and repeat a faulty measurement on the same unit. Below we provide some examples of “normal” measurement results for self-winding tests on different transformer types. For all plots, the frequency scale was chosen logarithmic so that the low frequency features are easily visible. The basic idea is that the measurement engineer should have a clear idea of what kind of behavior to expect, in order to minimize the risk of leaving the site with erroneous measurement data.
193
3.3.1.7.1
Some “normal” FRA spectra
LV short-circuit HV short-circuit
LV open-circuit
HV open-circuit
Figure 3-52: The four different self-winding tests on the middle limb of a two-winding transformer (65/8.5 kV, 5.3 MVA, YNd11). The correlation of resonance peaks/dips in the FRA magnitude with zero crossings in the FRA phase is indicated.
194
U phase W phase
V phase
Figure 3-53: Phase-to-phase comparison (measured phase-to-neutral) for open-circuit measurements on the HV winding (same 3-phase transformer as in Figure ). Black curve: middle limb. Blue and red curves: side limbs. Note the characteristic double-dip structure of the side limbs.
195
LV windings measured phase-to-neutral
HV windings measured phase-to-phase (since the neutral is not accessible)
Figure 3-54: 3-phase transformer Yy, without neutral terminal at HV side (open circuit measurements). Note the peculiar shape of the HV phase-to-phase response at frequencies around 1 kHz which is also common for Delta-connected HV windings.
Figure 3-55: Single-phase transformer, end-to-end open circuit measurements. Black curve: LV winding. Green curve: HV winding.
196
3.3.1.7.2
Meaning of different frequency ranges in an FRA spectrum “global” resonances of the transformer as a whole
short-circuit inductance seen short-circuit from LV side inductance seen from HV side
“local” resonances within a winding
open-circuit inductance seen from LV side
open-circuit inductance seen from HV side
measurement connections start to influence
Figure 3-56: Information contained in different frequency ranges
(A) When only the current FRA measurement data are available: 3.3.1.7.3
Comparison between open- and short-circuit measurements
Typically, open- and short-circuit measurements deviate strongly at low frequencies due to the magnetic core influence, up to somewhere between 10 and 100 kHz depending on the size of the unit (the larger the transformer, the lower is this limit). Above that, open- and short-circuit responses usually are quite similar. This holds for both high- and low-voltage winding measurements. (See for instance Figure 3-52). 3.3.1.7.4
Comparison between high- and low-voltage windings
Open-circuit measurements on high- and low-voltage windings often display very similar features at low frequencies. Sometimes the curves are, in the “negative-dB” range, almost copies of each other which are vertically shifted with respect to each other by a factor corresponding to the turn ratio squared (see e.g.Figure 3-52). 3.3.1.7.5
Comparison between phases
In a three-phase transformer (or in single-phase transformers with accessible intermediate neutral point) the responses of the individual phases are usually very similar to each other because of their identical winding design. However, there are three typical differences between phases which often occur: 197
1. Open-circuit measurements at low frequencies (up to somewhere between 1 and 10 kHz, depending on the size of the unit) display differences due to the magnetic core influence. Typically the responses of the two side phase windings are quite similar to each other (some difference between them may be attributable to remanent magnetization) and have a double minimum of the FRA response, whereas the middle phase is more different and displays a single minimum (Figure 3-53). 2. Both open-and short-circuit measurements display differences at high frequencies (MHz range) due to a phase asymmetry of the leads structure and the tap changer. 3. In the case of transformers which have grounded, delta-connected tertiary windings, it is common to observe a substantial deviation between the LV phases around 20 kHz because of the phase asymmetry introduced by the ground connection. Therefore, if the ground connection of the tertiary is accessible form the outside, it should be removed while leaving the delta connection intact. One important consequence of the above is that at least short-circuit measurements at low frequencies (below some kHz) should always be very similar for the three phases (or between sister units). (B) When further data are available 3.3.1.7.6
Comparison with historical data
If earlier measurements on the same unit are available, it is strongly recommended to compare them with the new ones directly on site (taking into account any actions performed on the transformer between measurements, see section 3.3.1.7.8). Any disagreement may point to measurement problems, which then can be addressed immediately. When comparing new measurements with previously performed ones, be aware (and keep a note of) whether those measurements have been performed with the same instrument and with the same cables. It is also very important to use the same “measurement direction” (phase-to-neutral or neutral-to-phase) as in the previous measurement, since these usually produce slightly different results. 3.3.1.7.7
Comparison with twin or sister units
Same comment as above for historical data: a comparison with available measurements on identical or similar units may help to quickly detect measurement problems. As already mentioned above in 3.3.1.7.5, it may also be useful to decide which level of agreement is to expect in a phase-to-phase comparison. 3.3.1.7.8
History of the unit
When performing FRA measurements on site it is useful to know the reason for performing the measurement. If there are previous events which may have affected the integrity of the unit (like transport incidents, network short-circuit events, etc.) it helps to have in mind some expectation beforehand about how these may affect the FRA signature.
198
3.3.1.7.9
Other diagnostic data
In the same spirit, it is useful to collect other known diagnostic information beforehand and try to form an opinion whether FRA deviations will be expected. Examples are anomalies in turn ratio, short circuit tests, winding capacitance measurements, DGA or DFR deviations, etc. 3.3.1.8 3.3.1.8.1
EXAMPLES OF PROBLEMS DIAGNOSED USING FRA Axial Winding Collapse
Axial winding collapse is likely to have the following characteristics: Produced within a transformer winding due to excessive axial forces during a fault Windings shift relative to each other Gassing may result Transformer integrity is compromised Failure likely to be catastrophic if transformer continues in service
Figure 3-57 shows an example of axial winding collapse in a transformer.
Figure 3-57: Transformer with axial collapse of winding.
Figure 3-58 shows a typical signature of a winding that has experienced axial collapse.
199
Right shift of resonance frequencies in the damaged winding
Figure 3-58: FRA signatures of winding before (blue) and after (red) axial collapse. The damaged phase shows a right shift of resonance frequencies, indicating a decrease of stray capacitances between discs. 3.3.1.8.2
Hoop Buckling
Hoop buckling is produced within a transformer winding due to excessive compressive forces during a fault. It would typically have the following characteristics: The winding loses shape and gains a “bump” when seen on end. It results in a bent–but not broken–winding. Gassing may result. The transformer is likely to be able to continue service. Transformer integrity is compromised. Figure 3-59 shows an example of hoop buckling failure in a transformer winding.
200
Phase 1
Phase 2
Phase 3 Buckled X1 winding
Figure 3-59: Buckling of inner winding (X1) on Phase 1.
Figure 3-60 shows typical FRA signatures of windings that have suffered hoop buckling.
Figure 3-60: FRA Signatures of transformer with buckling of inner winding on Phase 1.
201
3.3.1.8.3
Shorted Turns
Shorted turns in transformers are produced by turn-to-turn faults and may have the following characteristics: Adjacent turns lose paper and braze/weld together. They result in a solid loop around the core. Figure 3-61 shows typical physical evidence of shorted turns in a transformer winding.
Figure 3-61: Shorted winding turns
Figure 3-62 shows traces from the same transformer before and after a fault that resulted in shorted winding turns.
202
–20 Magnitude [dB]
–40
–60
–80
0.1
0
1 10 Frequency [kHz]
100
1000
After the fault incident: Phase A has clear short-circuit behavior (reduction of the inductance). The other two phases have normal open circuit measurement behavior.
Magnitude [dB] –20
–40
–60
–80
0.1
1 10 Frequency [kHz]
100
1000
Figure 3-62: FRA traces for diagnosis of shorted turns.
203
3.3.2 3.3.2.1
ASSESSMENT OF THERMAL PROPERTIES DEGREE OF POLYMERIZATION (DP) [96]
Cellulose materials, such as paper and pressboard, form the major part of power transformer insulation. The chemical structure of the cellulose polymer is shown in Figure 3-63. The molecular formula may be written as (C6H10O5)n, where C6H10O5 is the monomer unit and n is the number of monomers in the polymer chain. n is also known as the degree of polymerization (DP or DPv). The complete fine structure of the cellulose fiber consists of fibrils, micro-fibrils and chains. The polymer chain is the ultimate fine structure of the cellulose fiber. The DP is measured by viscosity measurements according to ASTM method D4243 after dissolving the fibers in cupriethylene diamine solvent. Only the chains remain intact when the fiber is dissolved. The average of several viscosity measurements gives the DP value (the approximate number of chains remaining in the solution). Solutions of the cellulose chains in the solvent increase the viscosity, depending on the size (molecular weight) of the chains.
Figure 3-63: The Cellulose Molecule
Unprocessed virgin Kraft paper has DP in the range of 1,000-1,400; after drying and oil impregnation the DP drops to approximately 900-1,100. As the insulation ages, the DP drops to lower values with time. When it reaches a value of 200, the tensile strength usually drops to about 20% of its original value and is generally considered at the end of life. However, if the transformer does not experience short circuit forces and other types of vibration, it may continue to function until the cellulose becomes carbonized and brittle, at DP values of 100-150. Unprocessed wood fibers may have DPs as high as 1,500. 3.3.2.1.1
DP versus Life Plots
[97] provides an expression for the expected life of cellulose insulation to that follows the equation:
204
Expected Life( yrs )
1 DPEnd
1 DPStart
A 24 365
exp
13350 T 273
Where: DPEnd and DPStart are respectively, the DP value of the paper at the end and start of the life of the insulation; T is the temperature of winding in contact with the insulation in degrees Celsius, and A is a factor that depends on the type of insulation and the conditions of operation the insulation is under. The value of the A factor is influenced by moisture in the insulation, acidity of the oil, and oxygen concentration in the oil. Recent research performed at SINTEF Energy Research in Norway [98] has shown that the values of A, which affects the ageing rate of the insulation, is quite different for thermally upgraded insulation (Insuldur) than for non-upgraded Kraft paper. A sample of the values they report for various conditions is replicated in Table 3-43. These values assume activation energy of 111 kJ/mol. Table 3-43: Estimated Ageing Factors, A Insulation Conditions Dry & Clean Acidic Oil Oxygenated Oil 1% Water Content 3-4% Water Content
Kraft Paper (2.0 ± 0.5) × 108 (2.4 ± 0.7) × 108 (8.3 ± 2.8) × 108 (6.2 ± 2.9) × 108 (21.0 ± 7.8) × 108
Insuldur (6.7 ± 1.4) × 107 (1.1 ± 0.6) × 108 (3.5 ± 1.4) × 108 (1.1 ± 0.5) × 108 (2.6 ± 1.7) × 108
If it is assumed that the DP of transformer insulation is 1,000 at the start of life and 200 at the end of life, the expected life under the conditions specified in Table 3-43 can be calculated using the life expectancy equation above. Figure 3-64 shows the life expectancies of Kraft paper, and Figure 3-65 shows the life expectancies of thermally upgraded paper using the nominal values of the A factors in Table 3-43. The life expectancy curves for nonupgraded and thermally upgraded insulation in power transformer as given in the IEEE C57.91-1995 loading guide are shown on the respective charts for comparison. If we consider upgraded insulation life at 110oC hot spot temperature, the Lundgaard formula gives a life of 9.4 years for dry insulation while the IEEE curve gives a life of 20.5 years. This may be attributed to the difference in the amplitude and exponent constants in the Arrhenius equations. For example, the activation energy used in the Lundgaard equation is 13,350, while that used in the IEEE equation is 15,000.
205
10000.0 Dry & Clean (Kraft) Acidic Oil (Kraft) 1% Water Content (Kraft)
1000.0 Life Expectancy (years)
3-4% Water Content (Kraft) IEEE C57.91-1995 Curve for 55C Insulation 100.0
10.0
1.0
0.1 50
60
70
80
90
100
110
120
130
140
150
o
Temperature [ C]
Figure 3-64: Life Expectancy of Kraft Paper Insulated Transformers
100000.0 Dry & Clean (Insuldur) Acidic Oil (Insuldur) 10000.0
Life Expectancy (years)
1% Water Content (Insuldur) 3-4% Water Content (Insuldur) 1000.0
IEEE C57.91-1995 Curve for 65C Insulation
100.0
10.0
1.0
0.1 50
60
70
80
90
100
110
120
130
o
Temperature [ C]
Figure 3-65: Life Expectancy of Insuldur Insulated Transformers
206
140
150
3.3.2.1.2
Latest Research Findings on DP Analysis
The following is a summary of the latest findings on DP analysis for power transformer diagnostics: Most researches and transformer insulation experts suggest DP at the end of life in the range 100-200, with most favoring a value of 200 [99]. Pahlavanpour [100] presents results that show that the DP of Kraft paper starts decreasing at 120°C. The rate of decrease of DP increases rapidly with increasing temperature and reaches end of life at 180°C. Hill [101] found a nonlinear relationship between tensile strength and DP. They found the tensile strength of Kraft paper decreases slowly with decreasing DP until the DP reaches a critical value of 500. At this point, the decrease in tensile strength is more rapid with decreasing DP. Lundgaard [98] found that the ageing of Insuldur paper is slower by a factor of about three and is less sensitive to moisture; the activation energy for the ageing of Insuldur paper is the same as that of Kraft paper; the ageing of Insuldur does not produce as much furfural (furans) as Kraft paper; the effect of water on ageing of transformers is more dramatic than oxygen; ageing of oil also increases the acidity of the oil; Insuldur paper produces more acids than Kraft paper. Moser [102] reports that an increase of 0.5 % water content in an ageing transformer will reduce the value of DP by one-half. If we have actual DP measurement or an estimated value of the DP at any given time, it can be substituted for the value of DPStart in the above equation to estimate the remaining life based on the prevailing insulation conditions. The difficulty, however, is that in order to get a sample of paper, the transformer must be opened. Moreover, the areas of greatest deterioration of cellulose material in a transformer (the hottest spot), is usually not easily accessible for obtaining paper samples. For this reason, other methods such as the furanic analysis discussed in the next section, are used to estimate the DP of the transformer insulation. 3.3.2.2
FURANIC COMPOUND ANALYSIS
This method of transformer condition analysis involves the measurement of trace furanic compounds in oil in transformers and relating the furanic content to the degree of polymerization of the paper insulation and to the remaining life of the insulation. 3.3.2.2.1
Origin of Furanic Compounds
The furanic compounds are five-member heterocyclic ring compounds that are produced when cellulose breaks down, due to thermal stress. Cellulose degradation produces other products also, such as carbon oxides and water, which are the ultimate degradation products. The furanic compounds are intermediate degradation products, which are liquids, and remain in the oil in trace quantities. At least six furanic compounds have been detected in transformer oil in units: furoic acid, 5-hydroxymethyl207
2-furfural (HMF), furfuryl alcohol, furfural, 2-acetylfuran, and 5-methyl-2- furfural, according to Burton and others who published the original research on furanic analysis in 1984 [103] (see Figure 3-66).
Figure 3-66: Furanic Compounds from Paper Degradation 3.3.2.2.2
Detection of Furanic Compounds
The most common analytical technique is HPLC (High Performance Liquid Chromatography), which involves extraction of the furanic compounds from oil, followed by injection of a small quantity of the extract into special column in the HPLC equipment. The column separates the components, and a chromatogram of peaks is produced that shows the individual compounds and its concentration. Details may be found in IEC Standard 61198 [104] and other publications. Other techniques such as GC-MS [105] and colorimetry [106] are described in the literature. 3.3.2.2.3
Correlation Curves of Furanic Content with DP
Furan levels in transformers are typically less than 0.1 ppm (some laboratories report furan content in parts per billion (ppb) – 1,000 ppb is equivalent to 1 ppm) and can remain at this level throughout the life of the transformer. However, in many older units levels of up to 1 ppm, and in some cases 10 ppm, have been measured [107]. In a study [108] of over 5,000 European transformers, a significant number were found to have furan content higher than 1 ppm. Several researchers have reported correlation curves between the furan content in oil and the corresponding average DP of the cellulose insulation. Although none of these equations are exact, they allow one to estimate the DP of the insulation from the more easily obtained furan content. Four equations proposed by Chendong [109], DePablo [110], Pahlavanpour [111], and Shkolnik [112] are given below: 1.51 Log10 (F) 0.0035 7100 DePablo : DP 8.88 F 800 Pahlavanpour : DP (0.186 F) 1 1.17 Log10 (F) Shko ln ik : DP 0.00288
Chendong : DP
208
Where: DP is the estimated DP value and F is the 2-furfural (or furan) content in ppm. A graphical representation of these equations is given in Figure 3-67.
Estimated DP Value
1000
Chendong - Kraft/Upgraded DePablo - Kraft Pahlavanpour - Kraft Shkolnik - Upgraded 100 0.01
0.1
1
10
100
Furfural Content (ppm or mg/liter of oil)
Figure 3-67: Correlation of Furan Content with DP
The latest research on this topic as mentioned in section 3.3.2.1.2 suggests that the ageing of thermally upgraded Insuldur paper does not produce as much furans as Kraft paper. Other findings [113, 114] are that the most significant production of furans occurs below a DP value of 400. It is known that the Shkolnik curve was derived from data collected on transformers with predominantly thermally upgraded insulation and is in agreement with recent research findings. Since the Pahlavanpour and DePablo curves were derived from European transformers, it is highly likely to be for predominantly Kraft insulated transformers and the recent research discussion bears this out. The Pahlavanpour curve is derived from the same data as the DePablo curve, but assumes a more realistic ageing pattern for transformers: 20% of the winding paper and the inner paper layers degrade twice as fast as the rest of the paper insulation. The Chendongcurve is suspected to be derived from transformers with mixtures of Kraft and thermally upgraded insulation [115]. Use the curve in Figure 3-67 that is closest to the insulation type for the transformer under consideration to estimate the DP value. Once an estimate of DP has been obtained, the equation and conditions outlined in section 3.3.2.1.1 can be used to estimate the remaining life of the insulation. 3.3.2.2.4
Issues to Consider in Using Furan Analysis
Below is a list of some of the issues that should be considered in applying this analysis to transformers:
209
1. Long-term stability of furanic compounds in oil: If these compounds are not stable in oil for long periods, we should at least know the rate of degradation. If we know the rate of generation from lab studies, we could perhaps adjust for the losses and estimate the absolute furanic content. 2. Distribution of furanic compounds between paper and oil: The furanic content of oil is related to the furanic content of the paper insulation. The latter is dependent on the paper to oil ratio and the temperature. The distribution between paper and oil should be known over a wide range of ratios and temperatures (just as moisture distribution between paper and oil). 3. When the oil in a transformer is changed (as in a reprocessing operation), most of the furanic compounds are lost. This is similar to dissolved gases being lost during oil change. It may, therefore, be necessary to maintain accurate records of prior analysis. 4. Correlation curves for different types of paper and pressboard materials would be needed to make meaningful correlation to DP from furanic estimations. 5. Thermally upgraded paper and non-upgraded paper give significantly different results because of the chemicals used in thermally upgraded papers. Make sure you are using the proper correlation curves for your transformers. It is not advisable to de-energize a transformer based on furanic analysis alone. This test just provides an indication of the health of the paper. Furanic analysis is recommended by many experts to give an indication of remaining life when the CO2/CO ratio is less than 3 or greater than 10.
210
3.3.3 3.3.3.1
DIELECTRIC FREQUENCY RESPONSE AS A TOOL FOR TROUBLESHOOTING INSULATION POWER FACTOR PROBLEMS INTRODUCTION
The insulation power factor (or dissipation factor, tan 27) measured at power frequency is the most commonly used electrical test in North America and elsewhere for routine evaluation of the insulation system of large power transformers and bushings. Typically, defects in the insulation show up as either high or “unusual” power factor values [116]. While the test provides an important benefit to identify when a problem exists in the transformer insulation, it is often difficult to determine the exact cause of the high or unusual power factor reading. Often, the utility owners of the transformers will opt to just process the transformer to remove moisture in an attempt to correct the power factor results. This expensive process often works if the power factor problem is attributable to moisture. However there are many instances when the underlying cause of the high power factor remains unknown. 3.3.3.2
DIELECTRIC FREQUENCY RESPONSE AND X-Y MODEL
The dielectric frequency response test (DFR) has been recently developed as a diagnostic tool for transformer insulation system testing. The DFR measurement is similar to the power factor or tan measurement, except that it is a series of power factor measurements at multiple frequencies. The advantage of doing the measurement at multiple frequencies is that it provides much more information which makes it possible to distinguish properties of both the cellulose and oil insulation separately. Since the effect of moisture and ionic contamination on the dielectric properties of the insulation system is more pronounced at low frequencies, the preferred measurement frequency range is 1,000-0.001 Hz. The dielectric properties evaluated are the real and imaginary capacitances (or permittivities) and the dissipation factor. Figure 3-68 shows an example of a dielectric frequency measurement showing the complex permittivity with the 50 Hz values marked. The DFR measurement is similar to the power factor or tan measurement, except that it is a series of power factor measurements at multiple frequencies. The advantage of doing the measurement at multiple frequencies is that it provides much more information so that the dielectric parameters of the insulation may be determined. Since the effect of moisture and ionic contamination on the dielectric properties of the insulation system is more pronounced at low frequencies, the preferred measurement frequency range is 1,000-0.001 Hz. The dielectric properties evaluated are the real and imaginary capacitances (or permittivities) and the tangent delta (dissipation factor), which is essentially equivalent to the power factor for the range of values under consideration.
27
power factor (PF) is essentially equivalent to dissipation factor (DF) for the range of values under
considerations in transformer diagnostics. i.e. PF
DF
1 DF 2
211
Real part = Capacitance
Imaginary part = Loss
50 Hz
Figure 3-68: Example of dielectric frequency response measurement showing the complex permittivity.
The DFR measurement is performed with an instrument capable of measuring the complex impedance of the transformer winding insulation. One such device is shown in Figure 3-69. A variable frequency voltage is applied to the object, and the complex calculations are performed by digitizing and processing voltage and current signals. The normal complement of measurements is possible, including winding capacitance to ground with and without guard and the ungrounded specimen test. See section 3.2.7 for coupling details.
Figure 3-69: IDA200 Dielectric Response Measurement System (Courtesy of General Electric)
Knowledge of the transformer designs is helpful in identifying the test setup and connections. This information is also needed later for the analysis of the DFR results to determine the dielectric properties of the insulation, including moisture content.
212
The analysis of the DFR measurement involves modeling the transformer insulation materials and structure as measured [117]. Obviously the insulation structure is quite different for different types or designs of transformers. The detailed information required for this model is obtained from manufacturing drawings of the transformer insulation system. For modeling purposes the complex geometry is represented by a simplified equivalent structure, the X-Y model, Figure 3-70. The relative barrier content, X, represents the solid insulation in series with the oil in the main insulation. The relative spacer coverage, Y, represents the relative amount of the circumference that is covered by the spacers. Typical values for X and Y are 10 – 40 %. In the absence of design data, representative values for these parameters can be suggested by rough estimates, typical values are for example X=Y=20 %.
Spacer
y
Barrier Oil
x
1-y
1-x
Figure 3-70: Typical Layout of Transformer Insulation Duct
In the modeling the oil is characterized by its DC conductivity and power frequency permittivity. The dielectric properties of the cellulose are characterized by DC conductivity, power frequency permittivity, and dielectric response function. ABB has compiled a database of such dielectric properties for oil-impregnated cellulose at various moisture contents and temperatures. This database is merged into an analysis tool developed by ABB that models the insulation geometry and the insulating materials (oil, paper, pressboard, etc.) of the transformer. In the modeling procedure, the design information and test data as described above are input into the algorithm that calculates the response of the composite system. The moisture in cellulose and oil conductivity values could then be optimized for a best fit of the calculated response curve to the measured DFR data. In particular the influence of the oil and the solid insulation on the dielectric response could be separated from each other. Figure 3-71 shows an example of the ABB analysis tool. The red markers are measured complex capacitance of a new dry transformer; the green markers measured complex capacitance of an old wet transformer; and the solid line is a model fitted to the old wet transformer measurement. The model provides an estimate of the moisture content of the cellulose and the oil conductivity. ABB has used these tools for the past several years for analysis of transformers both in the factory and in the field. The experience gained from the tests and analyses have 213
shown the potential of the DFR test for identifying not only moisture problems, but also other defects in the transformer insulation structure.
Model
Old Transf. New Transformer
Figure 3-71: ABB analysis tool for DFR measurements on transformers. Measurements of New dry transformer (red markers), Old wet transformer (green markers) and Model (lines) fitted to old transformer estimating moisture content of cellulose and oil conductivity. 3.3.3.3
CAUSES OF HIGH POWER F ACTOR IN T RANSFORMER INSULATION
The traditional view is to ascribe high power factor measurements to either moisture in the insulation or ionic contamination of the oil and/or cellulose insulation. However, there are several conditions in a transformer that can lead to high or unusual power factor measurement results. Some of the causes that have been diagnosed by ABB experts are listed below: Moisture in the cellulose insulation High oil conductivity due to ageing or overheating of the oil Chemical contamination of cellulose insulation Carbon tracking in cellulose High resistance in the magnetic core steel circuit In the sections that follow a description of the use of DFR measurement to diagnose each of these conditions is presented. 3.3.3.3.1
Comparison of DFR to Power Factor Measurement
In our analysis so far, it has become evident that several factors contribute to the proper diagnosis of the status of transformer insulation. Some of these factors have either significant or no effects on the power factor measurement at power frequency.
214
3.3.3.3.2
Influence of Oil Conductivity and Moisture on PF and DFR
The conductivity of mineral oil in a transformer can be affected by several factors such as moisture, temperature, contamination, etc. The conductivity is directly related to the dissipation factor of the oil and thus to the dielectric losses of the transformer. The dielectric properties of cellulose insulation are also affected by moisture in the insulation[118]. As a result, one cannot differentiate between the influence of moisture and oil conductivity for the power factor measurement. This is demonstrated by the following example. Figure 3-72 shows a typical 60 Hz power factor measurement result for a single phase shell form transformer. Along with the power factor measurement is a plot of the calculated DFR for the transformer assuming two different scenarios: one with low moisture and aged oil and one with higher moisture and new oil. As can be seen in Figure 3-72, it is not really possible to predict the moisture in the insulation or the oil characteristic from the power factor test. In fact, it is entirely possible to misinterpret a power factor reading as indicating high moisture when in fact it may really be due to bad oil conductivity. The DFR test on the other hand gives information to predict both the oil conductivity and the moisture content in the cellulose insulation. Figure 3-73 shows the same information as Figure 3-72, only the DFR test result is added. As can be seen from this data, the actual transformer characteristic is 0.7 % moisture and an oil conductivity that is only slightly aged. 1.000
Aged Oil, 0.5% Moisture Good Oil 1.3% Moisture
Tan D
0.100
PF =. 00324
0.010
0.001
1
.001
1
.01
8
.1
3
1
5
10
100 1000
Frequency, Hz Figure 3-72: Comparison of Power Factor Measurement to Two Different DFR Possibilities
215
1.000
Aged Oil, 0.5% Moisture Good Oil 1.3% Moisture PF =. 00324
Tan D
0.100
Measured DR
0.010
0.001
1
.001
1
.01
8
3
.1
1
5
10
100 1000
Frequency, Hz Figure 3-73: Comparison of Power Factor and DFR Measurement to Two Different DFR Possibilities 3.3.3.4
DIELECTRIC FREQUENCY RESPONSE SIGNATURE AND I DENTIFICATION T ECHNIQUES
A further enhancement has been made to the DFR test by ABB experts to make it into a defect identification tool. The method processes the measured DFR data and converts it into a normalized signature function that is sensitive to changes in the normal dielectric loss frequency spectrum. For the sake of this discussion, this normalized function is referred to as the Dielectric Frequency Response Signature (DFRS). To use the DFRS as a means for identifying defects in transformer insulation, it is necessary to understand and model the internal and external insulation structures of the transformer. Since different types of defects affect different portions of the insulation structure, it is important to know the different possible test configurations and how to interpret the corresponding results. Figure 3-74 shows a simplified model diagram for a two-winding transformer that shows some of the possible insulation paths where defects may occur. HV
XV
CORE
HV Bushing
XV Bushing
Figure 3-74: Simplified Insulation Circuit Diagram for a Typical Two-Winding Transformer
216
The first step in the identification process is to identify the particular insulation section that is responsible for the high or unusual power factor result. This is accomplished by making various measurements of the circuit including node-to-ground and node-to-node with other nodes either grounded or guarded (these correspond to the UST and GST tests of the traditional power factor measurements). In many transformers it is possible to guard out the core or the bushings in order to sectionalize and isolate the various insulation paths. The DFR test is then performed on this isolated part of the insulation system and the resulting response curve is analyzed by the calculation method described earlier. From this analysis, a DFRS is generated that is used in the defect identification process. The identification of the defect or the cause of high power factor is accomplished by comparing the DFRS to other DFRS functions from transformers with known defects or to results from laboratory tests. This comparison involves both the section of the insulation structure tested and the shape of the DFRS. The insulation section under evaluation depends on the type of test performed (for example, a test between the HV winding and ground with the LV winding guarded would address one insulation section). This is important since the shape of a DFRS varies depending on the particular insulation section involved. The comparison of the shape of the DFRS involves a comparison in magnitude and frequency of two DFRS functions, one from the unknown specimen, and the other from the library of DFRS functions for known defects or causes of high power factor. By matching the insulation section and the shape of the DFRS functions, the potential defects or the causes of the high power factor can be identified. 3.3.3.4.1
Identification of high Core-Grounding Resistance Problems
A cause of high power factor in transformers is a high resistance in the core grounding circuit, which may be caused by a higher than normal resistance between the individual core laminations or between the core and the grounding strap. In the past, it has been difficult to distinguish between high power factor readings caused by this higher core grounding resistance and moisture in the insulation. As a result, a number of transformers have undergone needless drying processes due to misdiagnosis. The DFRS technique has proven to be helpful in identifying when a transformer has this particular condition. Figure 3-75 shows a plot of the DFRS function for a normal and a high core grounding resistance.
217
Normal Core Ground High Resistance Core Ground
Figure 3-75: DFRS Functions for a Normal and a High Value of Core Grounding Resistance
This data came from measurements on a core form transformer when a resistor was added in series with the core grounding strap. As can be seen from Figure 3-75, the effect of a higher than normal core grounding resistance manifests itself as an increase in DFRS at higher frequencies, but with no effect at lower frequencies. For the case shown in Figure 3-75, the effect is also clearly detectable at power frequency. This shows that a high core grounding resistance affects the power factor results at power frequencies. Figure 3-76 and Figure 3-77 show results where the DFRS method was used to diagnose high core grounding resistance in cases where the transformer power factor results were abnormally high. During a standard power factor test in the field, Transformer 1 (shown in Figure 3-76) showed normal results, and Transformer 2 showed elevated power factor results above 0.5%. The DFR test was performed to aid in the determination of the cause of the higher power factor. The diagnostic interpretation of the DFRS functions for the two shell form transformers is that the core-to-ground resistance is higher than normal for Transformer 2. This high core-to-ground resistance condition was later verified and corrected.
Shell Form Transformer 1 Shell Form Transformer 2
Figure 3-76: DFRS Functions for two Shell Form Transformers
218
Figure 3-77 shows the results of a test on a core-form transformer that exhibited high (above 0.5 %) power factor results. The dielectric frequency response test was used to isolate the section of the insulation that was causing the high power factor. The DFRS function was then used to identify the cause. The insulation section was identified as the low voltage to ground insulation and the analysis of the DFRS comparison identified the cause as a high core-to-ground resistance. Upon inspection of the transformer, the high core-to-ground resistance was traced to an auxiliary transformer used in a load tap changer. Figure 3-77 also shows the same DFRS function for the transformer after the auxiliary transformer was modified to reduce the core-to-ground resistance. The DFRS function measured after the repair is similar to the shape for a normal transformer core ground as shown in Figure 3-75.
XV to Ground XV to Ground after Repair
Figure 3-77: DFRS Function caused by a High Core to Ground Resistance in Auxiliary Transformer
Moisture in a transformer is concentrated in the cellulose insulation due to the moisture equilibrium properties of the oil/paper system. Moisture in the cellulose causes an increase in the dielectric loss of the insulation, which is reflected in higher power factor test values. The DFR test is a valuable diagnostic tool for not only identifying if moisture is the reason for a high power factor test result, but also for quantifying the actual amount of moisture in the insulation. Figure 3-78 shows the effect of moisture on the shape of the DFRS function. As can be seen in this example, the effect of moisture is most pronounced at lower frequencies, which is the characteristic used in identifying high moisture in transformers.
Normal Moisture High Moisture
Figure 3-78: DFRS Function Showing the Effect of High Moisture
219
3.3.3.4.2
Identification of Paper Contamination Problems
Paper contamination in transformers is a rare occurrence. Nonetheless, it is of great advantage to be able to recognize and differentiate between contamination and other causes of high power factor. As with other types of transformer defects, this requires experience from testing insulation systems, which happen to have this problem. With limited experience in actual cases, it is not known if a single DFRS shape can be used to identify all types of contamination. It is possible that different types of contamination in different insulation sections will have different DFRS profiles. Figure 3-79 shows a DFRS for a transformer where the high power factor was caused by a chemical contamination of the windings. Although the profile is similar to that of the high resistance core ground, the insulation section exhibiting the defect was different. In addition, the frequency of the peak was lower than any of the core ground resistance cases. This case opens an avenue for further study of contamination recognition using the DFRS method.
Figure 3-79: DFRS Function Caused by Chemical Contamination of the Windings 3.3.3.4.3
Low Temperature Effect on Insulation Power Factor
This case involves a new 500 kV shell form auto transformer that was installed and tested in the field. The test results showed more than a doubling of the power factor between the factory values and the levels measured in the field after installation. The DFRS method was employed to determine the cause of this increase in power factor. Table 3-44 shows the comparison of power factor measured in the factory and in the field. The DFR measurements were done both in the factory and in the field, and the results are shown in Figure 3-80. The main difference in the conditions between the factory and the field was the temperature of the transformer (33.5 °C in the factory and 9 °C in the field) and the actual oil in the transformer was different between the factory and the field. The results of the DFRS comparison showed that both curves were normal, and there was no degradation in the condition of the insulation system. The only plausible explanation for the difference in the power factor results is that the temperature correction factors used do not correctly represent the actual change in power factor, especially when the temperature is below 20 °C.
220
Table 3-44: Comparison of Factory and Field Power Factor Results (Corrected to 20°C) Test Condition Factory Field
Oil Temp. 38 9
PF, % HV-gnd 0.22 0.35
PF, % YV-gnd 0.28 0.39
PF, % HV-YV 0.26 0.41
Case 3 HV-XV DFRS Measurement Factory DFRS Data
Figure 3-80: DFRS Functions for Both Factory and Field Measurements on a Shell Form Transformer
To further investigate the difference between the temperature correction factors used in the industry, and the actual variation of power factor with temperature for this transformer, a curve was developed using the DFR software. Figure 3-81 shows a comparison of the calculated temperature correction to the commonly used correction factors. From this curve, we can easily see why the power factor test results reported were so different between the factory with an oil temperature of 33.5 °C and the field with an oil temperature of 9 °C. It should be noted that this shell form transformer has an unusually high ratio of paper-to-oil in the high-to-low space where the measurement was made. It is not known at this point if this contributed to the exaggerated difference between the actual variation in power factor vs. temperature and the Doble or ANSI correction factor curves.
221
TCF
2.4 2.2 2 1.8 1.6 1.4 1.2 1 0.8 0.6
ANSI Factors Doble 230kV up Case 3 Transformer
-5 0
5 10 15 20 25 30 35 40 45 50 55 60 Temperature,°C
Figure 3-81: Comparison of Calculated Temperature Correction Factor for Shell Form Transformer to Commonly Used Correction Factors in the Industry
3.3.3.5
SUMMARY
This section demonstrates the usefulness of the dielectric frequency response signature (DFRS) for identifying various causes of high insulation power factor, such as moisture in cellulose, high resistance in the magnetic core steel circuit, and chemical contamination. The method is suitable for troubleshooting power factor problems in the factory or the field. In addition, it is important to emphasize that the dielectric response test is used to estimate the dielectric properties of transformer insulation, such as the average volume moisture [%] in solid insulation and the power factor of the oil. The DFR method has been found to be more accurate than existing industrial methods, for example, dew point test and moisture/oil equilibrium method. These methods predominantly estimate the surface moisture of the insulation. Using the derived DFRS method to diagnose the cause of high power factor will focus maintenance resources in the proper direction and prevent costly drying or over-drying of transformer insulation when moisture is not the issue. It is clear that there could be problems in applying the Doble or ANSI temperature correction factors for power factor for all transformers. As demonstrated in the one case described above, the use of one of these factors can lead to erroneous conclusions regarding the insulation condition. It is ABB’s opinion to not use any correction factor unless a reliable calculated factor is used that is based on the actual properties of the transformers insulation system. Further investigation is needed to determine a better method for correcting power factor results that is applicable to different transformers.
222
3.3.4 3.3.4.1
ASSESSMENT OF ELECTRICAL PROPERTIES - PARTIAL DISCHARGE MEASUREMENTS [119] PURPOSE OF MEASUREMENT
A partial discharge measurement (PD-measurement) is a non-destructive tool used to establish the condition of a transformer insulation system. A PD-measurement makes it possible to detect and localize areas within the transformer that are exposed to elevated dielectric stresses. Partial discharge measurements are explicitly specified in standards or in customer specifications. They are to be carried out in conjunction with dielectric tests in high-voltage laboratories using AC-voltage in the power frequency range. For onsite PD measurements (for example on repaired transformers) other types of PD-free excitation may be required. Partial discharge measurement should generally be the last dielectric test conducted on the transformer. A partial discharge is a partial voltage breakdown within a series of insulating elements between two electrodes of different potential, (capacitances C2’ and C3’, see Figure 3-82). During a typical PD measurement, the magnitude of the detectable value of partial discharge activity is recorded as a function of the applied voltage. A partial discharge can also be interpreted as the rapid movement of an electric charge from one position to another.
Figure 3-82: Schematic of Part the Transformer Insulation
223
Where: BU = bushing HV = high voltage NT = neutral terminal C1, 2, 3 = active part of transformer (including oil) C1 = weak region ’ ’ C2 and C3 = test object capacitance
If the two line terminals are connected together via an external capacitor Ck, the charge movements within the series-connected insulation links (capacitances C2’ and C3’) will also be reflected in the charge of the external capacitor, Ck. The charge movements can be detected as circulating current impulses i(t) in the parallel-connected capacitors Ck and the test object. 3.3.4.2
ELECTRICAL PD MEASUREMENT ON T RANSFORMERS
Circulating PD current impulses generated by an external PD source (in the test circuit) or by an internal PD source (in the insulating system of the transformer) can only be measured at the transformer bushings. Bushing capacitance C1 acts as the coupling capacitor Ck, which is connected in parallel with capacitance Ct (test object = total capacitance of the transformer insulating system). For power transformers, a measuring impedance Zm, is generally connected between the bushing measuring tap and ground, i.e. in parallel with bushing C2 capacitance (see Figure 3-83). For bushings without a capacitive tap an external coupling capacitance Ck must be connected in parallel with the bushing. According to IEC, which is the preferred method for these tests, PD measurements are conducted by measuring the “apparent charge,” q. In this context, the apparent charge is obtained by integrating the PD current impulse using a “wideband” or “narrowband” filter. The PD measuring system is connected via a coaxial cable to the measuring impedance Zm (see Figure 3-83). The apparent charge q, measured in Picocoulombs (pC), corresponds to the charge transferred during the V voltage drop compensation process at one of the parallel-connected capacitances Ct (transformer insulation) and bushing capacitance C1 or coupling capacitance Ck. This voltage drop V may be caused either in the test object (internal partial discharge in the bushing or in the transformer insulating system) or in the test circuit (external partial discharge). If PD activity is detected during the test, the PD source must be investigated.
224
Figure 3-83: PD Calibration and Measurement Setup for Transformers; Bushings with Capacitive Taps
The magnitude of measurable apparent charge q in pC must be defined by the calibrating procedure for each test circuit. 3.3.4.2.1
Calibration
Calibration of the PD test circuit is performed using a battery-operated calibrator. A calibrator consists of a square-wave generator with adjustable amplitude Vo connected in series with a small capacitor C0, which should be less than 10 % of C1. For PD measurements on transformers, the calibrator is connected across the bushing, or across the coupling capacitor connected in parallel with the bushing (see Figure 3-83). Calibration must be performed separately for each bushing. Under the assumption that C0 << Ck, the injected impulse from the square-wave generator corresponds to the charge q, which is set to predefined values (100 pC, 1,000 pC, etc.) by the adjusting the amplitude Vo. IEC 60270 recommends that the rise time of the injected impulse should be less or equal to 60 ns, amplitude V0 between 2 V and 50 V, selectable polarity, and a repetition rate of 100 Hz. Based on this, the injected charge is calculated as: q0 = V0 × C0 The measuring circuit, consisting of the capacitance Ct of the test object, coupling capacitor Ck, measuring impedance Zm, coaxial cable, and measuring system, is now calibrated. During the PD test the measuring system values are read directly in pC. This pC reading is only valid for the specific calibrated bushing.
225
3.3.4.2.2
PD measuring procedure
According to the IEC Standards [120], PD measurements shall be carried out in conjunction with induced voltage test. Any wide bandpass filter or narrow bandpass filter can be used as a PD measuring system. The first PD measurement should be made at a low test voltage level (approx. 10 % rated voltage). This value serves as a reference for the background noise level in measurement system. According to the lEC Standards, the background noise level must be lower than half of the required pC value of apparent charge for the specific transformer. PD activity must be checked at all HV bushings on the transformer. The best way to accomplish this is to apply a multichannel PD measuring system capable of detecting PD activity at all bushings simultaneously. A description of such a system (ICMsystem) used by some ABB HV laboratories is given below. The PD test is considered successful if no continuous PD activity greater than the specified apparent charge amplitude in pC is detected at any bushing and if there is no rising trend in the apparent charge amplitude during the long duration test. The recommended acceptable values of apparent charge given in the IEC standards are: 300 pC at 130 % rated voltage 500 pC at 150 % rated voltage The level of continuous PD activity does not exceed 100 pC at 110 % rated voltage. 3.3.4.2.3
An Advanced PD system
The ICMsystem (manufactured by Power Diagnostix Systems GmbH, Germany) is a specially designed modern PD system to meet the requirements of partial discharge measurements on power transformers. The ICMsystem uses wide-band filters for both digital data acquisition and further data processing of conventionally detected PD signals. True parallel acquisition of PD impulse currents on multiple channels is achieved by using multiple individual amplifiers (wide-band filters) connected to multiple measuring impedances at the bushings via eight preamplifiers. The PD activity is detected simultaneously on all multiple channels and processed in a controller unit. PD readings can be weighted according to IEC in pC or according to IEEE [121] in V. An example of the ICMsystem is shown in Figure 3-84. In addition to PD signal detection, the ICMsystem offers independent channels for voltage measurements via a separate tap at each measuring impedance, Zm.
226
Figure 3-84: Advanced PD System, ICMsystem [122]
Besides conventional PD signal detection of the apparent charge values, the ICMsystem is capable of performing a statistical analysis of the detected PD activity (i.e. phase-resolving partial discharge analysis PD pattern) at each specific channel. A PRPDA analysis produces a two- or three-dimensional PD pattern (phase angle, discharge magnitude, and number of events are obtained, see Figure 3-85). For twodimensional PD patterns the third dimension (number of counts per channel) is indicated by the color code. The PD pattern reflects the sum of all PD impulses collected during a specific measuring time (for example, a preset time of 60 seconds corresponds to 3,600 cycles for a 60 Hz test voltage power frequency). The PD pattern provides a fingerprint of the partial discharge activity of a specific defect in the test object. A phase-resolved PD system presents great advantages over the conventional PD system in its ability to perform a statistical analysis of the detected PD current impulses (PD pattern). A conventional PD system delivers phase-resolved information about the PD activity for only one cycle. A phase-resolving partial discharge analysis delivers information for several cycles of the signal, which is important for identification of the type of PD source for the following reasons: PD patterns identify a specific type of PD source (image of the physical process, see Table 3-45 and Table 3-46). PD patterns are not influenced by the signal transfer function of the extended insulating system (statistical behavior does not change). PD patterns can be used to distinguish between superimposed PD defects on the basis of different statistical behavior.
227
Figure 3-85: Registration of PD Impulses in Advanced PD System (Statistical Analysis of PD Impulses) 3.3.4.3
PROCEDURE FOR I NVESTIGATION OF PD SOURCES
If PD activity that exceeds the acceptable requirements is detected, the type of the PD source and its location (external or internal in the insulating system) must be investigated. The procedure for investigating the PD source should generally be adapted to the behavior of the registered PD activity. The first step is to exclude all possible external PD sources. Typical external PD sources are: Low-Voltage Power Supply: Noise such as thyrister pulses or harmonics from the lowvoltage power supply may especially influence a sensitive PD system, which is directly connected to the power line. If these are present, a low-pass filter or insulating transformer should be used. Due to the filtering effect of the step-up transformer of the high-voltage source and of the HV filter in the PD system connection to the test object, the noise from the low-voltage power line is usually sufficiently suppressed. If there is a noise problem, a second step-up transformer may be used as an additional filter or a PD system with a narrow-band filter could be used (f0> 1 MHz). High-Voltage Source: An HV source must generally be PD free. If there is a problem, the coupling capacitor can be connected directly to the source (without the test object) to easily check the HV source. High-Voltage Filter: In difficult cases (for example, a station with a lot of electromagnetic interference), a PD-free, low-pass HV filter must sometimes be used. Connections in the Test Circuit and Electrodes: All bushing tops (even grounded bushings) and sharp metallic parts on top of the transformer (especially close to the bushings) should be shielded. All connections should be PD free, i.e. with sufficient radius). In addition, the bushing surface must be free of conducting particles. All measuring impedances Zm, must have a good connection to ground. If there is a problem, an ultrasonic detector (corona gun) may be used to detect an external PD 228
source. The PD type can be determined from the statistical analysis of the PD signals (typical PD-pattern, see Table 3-45). Coupling Capacitor: The coupling capacitor must be PD free. If there is a problem, the coupling capacitor must be measured separately. Conductive Objects Close to the Transformer under Test: Ungrounded conductive objects close to the transformer under test could become charged to a high potential due to the electric field. If the breakdown field value is reached, a pulse-like discharge may occur. These PD impulses may be coupled to the PD test circuit and detected at the measuring impedances and produce very high apparent charge amplitude. This PD source can be recognized by comparing it with typical PD patterns, by visual observation of the surroundings or by using an ultrasonic detector. Table 3-45: Typical PD Sources in the Transformer Insulating System
Once all external sources have been eliminated and there is still partial discharge activity, the process begins of identifying the type and possible location. In reality, the five typical PD patterns appear in many variations. Because of the charging and discharging effect at the PD site, there is continuous change of both the surrounding
229
area of the PD source and the PD source itself. Consequently, there are only a few PD patterns that exhibit constant behavior during the test. During an analysis, the basic PD pattern characteristics that should be analyzed are: Phase position of the PD signals Symmetry of the PD signals during the positive and negative sine wave Number of PD signals per cycle Reproducibility of the PD pattern Interpretation and screening of the correct type of PD pattern from the real PD pattern results requires experience and a strong interpolation capability. If PD defects are superimposed, a comparison with the typical types of PD patterns and finding the correct type of PD pattern becomes much more difficult. An overview of the typical PD sources in the transformer insulating system together with their typical PD pattern and their typical behavior during the test is presented in Table 3-46 . If there is a clear indication of internal PD activity in the transformer insulating system, localization of the PD source must follow. Localization of PD sources is more effectively done using ultrasonic techniques as described in the next section.
230
Table 3-46: Typical PD Defect Patterns in Power Transformer Insulation Typical PD Defects in the Transformer Insulation Conducting Material = PD Pattern Type 1
231
Typical PD Defects in the Transformer Insulation Conducting Material = PD Pattern Type 2
232
Typical Defects in Transformer Insulation Bubbles = PD Pattern Types 3 and 4
3.3.4.4 3.3.4.4.1
ACOUSTICAL PARTIAL DISCHARGE MEASUREMENT ON T RANSFORMERS Acoustic PD Wave Characterization
An acoustic PD signal is a mechanical vibration characterized by its frequency, f. A PD source acts as a point source of acoustic waves. The intensity of the emitted acoustic waves is proportional to the energy released during the discharge and may be expressed as: W1 =q1
V1
Where: W1 = locally released energy q1 = local charge V1 = local voltage drop Acoustic wave propagation occurs only if the wavelength of the generated wave is small compared with the length of the propagation path. In a specific medium the wavelength is given by: 233
=v:f Where: = wavelength = sound velocity in a specific medium (1400 m/s in oil) f = frequency of mechanical vibration (acoustic wave) Oil by itself is a perfect medium for the propagation of acoustic waves, with no attenuation or dispersion occurring. However, in transformers, acoustic wave propagation is heavily influenced by the complicated structure of the insulating system (winding barriers, core, and tank walls). The amplitude is affected due to signal attenuation and the signal shape is affected due to absorption and dispersion by the different media in the path of the acoustic signal emitted by the PD source. Besides the absorption and dispersion phenomena, the multitude of wave types complicates the analysis of acoustic PD signals detected in a multi-material structure. Two types of waves must generally be considered for the analysis of acoustic signals: Transversal waves, attenuation dependent on wall thickness Longitudinal waves, higher velocity than transversal waves (approximately by a factor of two) The velocities of sound for the two wave types for different materials found in transformers are given in Table 3-47. Table 3-47: Example of Sound Velocities
Material Oil Pressboard (parallel to fiber) Pressboard (perpendicular to fiber) Steel, plate (transversal wave) Steel, plate (longitudinal wave)
Velocity [m/s] 1,400 2,000
Density [kg/m3] 950 1,250
3,500
1,250
3,200
7,900
5,200
7,900
The two waves take different propagation paths from the source to the walls of the tank. An acoustic sensor positioned at a defined location on the tank wall detects both directly propagated waves and wall-propagated waves. As shown in Table 3-47, the two wave types have different propagation velocities. In order to localize the PD sources by analyzing the time difference between the electric and acoustic PD signals, there must be a possibility to distinguish between directly 234
propagated and wall-propagated waves. This information is theoretically hidden in the wave front of the acoustic signal that is detected at the sensor on the tank wall. Special processing software is used to analyze these signals. 3.3.4.4.2
Acoustic Partial Discharge Localization
A minimum of three acoustic sensors (piezoelectric transducers, such as the one shown in Figure 3-86) and at least a four-channel digital oscilloscope or signal recorder are required to localize PD sources using the time difference between electric and acoustic signals. An advanced detection system previously manufactured by ABB uses three transducers arranged geometrically as shown in Figure 3-87. The three transducers are placed close to one another in an equilateral triangle with L = 0.15 m so that the propagation path of the acoustic waves from the PD source is nearly the same. The system defines its own x, y, and z coordinate system. The normalized coordinates (x, y, z) give the direction to the source and depend only on time differences in the detection system. It is assumed that the distance between the transducers L is considerably less than the distance of the acoustic sensors to the PD source.
Figure 3-86: R15 Piezoelectric Sensor (Courtesy of Physical Acoustics Inc.)
235
Figure 3-87: Geometric Layout of ABB Three Transducer (TTD) Acoustic Detection System
A typical result obtained by the acoustic-system is shown in Figure 3-88. Due to the different paths of electric and acoustic PD signals through the insulating system of the transformer, there is no simple relationship between the amplitude of apparent charge and the amplitude of acoustic waves. Knowledge of the transformer insulating system and experience in the analysis of the results are needed to localize PD sources by analyzing acoustic PD signals.
Figure 3-88: Typical TTD System Results
236
4 FAULT ANALYSIS28 4.1
GUIDANCE FOR PERFORMING FAILURE ANALYSIS 4.1.1
INTRODUCTION
Since the introduction of AC technology as the backbone of electricity supply systems more than 100 years ago, the transformer has been an indispensable link in the chain of power transmission from the power generation to the consumer. Its operational reliability is a crucial factor for the dependability of supply of the entire system. The failure of a transformer always results in an interruption in the energy supply of consumers with considerable consequential costs. These costs affect not only the supplier in the form of power loss and expenditure on repair work or replacement. Consumers are also affected in terms of interruptions in work processes, production of waste, loss of data, failure of safety equipment, possibly involving risk to life and limb, e.g. in road traffic situations or in vital hospital functions. In terms of the investment costs of the grid, transformers constitute a significant factor; after all, they account for more than 30 % of the capital expenditure on a transmission substation. The failure statistics of the utilities and network operators present a high level of operational dependability and reliability for power transformers. A typical example here is provided by the failure and availability statistics from the Confederation of German Network Operators (VDN) for the year 2004 (see Figure 4-1) [123]. For the mediumvoltage range (up to 36 kV), these statistics show a failure rate of 0.15 %; in the highvoltage range (up to 220 kV) of 0.2 – 0.4 %, and in the extra-high-voltage range (380 kV) of 0.5 to 2 %. These figures, however, apply only to the German network; they cannot be transferred to other national grids with different operating conditions. They can, however, be regarded as typical for industrialized countries. In newly industrializing and developing countries, higher figures could be expected.
28
Written by Dr.-Ing. Reinhart Baehr, Viernheim/Germany
237
Figure 4-1 - Number of transformer failures with and without supply interruption (reference: 100 transformers in MV, HV and EHV)
In the past, highly qualified experts were available at both the manufacturers and the utilities, which thanks to their extensive experience were able to swiftly and knowledgeably assess failure histories, damage extent and measures for restoring operational capability, repair or replacement of the defective units, and to take the appropriate decisions. Now that in-house engineering capacities have been downsized by reasons of rigorous economy measures in the course of privatization and deregulation, this specialized competence is increasingly at risk of being lost. The replacement of engineering knowledge and long years of experience by electronically based expert systems (much advocated as an alternative) is not very successful, due to the complexity of many fault scenarios, and can easily lead to incorrect decisions with serious consequences. Power transformers are designed according to individual specifications. The mean number of identical units is in the range of only two. Even if the main data and design principles are specified, there are major manufacturer-specific differences in the details. This applies to the dimensions, the choice and quality of the materials concerned, and the quality of the craftsmanship, as well as to the local electrical, thermal and mechanical operating stresses. This makes it more difficult to draw up general rules, criteria and algorithms for condition assessment and fault analysis by expert systems. In addition, even in the case of transformers of identical design, their life history and their individual service conditions will be different. It depends on the load, the age, the previous stress from system disturbances, overloads, overvoltages and climatic conditions. These influencing variables will be differently linked for each individual transformer. Even highly specialized logic systems, e.g. fuzzy logic, suitable to evaluate even vague data such as “fluctuating load, high switching frequency” etc., are not suitable to produce optimum decisions for an individual fault case. Irrespective of the methodology, the tools and the skills of the persons charged with the failure investigation, success will depend primarily on the availability and quality of the
238
relevant data for the damage concerned. In the past, the lack of systematically collected individual life data often impeded fast and accurate fault analysis and correct decisiontaking if a transformer failed during operation. Therefore it is advisable to maintain a “logbook” right from the beginning for each transformer. This should contain a minimum of characteristic design data and reference values (fingerprints) for important criteria, describing the initial condition of the transformer. These data shall also include oil reports, gas-in-oil analyses and PD-, DFR- and FRA- patterns before commissioning. This logbook should be updated during the entire lifetime of the unit with operating data and information concerning all unusual events in the system, such as short-circuits, overvoltage events, overloads in the grid and maintenance work, oil analyses, gas analyses, inspections and repair jobs, relocations, transports, measurements, etc. Common definitions and a common recording system for these data using electronic IT are recommended. The preparation of international recommendations and standards is on the way (CIGRE, IEC) [124]. They will support comparability, and can be used to provide improved predictions for operational reliability and residual lifetime.
4.1.2
FAILURE DEFINITION
The English language makes a distinction between “failure” and “fault”, with “failure” denoting an incident that results in a disturbance of operation, and “fault” indicating the faulty state of the equipment after a failure has happened. According to series IEC 60050, failure of a piece of equipment is defined as the loss of its ability to perform its specified function. This definition is not very precise, it assumes both the total loss of the transformer, e.g. due to a serious internal flashover, as well as the failure of a peripheral auxiliary unit, such as a pump, which results only in temporarily interrupted or restricted operation. For the remarks below, “fault” is interpreted as a state that interrupts or endangers trouble-free operation.
4.1.3
CLASSIFICATION OF FAILURES
Two different types must be differentiated here: Type 1: gradually developing failure Type 2: suddenly occurring failure Type 1 is characterized by a steady rise in one or more characteristic in service parameters beyond the limit value that guarantees reliable operation, e.g. by continuous increase of decomposition gases dissolved in the oil excessive rise in oil temperature local discolorations of the tank paintwork accelerated aging of the oil remarkable change in the sound and/or vibration behavior
239
If the monitoring systems are signaling an incipient failure, but do not automatically trigger a shutdown, failure analysis serves primarily to assess the hazard potential if the transformer is kept in operation and to initiate scheduled precautionary measures. In such cases diagnostic procedures are prioritized in the analysis. This includes using monitoring systems for online checking, in order to gain time to make the requisite preparations for healing the defect. Type 2 covers all cases of unplanned interruptions in operation caused by the tripping of a protective device, e.g. by Buchholz relay differential protection relay overcurrent protection relay overload protection pressure-relief relay In these cases, fault investigation and analysis serve to restore serviceability, and will most times lead to major interventions in the defective unit, which may ultimately result in repair and replacement. The measures to be initiated may be extensive, including not only analysis of the failure cause but also the decision whether the necessary repair can be performed on site and what preconditions must be met for this purpose. Likewise, whether the transformer must be replaced immediately in order to assure reliability of supply, and what spare units are available. In the worst case, a decision will need to be made on whether to repair the defective transformer in the manufacturer’s facility or in an appropriately equipped workshop, or to scrap it.
4.1.4
GENERAL INFORMATION ON MALFUNCTIONS AND FAILURES
Generally accessible information on the nature and frequency of transformer failures in operation are unfortunately scarce and incomplete. Not every transformer owner (power utilities, network and system operators) is prepared to publish fault histories and failure rates for various reasons. There are no binding standardized definitions for which events are characterized as failures. Some companies hesitate to publish failure figures which might damage their image. Failure statistics permit conclusions to be drawn on corporate strategies and business philosophies that should not really be disclosed to competitors. Generally the owners of transformers do in fact keep internal failure statistics. The actual data and figures from different operators, however, are often not comparable. This is due not only to the reasons outlined above, but also to the technical status, the differing grid conditions, procurement practices, maintenance and operating philosophies, climatic conditions and in some cases political conditions. The consequence of breakdowns of the supply system must be evaluated very differently. They depend on the technical status and social structure of the supply territories concerned. The industrialized countries depend to a far greater extent on a
240
reliable power supply than do countries and societies with a comparatively low technical status in terms of energy utilization.
4.1.5
SYSTEMATIC FAILURE ANALYSIS
The investigation of transformer malfunctions and failures is in many aspects comparable to the detective work required for solving crimes. Both tasks necessitate the same sequence of steps and activities as listed in Table 4-1: Table 4-1 - Comparison between crime investigation and transformer trouble-shooting
Activity
Crime
Transformer failure
Collecting data and background information Investigation
on the persons involved
on the equipment involved
of the circumstances
Diagnosis
Autopsy of the victim
Evaluation of all available information and analytical results for assessment of
the guilty party
of the failure-related circumstances, operating data Diagnostic measurements, inspection and dismantling of the transformer the cause of the failure and the action required
For analyzing and clarifying transformer malfunctions and faults, a systematic procedural approach is recommended, using the following steps and actions: Collecting information on the equipment concerned Reconstructing the failure history and the operating conditions at the time of the malfunction/failure inception Assessment of the status and extent of the damage on site and performing measurements and diagnostic routines, if necessary including inspection of the core-and-coil assembly After clarifying the cause of the malfunction, decision on whether to keep the transformer in operation or to perform additional investigations Dismantling the transformer in a suitable workshop to clarify the cause of the fault Analyzing all data, measurements and observations for definitive fault clarification and a decision on repair, reworking or redesign. The first four steps are common to the two failure categories mentioned above. Further investigations will depend on the decision to continue operation or to perform a repair job. Possibly, the investigations might be identical in both cases. Performing special measurements and tests may assist in clarifying the failure cause and help in estimating the repair work required. The same diagnostic measures can, however, also be used to assess the condition of the transformer as well as to assure its further serviceability. In
241
every case, the cause of the failure has to be clarified, in order to make the right decisions. The sections below deal with the individual steps involved, and their significance for systematic trouble-shooting. 4.1.5.1 COLLECTING INFORMATION ON THE UNIT CONCERNED
Every fault analysis is based on data and information on the defective unit and its operating environment, which - if interpreted correctly - will form the basis for all further decisions. The more complete this information, the easier it will be to reconstruct the failure history, to determine the fault location and extent, and to make correct decisions on further action. The most important information and data are listed below, and their importance for fault analysis and their impact on the decisions is described. Data for identifying the object involved Unambiguous identification requires the following data: Type Rating Voltage Ratio Connection scheme Frequency Serial number Year of manufacture and location Manufacturer Rating data Type designation, rating definition and overload conditions will reveal the type the unit (1-phase/3-phase) and whether it is being used as a common transformer in the grid or as special transformer. This will enable initial conclusions to be drawn on how the unit has been operated. Special transformers, for example, are often subjected to intermittent stresses and high operating temperatures. Generator step-up transformers are mostly exposed to higher thermal stresses than transmission transformers, which often are loaded less than 50 %, depending on the operating philosophy involved. Year of Manufacture and Location The year of manufacture is of important for drawing conclusions about the technical state of the art and the materials used in manufacturing the transformer. It is also an initial rough indicator for the aging status of the insulation system. The location may also be a significant information, since it can provide information of the specific network configuration and the local geographical (altitude, accessibility) and climatic conditions on site.
242
Connection Connection scheme, winding configuration and ratio are important data for localizing the fault in the transformer, and also for planning and conducting measurements within the context of fault diagnostics. These data provide references to the dielectric stresses inside the transformer. Test reports The results of factory tests and information on faults during manufacture and testing can provide indications of prospective causes of faults, and therefore are of importance for fault analysis. They are also useful for comparison with measurements obtained during on-site failure investigation. Maintenance reports Reports on routine maintenance work, oil analyses, oil changes, gas-in-oil analyses, etc. provide valuable hints to the transformer aging status and to any irregularities in operation. Gas analyses before and after the failure inception, in particular, often permit conclusions on the nature and cause of the fault concerned. Their interpretation is dealt with elsewhere in this book. Manufacturer The name of the manufacturer can supply pointers to the type of design (core type / shell type) and possibly to the technical competence and quality standard of the manufacturer. 4.1.5.2
DATA AND INFORMATION AT THE TIME OF FAULT INCEPTION
Systematic failure analysis begins with collecting all available information on the failure event, service conditions and the responses of the installed protective and monitoring devices. Time of failure occurrence The time of failure occurrence is of particularly major importance, because it allows the vital temporal correlation between the failure event and concurrent disturbances in the network at the same time, for example, short-circuits, overvoltage events, overload and dynamic loads, switching operations, defects in other pieces of equipment, protective trips, triggering of surge arresters, plus environmental and weather conditions (thunderstorms, sudden changes in air pressure, seismic disturbances). Protective devices Records of protective messages and trips are indispensable for failure assessment. They can provide information on the temporal progress of the failure, on the fault’s location, and on the size of the stresses occurring. They must contain the technical data of the protective units, their settings and their response characteristics. The first priority is to check the functions of the Buchholz protective relays and overpressure protective devices (sudden-pressure relays, on-load tap-changer protection). If the Buchholz relay is tripped, care must be taken to ascertain whether this 243
represents merely a warning to indicate that air or gas has gradually collected inside the relay (signaling an irregularity in the transformer) or an incipient fault. In this case, the analysis for flammability of the collected gas will decide what further action to take. A Buchholz trip, by contrast, triggered by a sudden increase of the oil pressure inside the transformer tank, almost always indicates an internal fault. Rare cases have, however, been experienced in which suddenly released trapped air bubbles or winding movements triggered by external short-circuits or seismic events have caused protective trips without the transformer having suffered any internal damage. Overcurrent and differential protective devices indicate faults inside the transformer where windings or winding sections are affected and the ampere-turns equilibrium is disturbed compared to the normal service condition. Information concerning response times and response thresholds are useful to estimate the level of the stresses occurring. Surge arresters Surge arresters likewise supply important information for fault investigations. Surge counters, if fitted, provide information on the number of overvoltage stresses exceeding the protection level, and on pre-stress of the individual phases. Since surge arresters exhibit only a limited capacity to extinguish lightning or switching surges, the damage of arresters permits conclusions on the severity/duration of the stress involved or on repeated surges. Temperature indicators Data concerning the load on the unit before the failure plus the measured values of the oil and winding temperatures provide information on the thermal status in the defective unit and the efficiency of the cooling system. This data is very useful for the investigation of failures caused by thermal problems. On-load tap-changers Information on on-load tap-changer position and operations provide important hints on the fault occurrence and on the fault localization. Fault statistics show that a substantial proportion of all transformer failures are attributable to faults in the on-load tap-changer or malfunctions of the changer or of the drive mechanism. Therefore the question of whether on-load tap-changer was operated at the time of failure occurrence is of major importance. Fault-recorder Abnormal events in the network are frequent causes of failures. For this reason, information on short-circuits, overvoltage events like lightning strikes, switching operations and overloads rank among the most important data. This information should be as comprehensive as possible, and provide data on the time, location, duration of the event and amplitudes of current and voltage in the phases involved. Mal-operations, like asynchronous switching or switching in phase opposition, may cause transformer failures. The most valuable information is provided by fault-recorder data. Careful analysis of these recordings is able to reconstruct the chronological history of the failure, its duration and the location/extent of damage of the unit.
244
Verbal information Another important source of information are logbooks and manual records of the station personnel on special events and observations. Interviewing employees can reveal information on accompanying circumstances and on events in the past that were not recorded in measurements or written files because their importance for the ongoing fault was overlooked or not properly realized. Further information relevant to faults includes: earlier failure events relocations and transports; if available: acceleration values most recent work on the network or most recent maintenance work performed at the transformer before the failure event previous repair jobs faults at comparable transformers from the same manufacturer Gas-in-oil analyses results Gas-in-oil analyses after and in comparison with corresponding analyses before fault inception rank among the most important data available for assessing the damage and deciding on further action. The composition and ratio of the characteristic decomposition gases are the most important indicators for the nature and severity of an internal fault and are thus indispensable for fault diagnostics. In the case that the transformer has not yet failed, but there is a suspicion of an incipient fault, the assessment of decomposition gases in the oil is actually the crucial key to all further decisions. (In Case Study 3 – Buchholz trip. Most probably the evaluation of the gas content would have avoided the subsequent total damage). Because of its paramount importance as a diagnostic tool, gas-in-oil analysis is dealt with more comprehensively in Section 4.1.6.2.1. Information on the oil type, ageing status and on oil-related work like refilling, purification and degassing, drying processes, vacuum treatment, etc. are of additional importance, e.g. when the gas-in-oil analysis indicates partial discharges inside the transformer. Conducting and interpreting gas analyses has for many years been a standard tool for condition monitoring and fault analysis, and has been adequately described in numerous publications. The recommended procedures and equipment for sampling, laboratory analysis and evaluation of the results are specified in the relevant standards, e.g. IEC 60567, IEC 50599 and IEEE C57.104.
245
Evaluation of all the above mentioned information will normally allow drawing reliable conclusions on the nature of the fault and in many cases also estimate the extent and location. 4.1.5.3
DECIDING ON CONTINUED OPERATION OR ADDITIONAL INVESTIGATIONS
A transformer malfunction is indicated either by the automatic activation of protective devices that cause a trip of the unit or by a warning that does not lead immediately to a breaker operation. In both cases, the question arises as to whether it is permissible to switch on the transformer again and to continue operation or if the conditions categorically prohibit continued operation. In order to take an appropriate and correct decision, further detailed information is required. The first step is to check which protection systems have responded and in what sequence. In many cases, it is possible to conclude from the answer to this question whether an internal fault is involved. The protection and monitoring systems of the transformer itself are limited to the Buchholz relay, the temperature monitoring device for the oil and for the windings, the on-load tap-changer protection (if an on-load tapchanger is fitted), and in some cases explosion protection devices. In addition the transformer is protected by the following external protection equipment: differential relay, overcurrent protection relay and overvoltage protection/surge arresters designed for direct protection of the transformer. For an initial evaluation, the most important step is to control the Buchholz relay. Irrespective of whether a warning or a trip has been indicated, the gas that has collected in the Buchholz relay should be examined immediately for flammability and its composition. The flammability can be very easily checked by flaring the gas from the Buchholz relay. This will provide a first indication if there is any internal damage. If there is only plain air found in the relay and if there are no other indicators for any damage to the transformer, the unit can be approved for further operation. In the case of transformers with open breathing systems, it is known that sudden fluctuations in air pressure due to atmospheric disturbances, e.g. sudden drops in temperature before thunderstorms, may lead to the release of air dissolved in the oil, thus simulating a defect by triggering a Buchholz warning. If, for example, under comparable weather conditions other transformers in the vicinity are known to exhibit Buchholz alarms, and no flammable gases are detected, it can be concluded with a high degree of probability that there is no transformer fault involved. In any case, to be on the safe side, gases from the Buchholz relay should always be analyzed in the laboratory whenever there is a Buchholz alarm. In the event of a Buchholz trip, and if flammability is detected, both the Buchholz gas and the gases dissolved in the oil must always be analyzed. The results of these gas analyses provide unambiguous indications whether any internal damage is developing or has already occurred, and what kind of damage it is. The evaluation and assessment criteria are known, and laid out in the relevant standards and are also referred to in a large number of publications, e.g. [125],[126],[127].
246
The tripping function of the Buchholz relay is released by a sudden oil flush in the Buchholz pipe. Sudden movements of the winding due to short-circuit or seismic events may be the cause of a trip. It is therefore essential to check whether events of this kind have been recorded at the same time. If there is no internal electrical fault involved, the gas analysis will not indicate any damage. The question then arises whether windings have suffered permanent deformation that signifies a future risk of damage. To answer this question further investigations and measurements are necessary, which are described in the chapter on measuring and diagnostic procedures. In any case the decision to reenergize a transformer after a trip requires careful consideration of all available information based on profound transformer knowledge and experience. Even if the decision is to continue operating the transformer the condition of the unit should be carefully documented. This includes: instant of the failure message including date and time instant load measured temperature values for oil and where appropriate for windings tap-changer position all other measurement and diagnostic data available. If a gradually developing fault is suspected or has been detected, but an immediate shutdown is not absolutely necessary or for reasons of supply dependability would be irresponsible, this data can be very useful for properly planning further action. In any case, a transformer inspection should be performed on site, to detect any damage and changes visible from outside, such as deformations, oil spill, discolorations, etc., which can indicate faults and their causes. 4.1.5.4
ASSESSMENT OF THE EXTENT OF DAMAGE ON SITE
If after a fault the decision is to not re-energize the transformer, but to initiate investigations, a distinction must be made between two different situations: In the first case the transformer has a fault, but it is still serviceable, though perhaps under restricted operation. Reasons for keeping it in operation may be energy bottlenecks, lack of spares or the requisite lead time for a transformer replacement and/or a repair job. In this case, the owner has to estimate the risk of a total failure. This requires the need to know the nature of the fault involved. Therefore the decision to opt for monitored continued operation has to be preceded by an accurate check of the serviceability of the transformer, including all the routine measurements.
247
There are situations where transformers regularly showed gas evolution indicating an unambiguously developing internal fault, caused by thermal overloading or partial discharges. In such cases it is essential to monitor the gas generation rate by frequent oil sampling or via a gas monitor. Likewise, following severe or frequent short-circuits, mechanical problems may be indicated by a change in the audible noise and vibration behavior or by alterations in short-circuit reactance. Then it is useful to conduct FRA (Frequency Response Analysis) measurements to detect mechanical changes and to initiate precautionary measures for a critical case. In the past decade, modern methods have been developed for measuring and locating partial discharges, also for use on site. They constitute an indispensable tool for diagnosing incipient faults and tracking their development (see also Case Study 1, chap. 4.1.8.1). In the second case, the transformer is no longer operable by reason of an obvious damage. Then further investigations on site will clarify whether a repair job can be carried out on site and what measures must be initiated to restore serviceability as soon as possible. Irrespective of the action to be initiated, unambiguous clarification of the failure cause is always essential in order to correct design defects in case of a repair job and to take appropriate precautions against faults in comparable transformers. 4.1.5.5 ASSESSMENT OF EXTERNAL DAMAGE ON SITE
As a first step, the external condition must be checked for abnormal changes. Particular attention must be paid to: damage to bushings and arresters cracks, deformations and discolorations of the tank external traces of flashover traces of fire oil level and oil leaks failure of auxiliary equipment like fans, pumps, cooling units trips of protective devices, e.g. pressure-relief devices maximum readings of the temperature monitoring instruments damage to other units or system components All observations should be accurately recorded and wherever possible documented by pictures. This documentation is of crucial importance both for definitive assessment of the fault and its cause, and for specifying the repair and remedial actions as well as for legal and insurance-related assessments. Defective components must be kept safe, to ensure they are available to experts or insurers, or to enable material analyses to be performed as necessary for further clarification.
248
When entering the unit on site, all specified safety regulations must be complied with; the transformer bay must be de-energized and visibly grounded. 4.1.6
DIAGNOSTIC MEASUREMENTS AND THEIR INTERPRETATION [128][129][130] [131] The second important step, essential in both fault cases, concerns diagnostic tests that can provide indications of the internal status and operational capability of the transformer. The most important conventional measurements are: gas-in-oil analysis breakdown voltage of the oil and further laboratory examinations to indicate the condition of the oil insulation resistances and tan of the windings transformer ratio winding resistances short-circuit impedance excitation at low voltage If there is a suspicion of partial discharges, PD detection and localization measurements should be made. These tests, of course, can be conducted only if the transformer still is serviceable and able to be excited at least up to the rated voltage. To check for winding displacements and deformations an FRA measurement is recommended. FRA allows recording the transfer function of the windings in the frequency range of line frequency up to approx. 2 MHz, and comparing the result with a reference characteristic. If there is a suspicion of increased moisture content, it may be advisable to measure the polarization spectrum using the DFR (Dielectric Frequency Response) method or comparable methods. The appropriate modeling tools should be used to estimate the average moisture content in the transformer insulation. If such a model is not readily available a comparison with reference spectra from previous measurements will at least enable a trend to be discerned. The results of diagnostic measurements must be compared with previous measurements taken in the factory or on site (fingerprints). Any deviation may allow important conclusions to be drawn regarding the internal conditions and further serviceability of the unit, so that correct decisions can be made. The following list of diagnostic measurements and procedures makes no claim to completeness. It can offer merely a rough survey of the recommended procedures, the limits of their application and their possible contribution to fault clarification. Conducting routine measurements does not require any specialized knowledge. Frequently the measuring equipment available on site is simple and not as sophisticated as in a well equipped modern test field. Nevertheless most of the routine tests listed below can be performed using standard equipment and procedures. For more information see section 249
3.1 to 3.3. The application of more complex diagnostic procedures and the interpretation of their results should, however, be left to appropriately qualified experts. 4.1.6.1 ROUTINE MEASUREMENTS ON SITE 4.1.6.1.1
Oil analysis
The breakdown voltage of the oil, measured in accordance with the relevant standards, e.g. IEC 60156, can, when compared to previous reference values, provide a hint to increased moisture content and particles. In particular, soot and carbonized cellulose particles may indicate an internal flashover. Further investigations into the oil condition must be carried out according to the standards by an appropriately qualified laboratory (see section 3.2.1). 4.1.6.1.2
Insulation resistance and tan
A low insulation resistance between the winding systems may indicate massive damage to the main insulation. The same applies for the insulation resistance between windings to ground. In conjunction with an increased tan , this may be a pointer to increased moisture content in the insulation or carbon tracking in the insulation. The insulation resistances between winding systems or against ground are measured on site using a mega-ohm instrument with an integrated DC voltage source. For measuring tan in conformity with IEC 60076-1 or for the North American region, in accordance with IEEE Std. C57.12.90 (see section 3.2.6).
TT = test object MO = mega-ohm meter Figure 4-2 : Circuit diagram for measuring the insulation resistance 4.1.6.1.3
Measurement of transformer ratio
Deviations from the transformer ratio measured in the factory indicate undoubtedly a short-circuit or a conductor break in winding sections, and thus a fault that cannot be cured without repairing the winding concerned. The measurements must be taken in a no-load circuit with low excitation by directly measuring the voltages at the terminals of the primary and secondary windings. When 250
interpreting the results, the connection diagram and the vector group of the voltages must be taken into account. In the case of complicated circuits, e.g. special transformers with phase-shifting windings, this measurement routine should be carried out by experienced testing personnel.
Figure 4-3: Circuit for measuring the transformer ratio using the voltmeter method 4.1.6.1.4
Measurement of winding resistances
This measurement routine should be performed phase by phase. It can also be used to detect open circuits or short-circuits in windings. In addition the fault can be localized in a discrete winding. Here, too, a comparison with the factory test report can be particularly helpful. For measuring the resistance, a constant DC source with >20 A is required. If this is not available, a powerful battery can also be used. The voltage should be measured (particularly in the case of small resistances of high-current windings) via separate cables for current and voltage measurement connected directly at the terminals, to eliminate the influence of the external connections. For converting the results to the reference value at 75/85° C, the temperature of the unit during the measuring routine must be checked. In most cases, the windings, by reason of their small time constant, will have cooled down sufficiently by the time the measurements are taken, so that the mean oil temperature displayed can be used as the reference value.
Rx = unknown winding resistance Rd = adjustment resistor S = switch with protective spark gap B = DC voltage source Figure 4-4: Circuit for measuring the winding resistance 4.1.6.1.5
Measurement of short-circuit impedance
Deviations between measured short-circuit impedances and the reference values indicate changes in the effective number of turns, e.g. caused by short-circuits in a 251
winding or winding section. Moreover the test result may provide indications for localizing the fault if each phase is being measured separately. Minor deviations may indicate deformations without shorts in the windings. To perform the measurements, a line-frequency adjustable low-voltage source must be available, which supplies the HVwinding with the LV-winding short-circuited.
TT = test object K = short-circuit link CT = current transformer VT = voltage transformer Figure 4-5: Circuit for measuring the reactance 4.1.6.1.6
Excitation at low voltage
Excitation of the transformer by feeding the HV-winding with open LV-winding at low voltage (a few 100 V) provides the most reliable indicator of internal short-circuits if the current measured (no-load current) rises inappropriately in a short-circuit-like pattern. As under 4.1.6.1.5, a line-frequency adjustable voltage source is required. The connection is the same as for the no-load measurements, in 1- or 3-phase form, depending on the type of transformer involved. For a comparison with the factory measurement, the current measured can be linearly extrapolated to the rated voltage. 4.1.6.2 SPECIAL DIAGNOSTIC MEASUREMENTS 4.1.6.2.1
Gas-in-oil analysis
During operation the oil is submitted to aging. In this process, which is closely dependent on temperature, light hydrocarbons (CNHM) and carbon oxides (CO, CO2) are split off from the complex oil molecules. Since most internal faults go hand in hand with a significant (mostly local) rise in temperature (in the case of electrical discharges to well over 1000°C), this will result in a substantial change of the steady slow increase of the decomposition gases created by the normal aging process. Specific ratios between individual gas components are related to characteristic fault scenarios. The relevant standards provide statements on the spectrum of decomposition gases, caused by normal aging, and on the spectra typical for different temperature ranges and fault categories. Gas-in-oil analyses thus constitute an excellent, empirically validated tool for early detection and investigation of faults in a transformer. Sampling and spectroscopic analysis of the oil in order to determine the content of harmful gases should be performed by appropriately qualified specialists from a recognized oil laboratory in
252
conformity with the relevant standards, e.g. IEC 60567. The interpretation should be done by experts in accordance with IEC 60599. For rough fault classification, the following guideline applies: Acetylene (C2H2) is an indicator for high temperatures (700 to >1000°C), e.g. hot spots on metallic surfaces and high-current discharges (arcing). Typical hot spots are caused by: loose connections of current conducting conductors circulating currents caused by stray-fields in construction components or in parts of the tank loops in the earthing system of the core-and-coil assembly increased resistance of breaker or tap selector contacts defective insulation of core lamination (core burning) short-circuits between parallel conductors or “cold” soldering joints of cable and bus-duct connections While all other gas components are also created during the normal aging process, acetylene, even in small quantities, will almost always indicate a fault. This does not apply to transformers with on-load tap-changer without complete separation of the expansion tanks for tank and breaker, where switching gases, which always exhibit a high content of acetylene, may pass over into the main tank oil. The same applies in the case of a leaking diverter switch compartment. Carbon monoxide (CO) and carbon dioxide (CO2) are produced by thermal aging of cellulose. Abnormally high portions of these gases indicate increased thermal decomposition of solid insulation, either from local overheating of adjoining metallic surfaces or as a consequence of high-current discharges burning the isolation. Hydrogen (H2) as a dominant component indicates the presence of partial discharges. For a more precise analysis, further higher-molecular components of the decomposition gases (CH4, C2H6, C3H8) and their quotients must be incorporated in the assessment procedure. For the evaluation, standardized evaluation schemes and criteria are available, e.g. the quotient criterion as defined by Rogers, Duval’s triangle, or the IEC criterion (see [125]). IEC Standard 60 599 contains typical values for the gas contents and increase rates in normally aging transformers, which may serve for purposes of comparison if no comparative values from previous analyses are available. These evaluations permit more accurate conclusions to be drawn on the nature of the fault concerned and the temperature range involved.
253
Another important criterion are the increase rates for the individual gas components; particularly when a decision has to be taken on how long a faulty transformer can safely continue in operation until the requisite corrective action can be initiated. In such a case the installation of a gas monitoring system for permanent on-line control of the development of gas is useful and recommended. There are numerous publications available dealing with gas-in-oil analysis, which are useful for more comprehensive information, e.g. [132] [133] [134][135]. Table 4-2 - Interpretation of gas-in-oil analyses in accordance with IEC 60599 IEC Code
Fault type
C2H2/C2H4
CH4/H
C2H4/C2H6
PD
Partial-discharges
ns
<0.1
<<0.2
D1
Low-energy discharges
>1
0.1 – 0.5
>1
D2
High-energy discharges
0.6 – 2.5
0.1 – 1
>2
T1
Thermal fault T = <300°C
ns
>1
<1
T2
Thermal fault 300°C < T <700°C
<0.1
<1
1–4
T3
Thermal fault T > 700 °C
<0.21)
>1
>4
1)
higher values of C2H2 indicate temperatures of >1000°C
ns = not significant 4.1.6.2.2
Measurement of partial discharges
In addition to gas-in-oil analysis, PD measurement has become acknowledged as the most meaningful diagnostic procedure for detecting and locating electrical faults inside transformers that have not yet suffered a total failure. For conducting and evaluating PD measurements on new transformers, there are binding standards, e.g. IEC 60 076-1, IEEE C57.12.00, IEEE C57.12.90, but these do not cover the possibilities opened up by the modern diagnostic methods. In the past 20 years, procedures have been developed that even under on-site conditions lead to unambiguous fault detection and in many cases to localization of the fault concerned. Compared with PD measurement in the (shielded) test bay, however, special precautions must be taken in order to eliminate the influence of external disturbance factors. PD measurements are helpful only if the transformer concerned is still operational, i.e. can be excited from the grid or by a separate power source up to at least rated voltage. If an appropriate high-voltage source is available, then the measurements can also be performed with applied voltage. Well-equipped service companies meanwhile provide adequate transportable power sources and measuring equipment.
254
The measurements permit conclusions to be drawn on the type of discharge involved, and by means of propagation time analyses to a certain degree on the location of the PD source (see Case Study 1, chap. 4.1.8.1). Measurement of the electrical PD pulses can be supplemented by acoustic methods, especially to localize the source of the discharge. PD measurement on site requires special measuring equipment and skills, and should always be performed by experienced specialists. The results should always be interpreted in collaboration with transformer experts, thoroughly familiar with the internal construction and the design details of the individual unit under test. For more information, see section 3.3.4. 4.1.6.2.3
FRA method
Since the transformer winding system constitutes an oscillating system, comprising ohmic resistances, reactances and capacitances, each winding has its own typical frequency response, characterized by the quotient of the input voltage and the voltage measured at the output. If, due to geometrical changes in the windings or by shortcircuit of winding sections, the reactance changes, then the frequency spectrum will also change in a characteristic manner. For that reason deviations from the reference spectrum of previous measurements are reliable indicators of winding deformations. The measuring circuit reacts very sensitively to external disturbances and interference. In the frequency range from approx. 1 kHz to 1.5 MHz, however, reproducible and meaningful results can be expected, if standardized measuring equipment and measuring conditions are used [137]. Because of the extreme sensitivity, it is not easy to interpret the results, particularly if the deviations from the reference spectra obtained in previous measurements are small. At present, this measuring procedure cannot supply unambiguous statements regarding the nature, the extent and the position of the geometrical changes in the windings and regarding the degree of risk to the transformer. If no references are on file, a comparison with the spectra of the other phases or with measurements taken from transformers of identical design and construction may prove helpful [136],[137]. In conjunction with further measurements, e.g. the change in reactance or in the audible noise behavior, an experienced expert may, however, be able to draw conclusions on the operational risk involved. For the assessment of the type of fault, the CIGRE Study Committee A2 – Power Transformers has listed spectra for various fault and deformation types [136]. For more detailed information on the application of FRA, see section Error! Reference source not found..
255
4.1.6.2.4
Measurement of polarization effects for assessing the moisture
The determination of moisture content in the oil-paper dielectric inside the transformer constitutes a difficult problem. For measuring the water dissolved in the oil, the KarlFischer method is a well recognized procedure, but the results are not suitable to draw conclusions on the moisture content in the cellulose, since there are many parameters involved in determining the distribution of moisture between the oil and the solid insulation. In recent years, various approaches have been pursued to use polarization effects for determining the moisture content. The recovery voltage method (RVM), in which the recovery voltage is measured during pulsed stress of the insulation system with DC voltage, thus determining a polarization spectrum, has proved to be ambiguous, since it does not take due account of the individual, inhomogeneous configuration of the insulation system. Therefore the procedure cannot be recommended. [138], [139]. Recent development of procedures for measuring the polarization current in the time and frequency domains promises better success. The method of polarization and depolarization current measurement DPC [140], [141] operates in the time domain, while frequency domain spectroscopy (FDS) measures in a broad frequency domain of several kHz. For these procedures, the CIGRE WG D1.01.14 has developed an interpretation scheme that in conjunction with the appropriate software enables statements to be arrived at on the aging status and the water content. Some of the above mentioned methods are still under development and the interpretation of the results is best left to experts. 4.1.6.3 INSPECTION OF CORE-AND-COIL ASSEMBLY ON SITE
To make a decision whether a repair job is possible on site, or perhaps even without moving the transformer at all, opening the transformer on site and getting inside to inspect the core-and-coil assembly may be necessary. The aim of this inspection is to determine and document the extent of the damage. If possible, any simple repair work required can be performed inside the tank. 4.1.6.3.1
General preconditions
Depending on the suspected location of the damage, the first step to take is to lower the oil level before bushing domes or inspection flanges can be opened to enter the tank. Depending on the weather conditions, a cover should be provided, so that no moisture (rain) or foreign parts and dirt can get inside the transformer. Whenever the work is interrupted, the openings must be closed, at least provisionally. If no suitable enclosed space (power house, assembly hall) is available for the inspection and if the repair work takes several days or weeks, it may be necessary to erect a permanent tent and to ensure a slight overpressure of dry air inside the tent.
256
4.1.6.3.2
Safety precautions
Inspection of a transformer, especially entering it, is not without potential danger for health. For this reason in addition to the common safety regulations for high-voltage systems (see chapter 10), some safety measures specific for transformer internal inspection should be taken. Ladders have to be safeguarded; work platforms must be fitted with a rail to prevent falls. In order not to get lost, all tools, lamps, measuring instruments, cameras being used inside the transformer must be securely attached outside or to the wrist or belt of the person who is performing the inspection or repair work. If the inspector wears glasses, they must also be safeguarded against loss! Before going inside the transformer, its interior must always be ventilated with fresh air, so as to expel the oil vapor and to ensure an adequate supply of fresh air for breathing. The person entering the transformer should wear a safety belt and when entering be secured with a rope by at least a second person positioned at the entry point, so that he/she can be rapidly rescued in the event of an injury or a sudden attack of nausea. The working clothes of the inspector - an oil-proof overall is recommended, one that also covers the shoes - has to be clean, so as not to bring any contaminants into the transformer; all pockets must be emptied. The inspector should be comprehensively informed about his/her task and the risks involved, and should study drawings in order to have a clear idea of the accessibility, the construction of the core-and-coil assembly, the wiring and cabling and significant design elements before he/she begins the examinations. 4.1.6.3.3
Checks to be conducted
In most fault cases, the advance information and the investigations and diagnostic routines beforehand will already have provided indicators to the nature and at times the location of the fault concerned. Depending on the type of fault involved, different characteristic damage patterns can accordingly be expected. In the event of internal flashovers and partial discharges, the traces of these flashovers or partial discharges must be investigated at the parts involved, and their progress tracked. It is of particular interest to find out the position of the roots, and in the case of PD defects the nature of the typical discharge patterns that may provide hints to the direction of the discharge. In the case of bushing faults, it is particularly the connections between winding and bushing that need to be examined. Loose screwed connections and faulty potential connections of electrostatic shielding devices are frequent causes of bushing faults. In the case of short-circuit defects, it is necessary to check whether windings and busducts are deformed, shifted or broken, whether the clamping structure is damaged, whether perhaps the yoke has been displaced. Often, a short-circuit has finally resulted in an internal flashover, so that in addition to mechanical damage, flashover traces, copper pearls, burned paper or pressboard and soot deposits can be found.
257
In the case of faults in and around the breaker, the breaker components located inside the transformer and the connections to the regulating winding must be examined for mechanical damage and shifts and traces of flashovers. The contacts of the tap selector must be examined for burn marks and arcing roots. Screw connections and terminals must be checked. Carbonized-oil formation on contacts, which have not been moved for long time, must be noted. If possible, the core earthing connections must be checked. The core and the core clamping parts should be examined for deformations, shifts and discolorations of the core laminations and the core insulation. They are indicators of excessive mechanical stresses or core burning. More generally, all irregularities, such as discolorations (pointers to overheating), loose or detached parts, contamination, incipient rusting at the core, tank or design components and all detectable deviations from the as-new condition, have to be recorded. All findings must be recorded and documented in writing and if possible illustrated by pictures with all details of their nature and location. Flashover paths should be documented in the relevant drawings or recorded in sketches. Defective parts must be secured and kept safe as evidence and for material analysis to be performed later on if necessary. 4.1.6.4 DISMANTLING THE DEFECTIVE TRANSFORMER
If the investigations on site reveal that the defective transformer has to be removed for repairs, the fault location must be completely exposed, to identify the cause of the fault. Dismantling of the transformer permits a more detailed examination of all windings and the core and all parts, particularly the interior windings, which are difficult or impossible to access during an on-site inspection. 4.1.6.4.1
Preconditions
For removing and dismantling the core-and-coil assembly, suitable premises and equipment must be available. Generally this work plus the actual repair job will be carried out in a transformer factory, preferably the manufacturer’s plant, where all the requisite documents, equipment and qualified personnel are available. In order to save transportation cost and time, however, more recently transformer manufacturers are offering to carry out comprehensive repair jobs on site, and to arrange the requisite conditions (see section 7.9). If some components, particularly windings, must be replaced by new ones, these can be manufactured in the factory, to be installed on site. The packing for transportation must be designed to prohibit the ingress of moisture during the journey. The following equipment must be provided: an enclosed, dust-free room, if possible air-conditioned, with humidity monitoring suitable, heavy-duty lifting equipment (e.g. mobile crane) special tools for removing and re-installing windings 258
clamping tools for clamping windings drying and oil-treatment equipment test equipment suitable storage facilities for removed parts that can be used again 4.1.6.4.2
Inspection
Removal and dismantling must be performed in steps, until the original fault location has been found. 1. 2. 3.
Lifting the core-and-coil assembly from the tank Removing the upper yoke (in the case of shell-type transformers if appropriate the entire core) Lifting the winding blocks and removing the individual windings
4.1.6.4.3
Inspection of the core-and-coil assembly after lifting out of the tank
Careful examination of the core-and-coil assembly concerns the electrical and mechanical condition of the insulation system between the phases, between the individual windings and the core and against the tank. Particular attention must be paid to traces of flashover and their arcing roots. Note that discharge figures on insulation surfaces may provide pointers to the point of origin and the direction of discharges. Damaged and detached parts must be examined to identify the type of damage involved, electrical and/or mechanical, and their position in relation to their original location of installation must be documented. The position and condition of the winding end insulation, clamping rings and clamping elements and the base plates provide indications of excessive mechanical stresses. The same applies for the position and deformation of bus-ducts and bus-duct supports. The compression of the windings must be checked and - if possible - the residual clamping force must be measured. Generally, attention must be paid to any discolorations, contamination, soot and sludge deposits, plus rusting on iron components like core laminations, core clamping parts, tank and conservator tank: Particles – metallic, but also non-metallic – may act as triggers for discharges that have initiated defects. Sludge deposits are an indicator of advanced oil aging due to high thermal continuous stress or poor oil quality Rusting indicates free water in the oil. In the case of transformers with a free breathing system, that are exposed to severe fluctuations in stress and temperature, for example in furnace transformers, free water was occasionally discovered at the bottom of the tank and rust on core laminations and iron components. 259
Since the on-load-tap changer is frequently involved in the fault history, it has to be carefully examined for any damage. Particular attention must be paid in this context to electric marks at the contacts and to flashover traces and soot or dirt deposits at the insulating components of the tap-changer and the tap selector. 4.1.6.4.4
Inspection of the windings
All windings must be examined for: mechanical deformations of the entire winding or individual winding sections; especially the type and position of the deformation must be documented electrical or mechanical damage to the winding insulation traces of discharges on adjoining insulation barriers thermal damage to conductor insulation flashover marks between windings, coils, part-windings dirt deposits due to the fault or during operation shifting or deformation of the winding ends deformed, shifted or missing spacers and strips spiral displacement of windings The nature and extent of the damage will often allow conclusions to be drawn on the cause of the fault, since typical fault patterns can be assigned to various fault categories. 4.1.6.5 TYPICAL FAULT PATTERNS OF WINDINGS 4.1.6.5.1
Short-circuit faults
Mechanical damage to windings is the result of short-circuits or repeated high shock loads. The typical types of mechanical damage are axial tilting (see Figure 4-6 ), radial buckling (see Figure 4-7) and spiral shifting of the conductors (typical multi-layer and spiral windings).
normal
tilted
Figure 4-6: Typical deformation of the conductors of a coil winding under axial overload (tilting)
260
Figure 4-7: Radial deformation of an interior coil winding (buckling)
In the case of external short-circuits, the damage may be limited to deformations without any consequential electrical damage. These faults do not inevitably result in a failure of the transformer. Without removing the windings they can be detected only by diagnostic measurements (reactance, FRA). Internal short-circuits always involve high-current discharges that in addition to mechanical damage lead to destruction and carbonization of insulation sections. 4.1.6.5.2
Electrical flashover
Electrical flashovers between windings or coils in most cases can be traced back to high-frequency overvoltages (lightning impulse voltages, resonances). The typical fault pattern often shows only slight damage to the insulation with meager soot formation and carbonization of the surrounding insulation sections. The electric marks on the conductors involved are often merely the size of a pinhead (see Figure 4-19, chap. 4.1.8.2). AC voltage defects in windings, by contrast, are characterized by severe current marks, even extending to melted conductors, and by extensive destruction and burns of the insulation and heavy soot deposits (see Figure 4-15, chap. 4.1.8.1). For the interpretation of the cause of the fault, it is important to document the precise position of the fault location in the winding, so that the anticipated local stresses can be calculated for fault analysis.
261
Flashoversover extensive insulation surfaces outside the windings, e.g. from the terminal of the bushing along the insulated HV bus-duct and parts of the main insulation against ground may indicate switching overvoltage stresses or static charge phenomena (static electrification) [142]. Flashover paths and discharge figures on insulation barriers of the insulation between windings allow considerations on the starting point and the direction in which the discharge has propagated (Figure 4-8).
Figure 4-8: Discharge figures on the surface of paper insulation
Discharge channels below the surface in the insulation material (wormholes) indicate moisture in the insulation, which has initiated partial discharges and finally resulted in a complete breakdown. Sometimes X-wax can be found in enclosed pockets in the solid insulation, e.g. between paper layers of extended insulating wraps of bus-ducts. This decomposition product of the oil is produced in the presence of moisture by long-time partial discharges of low strength. Due to the increase in tan , X-wax formation may lead to thermal instability of the compact insulation. Such kind of damage has quite often been observed in aged transformers of old design (see Figure 4-9). But also in modern pressboard, pockets can be created in the insulation structure if it is improperly dried. The presence of moisture in these pockets can lead to the generation of partial discharges.
262
Figure 4-9: X-wax in a paper insulation 4.1.6.5.3
Thermal faults
If there are indications of thermal overloading as evidenced by dark coloring of the conductor insulation, then the individual insulation layers must be examined to check whether the thermal degradation of the insulation has proceeded from inside out or in the opposite direction. In accordance with the temperature gradient in the transformer, the paper wrapping close to the conductor material will normally suffer higher thermal stress, and therefore will be more aged than the outside layers. In the case of insulated bus-ducts located close to hot points either of the core or of uninsulated metal components, the outer layers may also be discolored and more severely aged than their inner counterparts. Aged paper exhibits a dark discoloration and becomes brittle. Even without more sophisticated methods in the laboratory, a simple bending test on a strip of paper or pressboard can indicate reduced mechanical strength and by this confirm thermal degradation of the cellulose. 4.1.6.6 INSPECTION OF THE CORE AND THE TANK
Concerning the core the following checks are recommended: migration of core laminations out of their original position damage/deformation of core laminations spreading of joints at the corners of the core discoloration of the lamination indicating hot spots burnt spots and melting points of the lamination residual core clamping force of bandages or bolts position and deformation of the tie rods between upper and lower yoke discoloration/carbonization of the core insulation potential connections of the individual core packages and to ground position of the core and the mounting pads in the tank 263
The tank must be examined for deformations, cracks in welding seams and discoloration of the paint. Inside the tank, a careful inspection must be made for flashover and current marks caused by circulating currents in the tank. The mounting and where appropriate the insulation of stray-field shielding sections at the tank walls must be checked. Parts that come from the core-and-coil assembly but are lying on the bottom of the tank must be identified and their position documented. 4.1.7 FINAL ASSESSMENT OF THE FAILURE AND THE FAULT The compilation of all information, measurements and visual observations, plus, if necessary, special material analyses, constitutes the foundation for a thorough reconstruction of the failure history and the definitive analysis of the reason of the fault. Based on the result of the failure analysis a qualified decision on the action required for restoring operational capabilities of the system can be drawn. The quality and accuracy of the analysis are crucial to the time and money expended on the requisite remedial measures. When the final, definitive analysis is carried out, it is absolutely essential to check whether failure risks also apply for transformers of similar or identical design and construction. If so, the data from those transformers must be analyzed for signs of incipient faults. All information, all examinations performed and action initiated, plus the conclusions shall be documented in a final report. Chap. 4.1.8 provides three examples of failure analysis describing the procedures involved, the diagnostic methods utilized, and the final assessment for the cause of the fault, plus the decisions taken on remedial measures or repair work. This description of examples is restricted to merely the sequence of the essential steps, the findings and measurements obtained, and the conclusions drawn from them.
264
4.1.8
CASE STUDIES
4.1.8.1 CASE 1: EXAMINATION OF A TRANSFORMER AFFECTED BY PARTIAL DISCHARGES
Technical Data of the Transformer Type: Rating: Rated voltage: Frequency: Connection: Type of cooling: Year of manufacture:
Generator Step Up (GSU) Transformer 340 MVA 236 ± 11.5 % / 21 kV 50 Hz YN d5 OFWF 1977
History The transformer went into operation in 1977. Following the explosion of a wall bushing in the transformer box on the power plant site in 1991, the transformer was subjected to check measurements. This included a gas-in-oil analysis but it did not reveal any damage whatsoever in the unit. At the end of 1996, the unit was removed, and installed at a different location. In order to transport by rail, the oil level in the tank was lowered by approximately 320 mm. The removed oil was treated in a separate tank, and put back in the transformer via the expansion tank after the installation. The unit was put back in service in the middle of January 1997. In April 1997, the transformer was again returned to its original location and re-installed. The oil removed for before transporting the transformer was appropriately treated and pumped back into the transformer via the expansion tank. The transformer was then put back into operation. Immediately after being restarted, an oil sample was taken in order to check the treatment. The DGA revealed a significant increase in content of H2 and CH4. These gases continued rising steadily to approximately 800 ppm and 90 ppm respectively by April 1998.The increase was not regarded as alarming, and the cause was assumed to be due to incorrect refilling of the transformer with the residual oil after relocation. In order to eliminate all doubts, a decision was made to degas the oil on site using a repeated degassing procedure. Six months after this treatment, however, the abovementioned gas components increased again to 835 ppm and 70 ppm respectively. No significant increase in concentration was observed for the other gas components. Table 4-3 shows a history of gas concentrations in the transformer during this period.
265
Table 4-3 - Listing of the H2 and CH4 values Date 29.04.93 26.09.95 11.04.97 13.05.97 20.06.97 29.07.97 30.09.97 27.11.97 15.12.97 21.01.98 26.02.98 23.03.98 25.04.98 05.05.98 02.06.98 01.07.98 31.07.98 14.09.98 12.10.98 03.11.98
H2 [ppm] 25 >1000 338 344 536 372 762 662 612 732 675 793 52 316 466 579 701 770 835
CH4 [ppm] 5 4
Comment
Before 2nd relocation 49 49 57 54 73 63 73 78 70 88 7 19 28 37 47 50 70
After restart
After degassing
Diagnostic Measures on Site The interpretation of the analyses indicated continuous partial discharges and steadily progressing damage to the insulation system. To clarify the cause, diagnostic measurements were agreed upon and performed on site. The investigations were designed to clarify the following questions: What is the cause of the continuous gas production? What are the risks involved in continuing to operate the transformer? Can the transformer be refurbished on site or must it be sent back to the factory for repair? The measurements on site comprised PD measurements using the PRPDA procedure for characterizing and localizing partial discharges. For the PD measurements, the transformer was disconnected from the network, and excited on the LV side by the generator. Measurement of the polarization effects of the oil/paper insulation using the recovery voltage method (RVM), in order to assess the general condition of the insulation system. Measuring the frequency-dependent impedance (FRA method) for checking mechanical/geometrical changes in the windings.
266
Results of Diagnostic Measurements PD measurements: PD measurements were performed as multi-point measurements at all 6 terminals and at the neutral. The signals showed similar PD activity at rated voltage with apparent charges of >10,000 pC and >5,000 pC respectively in the HV windings of Phases V and W. The inception voltage was 34% and 52% of rated voltage respectively, whereas Phase U was initially PD-free up to rated voltage. A comparison of the time-resolved signals with those of the calibration showed that the PD sources were located not in the vicinity of the bushings, but inside the transformer insulation system in the exit area of the windings. The patterns recorded (see Figure 4-10 and Figure 4-11) indicated discharges without metallic electrodes in the solid insulation (bubbles, shrink holes, moisture). From the high amplitude of the apparent charge at rated voltage and the large number of PD pulses (12 to 13 pulses per period of the sinusoidal voltage), it was concluded that several different PD sources had to be assumed inside the insulation system. The dependence of the PD inception voltage on the setting of the on-load tap-changer position indicated defects close to the exit of the HV windings. After approximately half an hour during the first measurement routine at 52% of rated voltage, an asymmetrical accumulation of PD signals synchronous with the supply voltage was observed in Phase U as well. The amplitude of the apparent charge, at a maximum of 500 pC, was significantly smaller than in Phases V and W, and the number of pulses, too, was merely 1 to 2 pulses per minute. It was hypothesized that this second PD source was caused by a conductive particle in the vicinity of Phase U, but would not endanger safe operation of the transformer. These results of PD measurements corresponded very closely with the results of the gas-in-oil analyses. Acoustic signals could not be measured, which in turn confirmed PD sources inside the insulation system. Therefore it was impossible to locate the PD sources by acoustic means. The size of the apparent charges measured, and the high number of PD pulses per period in Phases V and W led to the conclusion that the insulation system had already been damaged, and that there was a real risk of its complete destruction, including an internal catastrophic breakdown, if the transformer continued operation. From the result of these measurements it was hypothesized that the cause for the PD activity following two relocations of the transformer, was mistakes during the oil filling procedure, since during the preceding 19 years of operation there had been no signs of irregularities.
267
Figure 4-10: PD measurement, PD activity at Phase V HV winding PD patterns and conventional oscillographic diagram
268
Figure 4-11: PD measurement, PD activity at Phase W, HV winding PD patterns and conventional oscillographic diagram
269
Measurement of the Polarization Effect: Polarization effects in the oil/paper insulation and the aging status of the insulation were checked by measuring the recovery voltage (RVM). In general the RVM method does not allow a quantitative statement on the residual moisture content in the insulation system. Since no reference measurement was available either, the result was qualitatively compared with measurements taken on transformers of similar construction. In accordance with the results, the state of the insulation was assessed as good considering its age (see Figure 4-12).
Figure 4-12: Results of the RVM measurements
Analysis of the Transfer Function (Frequency Response of the Impedance): The results of these measurements are presented in Figure 4-13. They show very good congruence in the superimposition of the transfer functions for all three phases. Phases U and W are almost congruent in the range up to 200 kHz. The slight variation of Phase V in this frequency range is caused by the difference in capacitive coupling of the middle phase. In the range > 200 kHz, the impedance characteristics differ more substantially, since the influence of the different capacitive coupling becomes more significant. The FRA measurements did not give any indications of mechanical changes in the windings.
270
Figure 4-13: Frequency-dependent impedance of Phase W and superposition of the impedances of Phases U and V
Decision: Based on the results of the PD measurements, an urgent recommendation was given to take the unit out of operation for further investigations in the factory, in order to finally detect and eliminate the PD sources. Further Investigations in the Factory In the repair shop the transformer was prepared for repeating all routine tests as specified in DIN VDE 0532, with the residual oil being topped up under vacuum. All tests at 75 % of the rated test levels were passed successfully. The PD measurements, however, confirmed the results determined on site. The inception voltages were somewhat higher, and the PD levels a little lower. In view of these results, the decision was taken to open the transformer and to find the PD sources by gradually dismantling the core-and-coil assembly. Findings: After the core-and-coil assembly had been lifted out of the tank, considerable quantities of welding cinder and paint residues were found on all horizontal surfaces, particularly in small crevices. The paint particles, some of which had an area of up to 10 cm² (Figure 4-14), were not identical to the paint on the inside tank wall. The pipes supplied for the cooling system also exhibited a different inside coating.
271
Figure 4-14: Cinder and paint particles
As the windings were dismantled still further, after the upper yoke had been removed, considerable quantities of cinder and paint particles were also found on the yoke collars and inside the windings (Figure 4-15).
Figure 4-15: Particles inside the HV winding, Phase U
On the upper static shielding rings of the HV windings of Phases U and W, and the yoke collars above them, faint traces of discharges were found (Figure 4-16).
272
Figure 4-16: Discharge trace (left) and cinder particles (right) on the static shielding ring of the HV winding, Phase U
Small traces of discharges were also found on the static shielding ring and the associated yoke collar of the HV winding, Phase V. These findings confirmed the results of the diagnostic examinations, particularly of the extensive PD measurements and their interpretation. In general the windings were in an excellent condition, and did not exhibit any deformations whatsoever, which confirms the result of the FRA measurements. The insulation system showed only some signs of aging, despite the long period of operation. Cause of the Fault The rise in the key gases H2 and CH4 was caused by partial discharges, which were initiated by the paint and cinder particles that had washed into the windings. The conclusion to be drawn from the data, the results of the diagnostic measurements on site and in the repair shop, and the findings obtained from removing and dismantling the core-and-coil assembly, is that these particles must have entered the transformer during the course of its double relocation. It is known that modifications were carried out to adapt the cooling system at the receiver station. These included welding and painting of some components. This hypothesis is supported by the fact that the first increase in the content of decomposition gas was observed immediately after the transformer had been relocated. Due to the directed oil flow of the OD cooling system, the particles were flushed directly into the windings, where they were deposited on the horizontal surfaces. At the most electrically stressed points of the HV windings in the vicinity of the upper static shielding rings, the conductive cinder and paint particles led to local field disturbances, resulting in weak but continuous partial discharges at rated voltage, which after only a relatively short time damaged the solid insulation. Based on these findings, despite the generally good aging condition, the decision was taken to replace the windings and the main insulation, since it was not possible to 273
ensure that the foreign particles could be completely removed by means of cleaning procedures. After the transformer had been repaired and started up again, the diagnostic measurements were repeated on site. No measurable internal partial discharges could be detected. Consequently, the transformer was put back in service. Final Remarks This case study demonstrates in exemplary form the systematized, step-by-step approach for investigating an incipient fault using modern diagnostic methods, here primarily PD measurement on site.
274
4.1.8.2 CASE 2: ANALYSIS OF A FAILURE CAUSED BY OVERVOLTAGES AT NO-LOAD SWITCHING OPERATION
Technical Data of the Transformer Type: Rating: Rated voltage: Connection symbol: Frequency: Year of manufacture:
3-phase substation transformer 40 MVA 115 ± 13 x 1.945 / 21 kV YN d5 50 Hz 1976
History and Fault Progress Shortly after the transformer went into operation, a flashover occurred across the protective spark gap of the HV bushing of Phase V against ground during no-load switching operation to the 110-kV network. Routine measurements involving insulation resistance (mega-ohm test), winding resistances and transformation ratio (TTR) were performed. No deviations were detected from the factory results and no faults could be detected. Following these measurements, the transformer was energized via a generator. The on-load tapchanger was moved through all its positions at 50 % and 100 % of rated voltage. Finally the unit was repeatedly switched on at no-load and loaded to full load. No further irregularities occurred. In order to clarify the fundamental cause of the external flashover, switching tests were conducted about 2 months later. These tests resulted in another breakdown, with a trip of the Buchholz relay. When the transformer was subsequently energized using a generator, the Buchholz relay was again tripped, at just 45 % of rated voltage. After that the transformer was sent to the factory for examination. Observations at the On Site Switching Tests During the switching tests, it was observed that closing of the three poles of the 110-kV circuit-breaker was randomly out of synchronism by up to 9.5 msec. The peak overvoltage observed in a total of 22 tests varied substantially with a maximum of 3.9 p.u. which corresponds to a peak voltage of 600 kV. Findings: When the windings of Phase V were dismantled, a flashover was found half-way up between the two layers of the LV winding. The LV winding is designed as a 2-layer spiral winding with adjacent oil channels and a pressboard barrier between the two layers. Figure 4-17 shows the damage to the windings. The severe burns in the copper conductors of both layers, and the severe soot deposits, are clearly related to the AC
275
voltage flashover during the restart at 45 % of rated voltage following the preceding switching voltage discharge at the switching tests.
Figure 4-17: Root of the AC voltage flashover on the inner layer of the LV winding of Phase V
After the repair work on the LV winding of Phase V, all voltage tests were repeated in order to check the dielectric strength of the insulation. During the surge voltage test of the HV side, another flashover was observed in the LV winding of Phase U. In this case as well, the flashover marks were half-way up the winding between the two layers. Figure 4-18 and Figure 4-19 show a typical surge voltage defect with roots of just the size of a pinhead on the conductors, slight traces of discharge around the discharge channel of the pressboard barrier, and minimal traces of burns.
Figure 4-18: Root of the surge voltage defect on the inner layer of the LV winding of Phase U
276
Figure 4-19: Surge voltage breakdown of the layer insulation of the LV winding of Phase U
Analysis of the Cause of the Failure: The flashover in the low-voltage winding of Phase V during the switching operations is attributable to impermissibly high switching overvoltages when the transformer was connected in no-load state. The synchronism error of the circuit-breaker was responsible for the extreme level of the overvoltage. Whether the winding had already been damaged beforehand by the flashover of the protective spark gap could not be decided. The investigations performed revealed no indications of any damage. The stationary rated voltage stress of 10.5 kV at the fault location, however, was so small that even after a perforation by a discharge the layer insulation was comfortably able to withstand this stress. In the case of non-synchronized switching of the circuit breaker, the 3-limb core is magnetized up to saturation in single-phase mode. If the neutral of the HV winding is not grounded, high overvoltages may be induced. Only after the third breaker pole has closed will the associated winding be returned to line potential. The size of the induced voltage is governed by the remanence condition of the core and the switching instant referenced to the line voltage. If high remanence coincides with the zero transition of a phase voltage, and in addition there is a high synchronism error, then as a consequence of non-linearity and magnetic transient phenomena, high overvoltages must be expected. This is what was confirmed by the switching tests. Modern cores made of cold-rolled grain-oriented steel sheets exhibit a very steep magnetization characteristic, with a narrow hysteresis loop. The remanent magnetization can match 80% of the rated induction depending on the instant of switching off the voltage. In the case under discussion, the arcing of the protective spark gap (set to 750 mm) of the HV bushing of Phase V indicates switching overvoltages of more than 500 kV. For rod-rod spark gaps with 750 mm spacing, the 50% breakdown switching voltage at positive polarity is more than 500 kV and about 600 kV at negative polarity. These 277
figures may even be substantially exceeded due to the high scatter for long-wave surges. The test level of the transformer was 550/630 kV for lightning impulse voltages and 450 kV for switching voltages. It must be assumed that the stress encountered during the flashover of the protective spark gap had been substantially higher than the protection level, possibly above its test level. Due to the exterior flashover, the HV winding must have been stressed with a chopped wave, which by overshooting may have reached a level up to 140 % of the breakdown level of the spark gap. The HV winding withstood this stress. However due to the voltage transmitted to the LV side, layer insulation of the LV winding of Phase V suffered a flashover. Depending on the relation of the winding capacitance and inductance, there is a transient up-swing of the outer layer versus the inner layer. As a result, typically the maximum stress occurs between the layers halfway up the winding. The location of the fault in both of the defective LV windings involved confirms the theoretical considerations. The defect in Phase U follows the same logic; however, it cannot be unambiguously decided whether the flashover occurred as a consequential fault of the defect in Phase V prior the subsequent circuit breaker switching tests. Actions After the defective windings had been repaired the transformer was reconnected to the system. As a result of the fault analysis, synchronism of the circuit-breaker was ensured by appropriate means. Since then, no troubles have been observed due to overvoltages caused by no-load switching operations. Remark This case study shows that switching under no-load conditions is of major importance. By using core material with an extremely steep magnetization characteristic and accordingly high remanence voltage, and due to the step-lap lamination of the core (low shear of the hysteresis loop), high overvoltages which may substantially exceed the test voltage level can occur under unfavorable switching conditions. The most important parameters in this context are the switching instant related to the voltage half-wave and synchronism errors of the circuit-breaker. For this reason, measures to ensure controlled switching of the individual breaker poles are highly recommended.
278
4.1.8.3 CASE 3: FAULT ANALYSIS ON A GENERATOR STEP-UP T RANSFORMER FOLLOWING AN
INTERNAL
FLASHOVER
Technical Data of the Transformer Type: Rating: Rated voltage: Connection symbol: Frequency: Year of manufacture:
generator step-up transformer 200/100/100 MVA 353.63 ± 2x8.63/13.8/13.8 kV YN d1 d1 60 Hz 1991
History and Fault Progress As the name plate data indicate, the unit involved is a 3-winding transformer feeding the power of 2 gas turbines into the grid. The HV side is connected to an overhead transmission line network via a 345-kV SF6 substation. The 3-winding transformer has two separate LV windings, constructed as 2-layer spiral windings and arranged axially one above the other. The common HV winding also is axially subdivided and connected in parallel with the HV entrance in the middle. It was designed as an interleaved coil winding. The conductors of the outermost 4 coils at both ends of the HV winding are subdivided in such a way as to minimize additional eddy current losses by the radial component of the stray field. The regulating winding is likewise interleaved, and divided into two halves connected in parallel. Approximately 6 months after startup of operation, the transformer was shut down following a ground fault. No cause for the fault was found. The transformer was put back into operation after routine measurements had been performed. Seven months later, during normal operation, the differential protection relay of Phase B was activated by the overcurrent function, but without an instantaneous trip of the unit. To clarify the cause of the fault, the following measurements were performed: winding resistance on the LV side; the results were not significant, since the generator bus-ducts were included in the measuring circuit insulation resistance of the windings between each other and against ground voltage test with 80 kV DC over 10 minutes These measurements did not indicate an internal fault. Examination of the oil, and specially a gas-in-oil analysis, was not performed. The transformer was reenergized under no-load conditions, i.e. with the HV side disconnected from the grid. Immediately after being switched on, the unit was instantaneously tripped, triggered by:
279
differential protection of Phases B and C overcurrent protection of Phase C Buchholz relay tank overpressure protection After 6 half-waves, the unit was switched off by the HV circuit-breaker. Immediately afterwards, a fire alarm was initiated in the transformer bay. Findings The data from the fault recorder confirmed an internal flashover to ground with a high fault current and a collapse of the voltage in Phase B. A first inspection on site revealed that the tank had split open at the cover flange, and was bulged at the HV side. A considerable amount of oil spilled and was ignited by the internal arc. The fire in the transformer bay was successfully extinguished within a short time by the sprinkler system and the fire brigade. The explosion-like incident had sheared off the foundation bolts, and shifted the transformer approx. 50 mm sideways. A provisional inspection of the interior of the transformer revealed severe damage to the regulating winding of Phase B, the associated HV bus-duct and the bus-duct framework. For further investigations and clarification of the fault cause, the transformer was transported to a repair facility, where it was completely dismantled. The following damages were observed: The windings of Phases A and C were undamaged with only slight deformations at the HV connections, caused by the collapse of the framework of the regulating bus-ducts In Phase B, the axially split regulating winding had collapsed completely; the inner windings were radially buckled, and the outer ones were stretched. This is a typical fault pattern for interleaved windings, with the current flowing in the opposite directions through radial adjacent turns (Figure 4-20)
280
Figure 4-20: Deformations of the regulating winding, Phase B (lower part)
The main insulation between the regulating and the HV windings was bulged from inside and cracked longitudinally, due to a flashover starting from the bottom end of the HV winding towards the HV line lead entry (Figure 4-21). The last 4 coils at the bottom end of the interleaved HV winding experienced severe mechanical distortion; several turns had burnt open. Like in the regulating winding, adjacent conductors had shifted upwards and downwards out of their original position in the coil and penetrated the axial adjoining coil. This is again a typical deformation observed after a short-circuit in interleaved coil windings. The transition section between the two radially disposed strands and the two axially disposed strands in one of the coils was never found, suggesting that it was consumed by the arcing fault (Figure 4-22). The whole area in which the flashover to ground had occurred was severely sooted and covered with charred pieces of insulation.
281
Figure 4-21: Damage of the main insulation between the HV and regulating winding of Phase B
Figure 4-22: Deformed end coil
Analysis of the Failure Cause The initial warning of the differential relay when triggered by the overcurrent function was in itself sufficient to justify the conclusion that a short-circuit had occurred in the entire Phase B winding or part of the winding. The high effective reactance of the sound part of the HV winding had limited the fault current at the HV terminal to a level below the activation level of the differential relay. In accordance with the ratio of 1/11 between the number of turns in the short-circuited coils and the remaining sound coils, the fault current was able to trigger an overcurrent warning, but it was far below from matching the rated short-circuit value. 282
At any rate a pre-damage of the Phase B HV winding must be assumed. This initiated the total flashover when the unit was switched on again. The failure evidence strongly indicates that the most probable scenario for initiation of the fault was a strand-to-strand insulation breakdown at the transition from two radially disposed strands to two axially disposed strands in one of the discs toward the bottom of the B-phase. The transition point constitutes a discontinuity with reference to fast transient phenomena, which may lead to considerable increase in voltage due to reflections. The risk of high overvoltage stress is particularly relevant in the case of switching operations with SF6 breakers and in SF6 substations. There is no doubt that at the no-load switching operation after the poor investigation (no DGA samples taken) of the previous overcurrent warning, the previous turn-to-turn fault was re-established and quickly spread to involve more discs and finally ended up in a full line-to-ground fault. Either the inrush current or switching overvoltage or both of them caused the catastrophic flashover along the HV winding between the HV entry and the end of the winding, thus resulting in the serious damage caused by a single phase ground fault. Analytic network studies for determining the switching overvoltages to be anticipated on the system, plus investigations of the transformer’s oscillatory characteristics and its natural frequencies, did not produce any unambiguous results that would explain the cause of the fault beyond any doubt. The part-winding defect was likely not due to incorrect execution of the connecting point between the end coils and the normal coils of the HV winding. This is because the unit had been in operation for one year before the fault occurred. Moreover, an examination of the connection points at the other windings did not indicate any incorrect workmanship. The design and dimensioning of the conductor insulation was checked by an experienced independent expert, who attested to high safety margins. Remark This case demonstrates how important gas analysis can be for assessing fault situations. When the first differential protection trip was investigated, the person responsible for the investigation failed to perform a gas analysis, which would definitely have resulted in strong indications of the developing fault. Additional ratio and impedance measurement and perhaps an FRA examination would have provided unambiguous indications of an internal fault, so that the total loss of the transformer and the fire on site could have been avoided.
283
5 ONLINE DIAGNOSTIC MONITORS FOR TRANSFORMERS AND KEY ACCESSORIES Power transformers and their accessories at critical nodes in electricity networks and industries are subjected to heavy stresses during their lifetime. Load peaks – predictable as well as unexpected – generate high temperatures which shorten component lifetime. In the worst case, sudden failure can occur, causing havoc in the network or losses of production. It is because of this risk, and the penalties that can attach to it, that utilities give such a high priority to controlling and monitoring the status and condition of their transformers [143]. It has also become clear that periodic sampling of key condition indicators is ineffective at capturing the onset of some serious problems in transformers. This is where the application of online monitors comes in. By constantly measuring and accessing the appropriate parameters, these devices allow asset managers to intervene before failure, malfunctioning or reduction of lifetime can occur. Increasingly, for many utilities and industries, the watchword is ‘early detection of failure conditions.’ In this section, we provide a discussion of some of the key parameters that are useful to monitor on transformers and other key accessories.
5.1
POWER TRANSFORMER (TANK & CORE)
The key parameters for power transformer online monitoring (Table 5-1) include gasesin-oil, moisture-in-oil, oil/ambient temperature, load current, winding hotspot temperature (calculated from oil/ambient temperature, load current profile, and design data), partial discharge, and motor current of cooling pumps/fans [144]. Table 5-1 : Power Transformer Monitoring Needs [145] Natural Aging Process
Factors that Accelerate Aging
Natural Outcome if Left Unchecked
Signals Used for Online Monitoring
Paper cellulose decomposes into CO, CO2, H2O, acids, and glucose (which further breaks down into furans).
Water ingress from outside; internal water from paper, heat, and oxygen; and continuing presence of acids.
Continuous degradation of paper insulation component.
Water (H2O) in oil and gases in oil (CO, CO2 ).
Localized cumulative insulation damage and eventual failure. High localized stress on oil, paper and bus work leading to damaged components, and functional failure. Rapid decomposition of oil and paper into gases and explosion likely if not stopped quickly.
Hydrogen (H2), partial discharge RF currents, and acoustic detection.
Partial discharge (corona) (<300 ºC). Thermal fault (>300 ºC and <700 ºC). Oil decomposes into various gases. Arcing fault (>700 ºC).
Accumulated water dissolved in Oil will saturate and become free when due point reached. oil.
Electrical current flows.
284
Excessive heat in core due to Very rapid breakdown of insulation papers in core elevated load currents. Core distortion, paper Short circuit fault currents. damage, and loss of clamping pressure.
Hydrogen (H2), methane (CH4), ethane (C2H6), and ethylene (C2H4). Hydrogen (H2) and acetylene (C2H2). Water (H2O) dissolved in oil and low oil temperature range. Core temperature monitoring. Frequency response analysis (FRA). This is rarely available online.
It should be noted that although online monitoring of partial discharges (PD) on power transformers is offered by a handful of vendors, it is still an evolving technology. The difficulties include the ability to eliminate interferences and consistent interpretation of the results. Due to the relative high costs PD monitoring is usually required only on “problem transformers”. Cooling control systems that integrate current and temperature monitoring may be a low cost solution for power transformer retrofit. Hotspot temperature, remaining insulation life and dynamic ratings can all be estimated from the current, temperature and transformer design data [146,147,148].
5.2
LOAD TAP CHANGER
The simple means of monitoring the condition of load tap changers is to monitor the temperature difference between the LTC and the transformer main tank. There are, however, advanced monitoring parameters, including drive motor torque, drive motor current (contact wear calculations), and vibration acoustic pattern that allow more refined diagnosis of LTC problems to predict maintenance/overhaul needs based on actual condition and not on the number of switching operations. Table 5-2 : Load Tap Changer Monitoring Needs [145] Natural Aging Process
Breakdown of insulation system. Damage to mechanism. Wear of mechanical components.
Factors that Accelerate Aging
Natural Outcome if Left Unchecked
Drive mechanism sticky or erratic in operation.
High wear and eventual drive mechanism failure.
Drive mechanism totally jams (locked rotor).
No secondary voltage control with likely damage to drive motor.
Stops over correct tap contact but with insufficient contact pressure.
Gradual heating of tap changer oil and cumulative damage to contact.
Stops between two adjacent tap positions.
Rapid heating of tap changer oil due to series resistor remaining in circuit continuously.
Low oil level leading to arcing fault.
Serious damage or explosion.
Signals Used for Online Monitoring Drive motor torque, drive motor current, and vibration acoustic pattern. Drive motor torque and drive motor current. Slower increase in OLTC temperature (compared to main tank temperature) when remaining on this tap setting for longer periods. Faster increase in OLTC temperature (compared to main tank temperature) with heating rate dependent on load current. Header tank oil level.
LTC monitoring is often integrated with transformer main tank monitoring.
5.3
BUSHING & CT
The key parameters for online monitoring include partial discharge, capacitance, and power factor or tan (Table 5-3). Due to the difficulty of PD monitoring, the only key parameters left are the capacitance and tan . There are also some systems that monitor insulation leakage current at the bushing tap. Dramatic changes in the signature of this current provide indication of problems in the bushing.
285
Table 5-3 Bushing & CT Monitoring Needs [145] Natural Aging Process
Factors that Accelerate Aging
Natural Outcome if Left Unchecked
Signals Used for Online Monitoring
Damage to porcelain.
Rapid temperature swings or extreme environmental conditions, conductive oil byproducts built up on porcelain inside walls, and oil leak leading to paper drying out and cracking.
Crazing allowing dirt build-up and water ingress with reduction of insulation properties.
Changes in tan and leakage current.
Core paper deterioration.
Elevated operating temps.
Oil deterioration.
Similar mechanism as within transformers.
Short circuits between foil layers.
Design/manufacturing defects, paper/oil aging, and conductive ink migration.
Small voids within insulation system.
Partial discharge (corona) caused by tiny flashovers inside voids in insulation.
Large temperature variations.
Differing coefficient of expansion of bushing components and rapid cooling can create bubbles in oil.
5.4
Localized partial discharge promoting further paper (and oil) deterioration (possible runaway condition). Localized partial discharge promoting further oil (and paper) deterioration (runaway condition). Higher capacitance leading to increased capacitive current. Localized insulation damage with formation of carbon and/or shorts between foil layers. Frequent thermal cycling results in excessive seal wear, in turn leading to oil leak and/or water ingress. Also end paper damage & possible corrosion in tap chamber.
Partial discharge RF currents and changes in tan and leakage current. Partial discharge RF currents and changes in tan and leakage current. Increase in bushing C1 (and possibly C2) capacitance. Partial discharge RF currents and changes in tan and leakage current.
Usually will show up as an increase in tan and/or partial discharge RF currents.
EXAMPLE MONITORING SYSTEMS
A limitation of many transformer monitoring systems is that they are not able to control or make decisions and recommendations based on the available data, forcing engineers to spend a great deal of time sorting and interpreting the information they receive. ABB’s Transformer Electronic Control (TEC) monitoring system [143], offered for new transformers, and addresses this issue. To achieve the goal of making power transformers “intelligent” and maintenance-free, ABB created and integrated a common electronic interface to exchange information with the following apparatus: Monitoring and diagnostics devices of the transformer and components Transformer control cabinet Tap changer motor-drive Voltage regulation system Overall protection system TEC receives all the information it needs for transformer control from these sensors; other necessary parameters are calculated. Through this interface, TEC provides exact status information to enable utilities to extend transformer lifetime and save costs by 286
reducing maintenance and increasing availability. It does this by generating a model of the transformer and its working condition and then comparing the measured parameters with the simulated values. Discrepancies are detected and potential malfunctions and/or normal wear in the transformer and its ancillaries are indicated. For retrofit applications, ABB also proposes the T-Monitor, described in Table 5-4. In addition to the standard data acquisition of various sensors and built-in models, an implemented prognosis /diagnosis tool helps the operator in taking the right decisions. With a remote control access option ABB can support the operator for troubleshooting. Table 5-4 provides general descriptions of some of the systems available on the market for monitoring various parameters and accessories on transformers. Note that this is only a small sample of the various devices and systems that are available from a multitude of suppliers.
287
Table 5-4: Examples of Typical Monitoring Systems for Transformers
Monitoring Systems/Devices
Sample Pictures
General Description A common electronic interface to new ABB transformers to provide add-on functionality. The system is composed of several sensors designed and built into a new transformer. The system measures or estimates the following parameters: Hotspot at HV/LV/TV and estimate of hotspot temperature Cooling control OLTC contact wear
ABB Transformer Electronic Control (TEC) Monitor
WEB interface Moisture in oil measurement Bubbling temperature Insulation aging due to moisture Transformer temperature balance Oil level in conservator Online gas-in-oil interpretation OLTC temperature balance
OLTC torque A proven retrofit solution that provides adequate predictive power by means of easily fitted add-on sensors and models that use the available information about the transformer and its component design. The system measures the following parameters: Top oil and ambient temp Coolers temp Dissolved gas and moisture in oil ABB T-Monitor
Load current Bushings OLTC (Temperature difference between main and OLTC tanks, motor torque) Acoustic partial discharge The system performs the following calculations (on-line models): Winding hotspot calculation Insulation aging calculation Overload capability calculation Moisture saturation in the oil Moisture in the insulation Bubbling temperature based on hotspot calculation Contact wear in the OLTC from current at OLTC Cooling optimization Communication: Ethernet, LAN, Web
288
Monitoring Systems/Devices
Sample Pictures
General Description
The HYDRAN 201R Model i intelligent fault monitor reads a composite value of gases, in ppm, generated by faults and provides output capability for communications. It consists of a HYDRAN 201Ti intelligent transmitter, a HYDRAN 201Ci-1 one-channel controller, and HYDRAN HOST software. The HYDRAN 201Ti transmitter attaches to a valve on the transformer to be monitored. The HYDRAN 201Ci-1 controller handles communications and provides display, alarms, and analog outputs. GE Energy HYDRAN 201R + M2 (Courtesy of GE Energy)
The HYDRAN M2 reads a composite value of gases [ppm] and the moisture content in oil [%] at a corresponding temperature.
The Calisto system reads dissolved hydrogen in oil and moisture content in oil.
Morgan Schaffer Calisto Dissolved Hydrogen and moisture monitor
289
Monitoring Systems/Devices
SERVERON On-line Transformer Monitor (Courtesy of Serveron)
KELMAN TRANSFIX Transformer Gas Analyzer
290
Sample Pictures
General Description The Serveron Transformer Monitor offers accurate and repeatable online DGA of the 8 critical fault gases and other key parameters. Correlation to real events is accomplished through time stamping of all gas data relative to transformer load, ambient temperature, oil temperature, and moisture-in-oil measurements. Hourly sampling, trending, and alarm signals are available for all measured parameters. Field-proven in utilities worldwide, the gas chromatograph technology in the Serveron Transformer Monitor offers high reliability and low cost of ownership.
The TRANSFIX Transformer Gas Analyzer offers accurate and repeatable online DGA of the 8 critical fault gases as well as moisture. Hourly sampling, trending, and alarm signals are available for all measured parameters. It allows extensive local and remote communication options. The system requires only minimal maintenance and no consumables are needed (no carrier gases).
Monitoring Systems/Devices
GE Energy AQUAOIL 400 (Courtesy of GE Energy)
Sample Pictures
General Description The AQUAOIL 400 system is a standalone unit for field installation on a transformer valve. It allows the user to monitor online the relative humidity in the oil and its changes during load variation.
The Vaisala sensor reads the moisture in oil and temperature. It allows the user to monitor online the relative humidity in the oi. VAISALA HMP228 Moisture and Temperature Transmitter for Oil
Doble DOMINO (Courtesy of Doble Engineering)
Doble’s Moisture in Oil sensor measures the relative saturation and temperature of the insulating fluid and calculates the moisture concentration in parts per million. The DOMINO’s stainless steel probe is placed directly into the insulating fluid through an access point on the transformer wall, typically a sampling or drain valve. The IDD for Moisture estimates the moisture concentration in paper and the average moisture concentration over time. The IDD for Moisture also tracks the dielectric breakdown strength and stores this hourly.,
291
Monitoring Systems/Devices
Doble Intelligent Diagnostic Device (IDD) – Bushing Tap Adapter (Courtesy of Doble Engineering)
Sample Pictures
General Description The IDD, Intelligent Diagnostic Device for Bushings and CTs, is a costeffective solution to continuously evaluate the condition of bushings and CTs while in service. This IDD measures the electrical signal at the bushing and CT taps. The conditions of the bushings and CTs are evaluated by summing the leakage currents measured at each tap. The analysis requires monitoring all bushings or CTs in a three phase set. One IDD can monitor up to four sets of bushings (2 sets of CTs) associated with the same apparatus. Tap adapters specifically designed for the particular bushing/CT are mounted to the tap, allowing the IDD to measure the leakage current.
The InsulGard system monitors bushing insulation integrity on-line.
Cutler-Hammer InsulGard G2
TM
Weidmann TM CENTURION (Courtesy of Weidmann Electrical Technology)
292
The CENTURION On-line insulation performance monitor detects any changes in oil dielectric strength due to moisture content or contamination (carbon contaminants/burning or metallic and ferrous contaminants). It provides warning when it is time to take remedial action and indicates the need for further remedial action. It provides information through local annunciation or integration with a data collection system for long-term trending of oil degradation. It can be used on Transformers, Load Tap Changers, Oil Circuit Breakers and Regulators.
Monitoring Systems/Devices
Sample Pictures
General Description Standard temperature index calculations: the difference in temperature between the LTC compartment and the main tank over a specified period of time. Standard temperature differential calculation: the difference in temperature between the LTC compartment and the main tank.
GE Energy LTC-MAP 2130 (Courtesy of GE Energy)
Advanced differential calculation: Compares any two sensor inputs for differential, averages differential, and moving window index. Integration over time of the square of the current feeding the motor allows to evaluate the condition of the mechanical system driving the LTC. Advanced moving window calculations: For any sensor input, shows the moving average, moving maximum, moving minimum, moving trend, and moving normal deviation. The TM100 system monitors the condition of the LTC
MR Tap-changer TM100 monitoring system
293
6 PREVENTIVE MAINTENANCE OF TRANSFORMERS 6.1
BASIC AGEING PROCESSES [149]
6.1.1 INTRODUCTION The main point of concern in ageing and life expectancy of transformers is the condition of the insulation system, which is typically based on organic products. The following organic products are found in an oil immersed transformer: Mineral oil and Paper and pressboard (cellulose) The organic products in a transformer degrade over time and finally they lose the capability to withstand the stresses a transformer might see in daily life (short circuits, energizing, vibration, etc.). It is possible to reverse the ageing of mineral oil through oil reclamation that can restore the material properties close to the values when new. Ageing of paper insulation however is an irreversible process and is considered one of the life-limiting processes of a transformer. The main factors that contribute to the degradation processes of the organic materials are: Temperature Moisture Oxygen Acidity The lifetime of this combination of mineral oil and paper in a transformer is very much dependent on the operating temperature, oxygen content, acidity of the oil and the moisture content in the insulation. Temperature is mainly dependent on the transformer design, the loading, the cooling facilities, and the ambient temperature. Changing these parameters is not easy and normally involves large investments. Moisture is accumulated in the paper insulation of the transformer and has different sources. Poorly maintained breathing apparatus on open breathing expansion tanks or damaged gaskets on the cover can be a source of water from outside as can exposure of the insulation material to air during a repair operation[150]. Also, the depolymerization (ageing, degradation) of the insulation paper and the ageing of the oil create water as a by-product inside the transformer [151,152]. New research also shows that the acid content plays a major role in the degradation processes, in which the low molecular acids are of main concern. The acids are produced as by-products of the oil and paper degradation. To extend the technical life and to increase the reliability of the transformer, the moisture and acid levels in the insulation should be kept as low as possible.
294
When a transformer leaves the factory, the insulation system is dry and almost free of acids. This will change over the time as water and acids are produced through degradation of the cellulose material and accumulate in the transformer. As a result, the speed of degradation of the paper and oil will increase. Removing moisture and acids from the transformer can slow down the ageing process and thus extend the lifetime of the insulation system. These removal processes are preferably performed on site, as moving a large power transformer to a transformer workshop equipped with a vapor phase drying plant incurs considerable costs in both time and money. Onsite drying and online oil reclamation are two processes that will extend the remaining lifetime of the insulation system on site. 6.1.2 PAPER DEGRADATION Ageing of the paper insulation in the windings is irreversible, and considered one of the life limiting processes of a transformer. As the paper ages its mechanical properties (tensile, bursting and folding strength) are reduced. This was first described by Montsinger [153], who gave the rule that the rate of change of mechanical properties increases with temperature and doubles (the life is halved) for every 6-8 degrees Celsius increase according to the formula: Rate of ageing = constant·e Where
is the temperature in Celsius and p is a constant.
Paper (and pressboard) consists mainly of cellulose and some percent of hemicellulose and lignine. The reduction in mechanical strength is due to chain scissions of the cellulose molecules. New oil-impregnated paper has an average chain length of 10001200 polysaccharide rings in series – denoted degree of polymerisation (DP). The tensile strength depends on the DP as shown in Figure 6-1. Conventionally a DP value of 200 is used as an end of life criterion
Figure 6-1: Tensile strength dependence of DP for Munksjø kraft paper
295
Instead of using tensile strength to estimate ageing, one can use the scissoring of the cellulose molecules ( ) , which in turn reduces the DP value and the Arrhenius dependence according to Ekenstam [154]: = DPnew·A·exp(-E/(RT))·t = DPnew·k·t The equation shows how the number of chain scissions ( ) increases with time (t). The expression A·exp(-E/(RT)) describes the ageing rate k. R is the molar gas constant, T the absolute temperature and E the activation energy, which describes how the ageing varies with temperature. The higher the value of E, the faster the ageing rate increases with temperature. A is a factor that depends on the chemical environment of the cellulose. It has long been established that the ageing of cellulose can be divided in two processes: oxidation and hydrolysis [155,156]. For both processes the ageing rate increases with temperature. There are strong indications [157] that the temperature dependence is different for the two processes, and it may well be that oxidation dominates at lower temperatures and hydrolysis at higher temperatures. Under oxidation, the ageing agent is oxygen from air ingress. The ultimate end products of oxidation are the same as for combustion, i.e. water and carbon dioxide. However, the mechanism of low temperature oxidation is quite different from that of combustion. The oxygen concentration is an important parameter that determines the rate of oxidation. However, most experimental studies show that the ageing rate is not so strongly influenced by oxygen content. Typically, the overall degradation rate will no more than double in experiments with oxygen present, compared to when oxygen is totally excluded. It can therefore be concluded that the importance of oxygen to ageing is limited. The other major mechanism of paper ageing is hydrolysis. The significance of water content is paramount: a humidity of 3-4% may increase the degradation rate of paper by a factor of 10 or more, compared to dry paper. This underlines the importance of assessing both moisture and temperature of the insulation system. It must be mentioned that these studies are from laboratory samples and may not be directly transferable to transformer life assessment. Newer theories on hydrolyses proposes that the process is due to acid catalysis; H+ (or rather H2+O) ions from carboxylic acids that are dissociated in water serve as catalysts to the chain scissoring of the cellulose molecules [158]. Since both hydrolysis (and also oxidation) produces carboxylic acids and water, this makes hydrolysis an autoaccelerating process. The various acids produced in a transformer influence ageing differently. This is demonstrated in an experiment where five different acids were added to the oil up to a neutralization value of about 0,4 mg KOH/g [159].
296
1200 Formic Acetic
1000
Levulinic Naphtenic
DP-value
800
Stearic No acid
600
400
200
0 0
200
400 Time [hours]
600
800
Figure 6-2: Ageing of paper at 130 °C in oils with an acidity of 0,4 mg KOH/g
As can be seen from Figure 6-2, the high molecular weight acids (stearic and naphthenic acids) do not accelerate ageing. The effect of the other acids on ageing rate is an increase with decreasing molecular weight. The reason for the different influence on the ageing rate is mainly due to the hydrophilic nature of the lower molecular acids. The acids with lower molecular weights dissolve easier in the paper than the stearic and naphthenic acids [160]. The significance of these findings for maintenance is important. The ageing accelerating substances – water and low molecular acids - will tend to dissolve better in paper than in oil. Removal of these substances from the cellulose is therefore what the winding maintenance activity should aim for. Oil reclaiming will certainly remove some of these, but other methods may be more efficient. It is in this context important to note that the measurement of the neutralization value as is standardized in IEC 62021-1 and ASTM D974 mainly detects acids formed by oil ageing. A new measurement technique is needed for the detection of the dangerous hydrophilic acids. Presently there are no standards methods for estimating the content of these acids in a transformer. One technique may be “water washing” of an oil sample to remove the low molecular weight acids from the oil sample. The difference in neutralization number between a measurement of a “pure” and a “water washed” oil sample may yield a descriptor for the low molecular weight acids.
297
6.1.3 6.1.3.1
ON-SITE DRYING METHODS T RADITIONAL METHODS
Circulation of hot dry oil
Dry oil is circulated through the tank and moisture that is extracted from the oil is absorbed in a vacuum degasifier. The method can be efficient in cases where the insulation is made of thin structures and the weight of the insulation is low. Heat /Vacuum Cycles
This technology incorporates the following procedures: Heat core and coil with hot oil circulation Drain the oil Vacuum treatment Cycle repetition (if necessary) Hot oil spray
This technology incorporates the following procedures: Bring oil level to the bottom part of the core Oil spraying under vacuum Increase vacuum level after spray is stopped to ensure final dry out Atomizing nozzles for the oil spray are recommended Combined oil-spray / Hot air / Vacuum / Oil circulation / Cycles process
Pre-starting procedures: Drain the oil Vacuum pre-dry the tank, core and coil Bring oil level to the bottom part of the core with dry, clean, stable, well-soluble oil Heating process: Oil-spray through spreading pipes installed above the windings under vacuum. Periodically circulate dry air through the tank to maintain the surface temperature. Drying process: Cycle vacuum treatment with circulation of transformer oil through the oil heater / filter followed with a cycle of oil spraying at low vacuum to maintain average drying temperature.
298
6.1.3.2
ON-SITE DRYING WITH LOW FREQUENCY HEATING (LFH) IN COMBINATION WITH HOT-OIL SPRAY [161]
Temperature and vacuum are the main factors for drying speed and drying quality. For optimized drying the transformer should be heated at the same time as vacuum is applied (as is done during the vapor phase process). With the combination of the low frequency heating (LFH) technique and hot oil spray or hot oil circulation, this can also be achieved on site. The low frequency voltage is necessary in order to reduce the applied voltage on the transformer when it is under vacuum. The reason is that the breakdown voltage of the insulation system is much lower under vacuum than under atmospheric pressure. This is also known as the Paschen law. In order to prevent hotspots during drying (due to reduced cooling), the applied current for heating power transformers should not exceed 50% of the nominal current. Consequently, the copper losses will be no more than ¼ of the nominal losses and the risk of potential hot spots at points with higher resistance will be negligible. Plant and process concept In order to heat up both the low and high voltage windings, a frequency of approx. 1 Hz is applied to the transformer. With the combination of LFH drying and conventional hot oil spray method, the whole transformer can be heated very uniformly. The LFH system heats the windings from the inside and the hot oil spray supports the heating process by heating outer parts of the insulation system.
Short circuit LV. Vacuum control valve
HV.
LFH Converter Spray nozzles
Vacuum pumps
Oil treatment plant
Figure 6-3: Plant concept for a mobile LFH drying process in combination with hot oil spray.
299
6.1.4 6.1.4.1
OIL RECLAIMING ONLINE OIL RECLAIMING TECHNOLOGY [162]
The essential elements of the online reclamation technology are that the absorbent is automatically reactivated after each cycle and that the transformer remains in operation. The reactivation allows for using much more active absorbent than with the classical type of reclaiming plants, where the Fullers earth needs to be replaced frequently and thereafter has to be disposed of. To achieve a long lasting effect, the complete oil volume is typically circulated 8 to12 times over the Fullers earth. The final step is to restore the inhibitor content. 6.1.4.2
COMPARISON WITH OIL CHANGE
There are several attractive features of online reclaiming compared to an oil exchange. For safety reasons it is sometimes necessary to de-energize the transformer when the equipment is being connected and disconnected. However, the process can be performed when the transformer is energized. This can present some obvious economical advantages. From a technical point of view the continuous “washing” of the solid insulation represents a great advantage. During ageing of the oil, large amounts of acids, sludge and other degradation products are absorbed by the paper and other cellulose material. These contaminants can later be redissolved into the new clean oil. In the case of reclaiming, the contaminants are constantly being removed from the oil during the process and they can be permanently removed from the cellulose material. In the case of oil replacement without proper cleaning of the active part, the residual degradation products will cause a substantial shortening of the life of the new oil. Without an appropriate washing procedure, the oil will typically be degraded again after only a few years (See Figure 6-4). 6.1.4.3
LONG- TERM STABILITY
The long-term stability and oxidation stability of reclaimed oil has been questioned. One reason is that the conventional reclaiming process (without reactivation of the absorbent) with the daily exchange of the Fullers earth was often performed using a limited amount of absorbent. As a result, the ageing by-products were not effectively removed from the cellulose material and were reabsorbed into the reclaimed oil. The effect is a recontamination of the processed oil within a very short time, as shown in Figure 6-4.
300
mg KOH/g, Acidity level
Severely aged oil0,3
Aging of transformer oil after reclamation and oil change
0,25 0,2 0,15 0,1 0,05
New oil
0 Before After process 3 mnd.
2 years
4 years
6 years
10 years
Time
Online reclamation
Little absorbent
Oil change
Figure 6-4: Evolution of total acidity in oil after online reclamation, oil change and reclamation with little absorbent
The modern reclaiming technology with the reactivation of the absorbent makes it economically feasible to use much more active absorbent material. Typically 5-10 times more absorbent is used compared with the old conventional systems. This leads to a much better cleaning effect of the paper and to an excellent long-term stability of the reclaimed oil. For some transformers, there is data available for up to 10 years since reclamation. The data shows very little change in acidity and color after 10 years in operation since the oil was reclaimed. For a successful reclamation process with excellent long-term stability approximately 700 kg of active absorbent is necessary to treat 1000 kg of oil. To prevent excessive production of acids due to oil degradation, it is recommended that the oil be reclaimed before it is severely degraded. Low molecular weight acids do migrate into the paper insulation and become much harder to remove than from the oil.
301
6.2
GENERAL MAINTENANCE OF TRANSFORMERS [163]
The primary purpose of transformer maintenance is to ensure that the internal and external parts of the transformer and accessories are kept in good condition (“fit for purpose”) and are able to operate safely at all times. A secondary, equally essential purpose is to maintain a historical record of the condition of the transformer. Transformer maintenance can be done periodically or as condition-based maintenance. On a periodic schedule, the frequency of inspection and maintenance procedures will vary with the rating of the transformer, but the intervals suggested below are recommended as minimums. Condition-based maintenance is usually the most economical way of doing maintenance. Recommended maintenance is then done based on one or more of the following: inspections, analysis of oil samples, electrical measurements, test of equipment, measurement of temperatures by using a heatsensitive camera, and/or monitoring (offline and/or online). For personal safety reasons, only a limited amount of maintenance activities should be performed on the transformer when it is in operation. Be sure to follow the manufacturer’s recommended safety requirements before any maintenance activity is undertaken. 6.2.1
RECOMMENDED SCHEDULE OF MAINTENANCE ACTIVITIES
CAUTION: Before performing any maintenance work near the transformer terminals, be certain that the transformer is de-energized. Ground the transformer terminals before entering the area at the top of the transformer. Failure to deenergize the transformer may lead to equipment damage, severe personal injury, or death. 6.2.1.1
MONTHLY MAINTENANCE SCHEDULE
1. Check and record the ambient temperature. 2. Check and record the transformer liquid temperature and note the maximum value since the last reading. 3. Check and record the transformer winding temperature and note the maximum value since the last reading. 4. Check and record the transformer load current and note the maximum value since the previous reading. 5. Check and record the line voltage and note any variation from rated value since the previous check. 6. For transformers equipped with Sealedaire®, check and record the reading of the pressure-vacuum gauge. If the gauge remains at or near zero when the oil temperature varies, the transformer should be checked for leaks. This is an important maintenance check which will verify the integrity of the transformer seal.
302
6.2.1.2
QUARTERLY MAINTENANCE SCHEDULE
1. Check and record the readings on all indicating instruments, such as the liquid level of the main tank, all oil-filled compartments, top oil temperature, and winding temperature. The maximum reading and the present reading should be noted on the temperature indicators. If the transformer is equipped with an Inertaire® oil preservation system, check and record the tank pressure and the remaining pressure in the nitrogen bottle feeding the system. Examine the piping to the coolers or radiators and all bolted pipe joints for signs of oil leakage. Tighten any loose fittings and repair any oil leaks. CAUTION: Some locations on the cooling equipment may be near the transformer line connections. It may be necessary to de-energize the transformer to work in these areas. Use proper safety procedures. 2. Examine the coolers or radiators for accumulation of dirt and foreign material that might impede airflow. The coolers or radiators can be cleaned by directing a stream of low-pressure water over the surfaces. On FOA coolers, the water should be directed to the front side of the cooler to wash any dirt toward the rear. Be certain the fans are shut off before starting any cleaning operation. The frequency of cleaning will vary depending on the conditions at the installation site. Annual cleaning is generally sufficient, but installation subjected to salt spray or heavy dust and dirt will require a more frequent schedule. 3. Inspect the control cabinet for the following conditions: CAUTION: The control circuits may have dangerous voltage levels. Deenergize the auxiliary power source before working on any control components. Failure to do so may cause personal injury or equipment damage. Control-circuit voltage Collections of dirt or gum Excess heating of parts (evidenced by discoloration of metal parts, charred insulation, or odor) Binding or sticking of moving parts Corrosion of metal parts Remaining wear allowance on contacts Excess slam on pickup Proper contact pressure Loose connections Condition of flexible shunts Worn or broken mechanical parts Excessive arcing in opening circuits Excessive noise in ac magnets Evidence of dripping water or liquids falling on controls 303
Operation, including proper functioning of timing devices and sequencing of devices 6.2.1.3
ANNUAL MAINTENANCE SCHEDULE WITH T HE T RANSFORMER DE-ENERGIZED
1. If the transformer is equipped with forced oil cooling, check the oil circulating pumps, noting any unusual noise or flutter of the oil flow gauge. Evidence of noise, uneven oil flow, unbalanced phase current, or heating of the pump motor may require removal of the pump from the transformer. Disassembly and inspection procedures are given in the pump instruction leaflet. 2. If the transformer is equipped with air cooling, examine the fans to ensure that there is no debris covering them or between the blades. Check to make sure that each fan is operational and that the blade rotation is correct. If the cooling banks are staged, check that the proper set of fans come on for each stage. Measure line currents on the fan motor and check for any imbalances. 3. Examine the pump valves for evidence of leaking around the gland seals. Close and open the flapper-operating arm. There should be some restriction to the flapper arm movement if the packing is properly tightened. CAUTION: Do not attempt to operate the pump valve when the pumps are in operation. Always shut off the pump motor before opening or closing any valves. Failure to follow these precautions may cause equipment damage and personal injury. Tighten the gland nut if necessary to eliminate any leaks. Take oil samples from the main tank and any other oil-filled compartment, such as the load tap changer. Perform general oil quality analyses on the oil sample. Oil samples may also be taken at this time for gas-in-oil or metal particle analysis. If any test results are questionable, contact ABB. Perform insulation resistance tests on each winding to the other winding and to ground and from all windings to ground and compare with the previous test values. Measure the insulation power factor and compare with previous test values. Contact the Technical Support Section if any of the tested values vary significantly from the initial tests. 4. Examine all bushings, arresters, and all the interconnecting hardware for contamination and signs of electrical tracking. Clean any contaminated areas with a soft cloth and suitable solvent, then wipe the area dry. Perform power factor and capacitance measurement on the bushings and compare the values to the test results made when the transformer was installed. 5. If the transformer is equipped with a load tap changer, inspect the tap changer as noted in the tap changer instruction leaflet. Detailed information for the inspection procedures and the frequency of inspection is supplied as part of the transformer instruction book. 304
6. Inspect any breathers and small screen openings in pressure-relief valves or a pressure-vacuum breather to be certain they are clean and in operating condition. 7. If the transformer is equipped with a COPS oil-preservation system, remove the expansion tank breather and check for oil leakage into the bladder. The procedure for making this inspection is explained in the instruction leaflet for the oil preservation system. 8. Examine the paint finish, particularly around welded joints and on accessory items such as the radiators, coolers, and associated piping. Check for paint peeling or cracking and evidence of rust. Clean the affected areas by wire brushing, then wipe with a clean dry cloth. Paint the area with the touch-up primer and finish coat supplied in the transformer details shipment box. De-energize the auxiliary power source and inspect the control devices in the control cabinet. Remove grease, oil, or other contaminants with a lint-free cloth moistened in a nonflammable cleaning fluid. Do not soak the parts with the cleaner, but use just enough to loosen grease or dirt so that it can be wiped off. For cleaning small parts, a small paintbrush dipped into the cleaning solution is good for getting into corners and crevices. Repair or replace any broken or malfunctioning parts, tighten all loose connections, and eliminate any oil or water leaks into the compartment. More frequent inspections may be needed in heavily contaminated installations. 6.2.2 6.2.2.1
MAINTENANCE OF COMPONENTS T RANSFORMER LIQUID AND INSULATION
The task of oil in a transformer is to act as an electrical insulation and transfer heat from the transformer’s active parts into coolers. Oil acts as a good electrical insulation only as long as it is satisfactorily dry and clean. Moisture balance between the oil and the solid insulation implies that most of the moisture will gather in the paper insulation. Moisture in insulation is one of the dominant ageing accelerators. It is recommended to dry the insulation when the moisture exceeds a certain level. Drying of the insulation and oil is recommended for large distribution and power transformers since this can be technically and economically motivated. Equipment for drying transformers at site is available, and the residual moisture in the insulation will be less than 1% after drying with low frequency heating equipment. During drying, the transformer has to be de-energized. Drying time can vary from one to two weeks depending on the transformer size, amount of insulation, and initial moisture level in the insulation. Testing of oil in transformers should normally be performed 12 months after filling or refilling and subsequently annually on large distribution and power transformers. ABB offers different tests and analyses of oil samples, depending of transformer type, size, service record, and strategic importance for safe electrical supply. Testing of oil in on305
load tap changers must be performed according to the tap changer supplier’s recommendations. Taking oil samples from hermetically sealed transformers is normally not necessary, and should only be performed after consultation with ABB. The oil in this type of transformer is not in contact with the atmosphere and less exposed to moisture. Oil regeneration/reclaiming of oil may be technically and economically motivated, especially for large distribution and power transformers. Reclaiming implies filtering, de-gassing, removing ageing by-products, and adding an inhibitor if required. Reclamation of oil is performed with the transformer in service (operation). The transformer is only deenergized for a few hours when the equipment is connected and disconnected from the transformer. If the oil is in good condition, except from particles present in the oil, filtering can be recommended for removal of the particles. Often it is recommended to do both drying and reclaiming on a transformer at the same time. If this is done at the right time, i.e. before the degradation of oil and insulation has gone too far, the lifetime of the transformer can be extended by several years. 6.2.2.2
BUSHINGS AND JOINTS
The porcelain insulators of transformer bushings ought to be cleaned during service outages as often as necessary. This is particularly important for places exposed to contamination and moisture. Use recommended cleaning agents for cleaning the bushings. The condition of external conductor and bus bar joints of transformer bushings should be checked at regular intervals because reduced contact pressure in the joints leads to overheated bushings, etc. and may cause the adjacent gasket to be destroyed by the heat. An infrared camera can be used to check the temperatures in joints, bushings, etc. Maintenance of HV condenser bushings shall be performed according to the instructions given by the bushing supplier. 6.2.2.3
OFF-LOAD TAP CHANGER (DETC)
The transformation ratio can be adjusted with an off-circuit tap changer when the transformer is not energized. The control shaft of the off-circuit tap changer is brought through the cover or the tank wall. The shaft end is provided with a handle, position indicator, and locking device. When the tap changer is turned, the locking device must be secured, thus assuring that the off-circuit tap changer has been set to operating position. Off-load tap changers do normally not require regular maintenance, but it is recommended that the off-circuit tap changer is moved from one extreme position to the other a few times during service interruption. This is necessary especially when the tap changer is moved infrequently. Moving from one position to another is performed either manually by a hand wheel or by a motor drive unit. Total expected lifetime depends on the number of operations, normal current, etc. Inspection/maintenance of tap changers must only be carried out by trained and experienced personnel. See supplier’s documentation provided.
306
6.2.2.4
ON-LOAD TAP CHANGER
Maintenance of on-load tap changers should be performed according to the instructions given by the supplier of the tap changer. In addition, it is strongly recommended that only suitably trained personnel should undertake OLTC examination and maintenance. On-load tap changers have to be maintained regularly. The maintenance interval and total expected lifetime depend on the number of operations, normal current, if an oil filtering unit is provided, etc. 6.2.2.5
MOTOR DRIVE UNIT
Motor drive units have to be maintained regularly. The maintenance interval and total expected lifetime depend on the number of operations. Only trained and experienced personnel should carry out maintenance on motor drive units. See supplier’s documentation provided. 6.2.2.6
OIL FILTERING UNIT
The paper filter in the oil-filtering unit for the on-load tap changer has to be changed when pressure loss has reached approximately 4 bars on the pressure gauge. See the supplier’s documentation. 6.2.2.7
COOLERS
Coolers are cleaned by brushing inside the water tubes or by air-side vacuum cleaning when necessary. The need for cleaning is indicated by increased pressure loss, decreased temperature-difference oil/water/air in/out, increased transformer temperature, decreased water flow, etc. See the manufacturer’s documentation. 6.2.2.8
LIQUID CONSERVATOR WITH RUBBER DIAPHRAGM (COPS)
This system consists of an oil conservator with a rubber bag. It is recommended that the rubber bag be checked every two years for leaks. This is done by opening the bleeder access at the top of the bag and swabbing the inside of the bag with a stick that has a cotton cloth covering its end. Care should be taken not to puncture the bad. If there is any oil on the cotton cloth, this indicates that the bag is leaking and should be replaced. Also, it is generally recommended that the bag be replaced every ten years. The silica gel breather should be inspected on a periodic bases and the silica gel should be changed when approximately of it has changed from blue to red color (old type of silica gel) or from pink to white (new type of silica gel). 6.2.2.9
GASKETS
The gaskets of the cover and flanges, as well as between bushings and cover, are usually made of liquid-resistant vulcanized cork sheet, nitrile rubber, or silicone sealant. If the gaskets are leaking, leaks can usually be sealed by tightening the screws (bolts). When these gaskets have to be replaced, it is recommended to contact ABB. Liquid resistant rubber rings are used as gaskets for bushing bolts, shafts, and spindles. All these gaskets can be tightened and replaced from outside the tank. When tightening the gaskets, special care must be taken to prevent the breaking of screws (bolts) or else the gasket “floats away” (if not in a groove) as a result of the heavy pressure. In particular, stud nuts must be tightened very carefully.
307
6.2.2.10 6.2.2.10.1
SURFACE PROTECTION Painted surfaces
When repairing damaged paint, the points to be repainted should be cleaned from rust, dirt, and grease before priming with a zinc-rich primer prior to top coat paint. The final paint thickness should at least be equal to the original paint thickness. If major paint damage is present, it is recommended that one contact a specialized surface coating company. 6.2.2.10.2
Zinc coated surfaces
Zinc coated surfaces have a self-repairing, passivating characteristic. Small damages such as scratches do normally not need repairing. Larger areas, above 50 mm2, may need repair. After thoroughly cleaning, apply zinc-rich (between 65-69% zinc by weight, or >92% by weight metallic zinc in dry film) paint to at least the same thickness as the original zinc coating. Do not remove any original zinc during cleaning. The paint may be one-component (preferred) or two-component. 6.2.3 INVESTIGATION OF TRANSFORMER DISTURBANCES If, during operation, the protective equipment of the transformer gives an alarm or trips the transformer from the network, one should immediately investigate the reason for it. Studies may reveal whether it is a question of transformer damage or some other disturbance in the system. 6.2.3.1
RECORDING OF DISTURBANCES
If a disturbance occurs to the transformer, it is important to make a record of the following. This will be helpful to investigators in identifying the cause of the disturbance. Date and time of the occurrence Data for installed overvoltage protection Network data: Were connections or other relevant things made when the disturbance took place? What was the loading like? Are there possible relay operations which took place elsewhere in the network (e.g. ground fault relay)? Weather data (thunderstorm, rain, etc.) Is the gas relay filled with gas? Color and quality? Is the oil sooty? Thermometer readings Were coolers or tank damaged? Are there visible marks of arcing on the bushings, cover, conservator, or elsewhere? Gas-in-oil analysis for power transformers Any other observations Special mention should be made above the operation of the protective equipment on the transformer. Operation of some protective equipment such as gas relay or differential relay does not always mean that the transformer is damaged. The gas relay can operate for example when: 308
An air bubble has been left under the transformer cover. An air bubble is colorless and odorless. A short circuit current has passed the transformer. No gas bubbles. However, if the gas has color or smell, the transformer is damaged. 6.2.3.2
FAULT LOCALIZATIONS ADVICE FOR OIL-IMMERSED TRANSFORMERS
Table 6-1 provides probable causes to several disturbances to oil-immersed transformers and in some cases, possible corrective actions. In most cases, however, it may be necessary to contact the manufacturer for further advice on what actions to take. Table 6-1: Probable Causes of Disturbances to Transformers SYMPTOMS Low insulation resistance. Unexpected secondary voltage.
Non-symmetrical voltages on the secondary side.
Triggering of the over-current relay.
Triggering of differential relay during operation.
PROBABLE CAUSES Earth fault. Oil deficiency. Primary voltage. Absence of primary voltage. Tap changer or bolted links incorrectly positioned or connected. Winding rupture. Blown fuse in one phase. Bolted links incorrectly connected in one of the phases. Winding rupture. LV. installation. Nonsymmetrical load on the secondary side. No voltage applied in one of the phases on the primary side. Short circuit in the system on the secondary side. Winding rupture. Internal failure in the transformer. Failure in current transformers feeding the relay.
SOLUTIONS Contact ABB. Check installation and contact the electricity utility. Change position or connection.
Contact ABB. Change fuse. Check the connections. Check installation and contact the electricity utility. Contact ABB. Check LV. Installation.
Contact the electricity utility.
Remove the failure in the system.
Contact ABB. Contact ABB. Check current transformers.
309
SYMPTOMS Spurious triggering during operation.
Abnormal operating temperature measured by thermography.
Winding and/or top-oil thermometer alarm and/or trip.
Measurement of unexpected voltage to ground. High acoustical sound level.
Oil flow trip.
Buchholz-gas relay alarm.
310
PROBABLE CAUSES Triggering and alarm incorrectly set. Incorrect thermometer operation. Defect Ptl00 sensors or thermistors. Relays incorrect timing. Short circuit in the control system on the secondary side. Local heating at the transformer terminals. Excessive cable heating. Insufficient ventilation. High ambient temperature. Transformer overloaded. Reduced oil, water, or air circulation. Too high oil temperature. Ground failure on one phase. Supply voltage higher than presupposed. Loose accessories or elements. Reflection from walls and other elements. Low frequency. Oil circulation too low. Oil pump protection. Gas bubbles caused by local overheating.
SOLUTIONS Check settings. Check thermometer.
Check sensors or thermistors.
Check timing. Remove the failure in the control system.
Clean contact surfaces and retighten.
Undersized cables. Check ventilation of premises. Consider installation of cooling fans.
Consider load reduction or installation of a transformer with higher power rating. Check oil, water, and air circulation.
Reduce load. Remove failure. Reduce supply voltage or change position on tap changer. Retighten.
Install sound damping panels. Place the transformer in non-parallel direction to the walls. Use damping pads below the transformer. Contact electricity utility. Open valves in oil circuit. Check oil pump and protection. De-energize the transformer. If the captured gas is flammable, carry out dissolved gas analysis (DGA). Contact ABB.
SYMPTOMS
Buchholz-gas relay trip.
PROBABLE CAUSES Gas bubbles caused by incomplete bleeding Arcing in active part. Oil level too low.
Oil level indicator: alarm high level or trip low level.
Incorrect oil level.
Leakage detector alarm.
Leakage in cooler. Sudden pressure rise in tap changer compartment. Operation of tap changer failed. Sudden pressure rise transformer. Gas-detection.
On-load tap changer protective relay trip.
On-load tap changer out of step trip. Pressure-relief device trip. Gas-monitoring alarm.
SOLUTIONS If the captured gas is not flammable, bleed the transformer properly and energize.
Carry out dissolved gas analysis (DGA). Contact ABB. Adjust oil level and repair leakages. Welding on the transformer is only allowed if the transformer is filled by oil/inert gas (nitrogen). Adjust oil level. Repair leakages, if any. Welding on the transformer is only allowed if the transformer is filled by oil/inert gas (nitrogen). Repair/change the cooler. Inspection/repair of tap-changer diverter switch.
Check tap changer, interlocking, and synchronism. Carry out dissolved gas analysis (DGA). Contact ABB. Carry out dissolved gas analysis (DGA). Contact ABB.
NOTE: Contact ABB specialists before inspection, adjustment, and repair of vital parts.
311
6.2.4 INTERNAL INSPECTION The present methods of oil preservation (Sealedaire®, lnertaire®, or COPS) protect the interior of the transformer if the systems are functioning properly. Internal inspection of the transformer above the core and coils is not necessary unless results from the oil analysis indicated potential problems. Sludging of the oil, low dielectric strength, moisture in the oil, or the presence of combustible gases are conditions that may merit an internal inspection of the transformer. Severe system disturbances, incidence of through-fault, or a circuit breaker operation would also be reason for an internal inspection of a transformer. Refer to the latest version of IEEE C57.125 [164] for further direction on performing internal inspections. WARNING: BE CERTAIN THE TRANSFORMER AND THE AUXILIARY POWER TO THE CONTROL CABINET ARE DE-ENERGIZED BEFORE BEGINNING ANY OF THE WORK. GROUND ALL THE TRANSFORMER TERMINALS. FAILURE TO DO THIS MAY RESULT IN EQUIPMENT DAMAGE AND SEVERE PERSONAL INJURY. CAUTION: Do not enter any transformer until the gas in the tank is replaced by dry air. Oxygen content inside the transformer must be at least 19.5 % before entering for inside inspection. The oxygen content must always be checked. Oxygen contents less than 19.5 % may cause drowsiness and/or injury and death. If it is necessary to filter the oil, follow the proper procedures supplied by the manufacturer. 6.2.4.1
OPENING THE T RANSFORMER
CAUTION: Before opening a transformer or removing an inspection cover, be certain that the internal pressure has been lowered to atmospheric pressure. The oil level must be lower than the cover being removed. Failure to observe these precautions may cause equipment damage or personal injury. Remove the manhole cover and proceed with the internal inspection. The time the transformer is open for inspection should not exceed two hours. Dry air must be circulated in the tank during inspection. Consult the manufacturer’s instruction manual for the required airflow rates. Internal inspection and maintenance procedures will require removing and replacing oil in the transformer. Pump the oil into clean storage containers. The oil level should be kept as high as possible while the internal work is being done to minimize the exposure of the insulation and to prevent the entrance of moisture. CAUTION: Persons entering the transformer must not have loose dirt particles on their clothing. Clean cloth shoe covers or nitrile rubber overshoes must be worn by anyone entering the transformer. Failure to observe these precautions may cause an electrical failure.
312
The amount of oil removed and the length of time the transformer is open will determine the procedure for treatment of the oil. Open time starts each time the transformer seal is broken and ends when the transformer is resealed, refilled with oil, or pressurized with dry gas. The time is cumulative. Feed bottled dry air through a pressure regulator into the tank while it is open. If the insulation of the transformer has been exposed to air for some period of time during the inspection/repair of the transformer, the moisture level in the insulation will increase. Depending on increase in moisture level, on-site drying of the transformer should be considered. 6.2.4.2
T HE INSPECTION
The principle objective of the internal inspection is to locate any damage which might have occurred in service. The inside assembly drawing furnished with the transformer should be used as a guide during internal inspection. Pay careful attention to the following areas: Core: Open the core ground and measure core insulation resistance to assure proper core isolation. Multiple core grounds may permit damaging circulating currents to flow within the core. Visually inspect the accessible core components for movement, displacement or looseness of core insulation, and mechanical supports. Look for evidence of localized hotspots or discoloration on the core. Cable Leads and Bus Bars: Check leads, bus bars, and all mechanical lead supports for physical condition and electrical or thermal damage. Check alignment and lead-to-lead clearances. Tighten or replace loose or damaged hardware as required. Any evidence of overheating in the cable insulation should be investigated further. If the insulating tape is to be removed from a cable for further examination, measurements of tape dimensions, cable spacing, and clearances must be documented and the number and dimensions of papers recorded. Save the removed paper for further examination. Replace the insulation with properly dried and oil impregnated materials to the original tape build (thickness). Examine the line lead exits as they emerge from the coils for proper securing (clamps and/or cotton tape ties) and alignment. Examine regulating leads where they exit the coils and DETC lead connections at the DETC deck as above. Windings: Inspect accessible winding conductors for mechanical deformation and electrical damage. Disc windings are supported mechanically by multiple columns of pressboard radial or key spacers arranged at intervals within the winding. This 313
arrangement provides the necessary mechanical support to couple vertical winding forces (short circuit forces) into the primary mechanical winding supports and end frame structures. It is important that these vertical spacer columns are properly aligned and secure. Check the column alignment. On shell form transformers, check the inter-phase blocking to be certain that the wedges are tight and secured. Tighten any loose wedges by tapping them in place with a non-metallic mallet and secure the dowel pins at the top of the wedges. Check the winding end insulation items for proper alignment and voids between the top of the winding and the coil support. Check for any loose radial spacer blocks. Look for tilt or misalignment of the radial spacer columns, especially in the top 20% or so of the winding. A mode of short circuit motion in the outer winding is a tendency for that winding to try to “unwind” due to the repulsive forces between the outer and inner winding. The effect on the inner winding is opposite with a tendency to tighten the winding. Evidence of looseness or misalignment will require an engineering analysis as to possible corrective actions. Some retightening is possible in place but access to the inner windings is, of course, limited. Obtain samples of pressboard for DP analysis. The samples are best taken from an area near the top of the outer winding and adjacent to the conductor, as this is the area of greatest heat. Make sure a supply of properly dried and impregnated pressboard is available to replace any spacer blocks that may be removed for this analysis or found to be defective. 6.2.4.3
ELECTRICAL T ESTS
If there is evidence of internal damage, contact the manufacturer. The following tests may be made as part of the internal inspection procedure: 1. A ratio test on all windings and tap positions. 2. If the transformer is filled with oil, an insulation resistance test from each winding to all other windings and ground and from all windings to ground should be made. Record the temperature of the oil. These readings should be compared with the measurements made at the time of the initial installation. 3. Make an insulation power factor measurement and compare the values with the measurement made at the time of initial installation. The transformer must be filled with oil for this test. 4. If the transformer has an accessible core ground, disconnect the core ground lead and measure the resistance from the core to ground. Compare the value with the measurement made at the time of installation. CAUTION: Do not attempt to conduct any electrical tests if the oil has been removed from the transformer. The windings and the associated connections must be under oil even for low-voltage tests. Failure to observe these precautions may lead to equipment failure or severe personal injury.
314
6.2.5 MAINTENANCE OF BUSHINGS Little maintenance is required other than periodic checking of the oil level as indicated in the sight glass or by the gage, measuring of the power factor, and checking tile condition of the top terminals. Bushings exposed to salt spray, cement dust, and other abnormal deposits are subject to a special hazard and must be cleaned regularly to prevent flashover and corrosion of parts. Metal parts are painted for protection against the weather. Care should be taken to prevent scratching these painted surfaces. The sight glass transparency may become impaired due to reaction with atmospheric contaminants and should be cleaned regularly to deter this reaction. In the event the sight glass does become opaque, it should be replaced in order to maintain good visibility of the oil level. In the unlikely event it becomes necessary to add oil to a bushing, the fill plug in the spring assembly or the metal dome can be removed. Insertion of a clean standpipe, with an outside diameter of slightly less than the diameter of the hole will provide a means of adding small quantities (two quarts or less) to the bushing. This should return the oil to the proper level. If not, the bushing must be removed from service and returned for repair and processing. Follow the procedure outlined below for oil additions in the field. Obtain the necessary oil from the Components Division Plant, Alamo, TN 38001, or provide oil that meets the following standard: Transformer oil processed to have additional requirement of: 1. 2. 3. 4.
Moisture content less than 5 ppm Neutralization less than 0.02 mg KOH/g Dielectric breakdown min. 45 kV Power factor less than 0.05%
To prevent oxidation of the bushing oil, the air space above the oil level should be purged with dry nitrogen and the fill plug replaced immediately afterward. WARNING: DO NOT REMOVE THE FILL PLUG WHEN THE BUSHING IS AT AN ELEVATED TEMPERATURE AS THE OIL INSIDE THE BUSHING MAY BE VERY HOT AND UNDER HIGH PRESSURE. MAKE SURE THE BUSHING TEMPERATURE IS IN THE 15 TO 35°C RANGE. FAILURE TO FOLLOW THESE GUIDELINES COULD RESULT IN SEVERE PERSONAL INJURY. Due to the inconvenience and possible service interruptions resulting from bushing outages, many users have programs for Planned Preventative Maintenance. We endorse such programs and recommend: 1. Measurement of power factor and capacitance at the time of installation and repeating the measurements annually. Field measurements of power factor and capacitance can differ from measurements made under the controlled conditions in 315
the factory. Therefore, the power factor and capacitance should be measured at the time of installation and used as a base to compare with future measurements. You should contact your ABB Inc. representative for corrective action procedures if: a. The power factor doubles the original installation value; or b. The capacitance increases to 110 percent of the original installation value. The following guidelines may be used to minimize the effect of contamination and high humidity during power factor and capacitance measurements in the field. a. Clean the bushing thoroughly with a suitable cleaner to remove any contaminants that may have deposited on the porcelains and other parts during shipping or storage. After cleaning, wipe the surface dry to avoid moisture condensation. b. Clean and dry the power factor tap insulator to remove any contamination or condensation. c. Avoid making power factor measurement in wooden crates to minimize the effect of surface leakage due to moist wood. d. Provide sufficient clearance between the bushings and other objects to minimize the effects of stray capacitance. e. Do not invert bushing as this may cause entrapment of gas and result in erratic readings. f. For information on ground connections and other guidelines, please refer to the test equipment manufacturer’s Instruction Manual. 2. Examination of the top terminals for loose connection and overheating. For satisfactory operation of a bushing, it is important that the top terminals are tight at all times. If any of these parts are loose, overheating of the current-carrying joint can take place and result in damaged terminal joints. This type of overheating can deteriorate the bushing gasket seals, which could result in deterioration of the oilpaper system. Visually examine the bushings and look for discolored top terminal, external terminal connector or bolts, and the draw lead cap nut. Look for steam rising from the terminal during rain. Perform an infrared scan of the top terminals. If the above examination indicates overheating, remove the transformer from service and check the power factor and capacitance. Remove the top terminal and examine for any damage. Examine the gaskets for any sign of hardening. If any signs of overheating are present then the bushing should be taken out of service as the overheating may have affected the other sealing gaskets at the top end. If the top terminal cannot be removed, it has most likely suffered overheating damage at the threaded joint. Remove the bushing for service. If the top parts do not show any sign of overheating or damage and the power factor
316
and capacitance values are acceptable, then reinstall these parts by following the proper instructions. Use new gaskets if they show any sign of damage. Any repair of high-voltage condenser bushings should be done in the factory because of the danger of contamination to the insulation if the seal is broken. In addition, the very high vacuum and clamping pressure require the use of equipment not usually available in the field. 6.2.6 MAINTENANCE AND SERVICE OF OLTCS/LTCS 29 Table 6-2 provides some general guidelines for maintenance of the various components in a tap changes. Note that these guidelines do not supersede those provided in the manufacturers’ maintenance and service manuals. Table 6-2: General Pointers for LTC Maintenance LTC Component Control Equipment
Mechanical Components Subject to Wear
Other Mechanical Components
Tank
Current Carrying and Switching Components
Insulation Materials
Oil
29
What to Inspect/Maintain Cam and limit switches Control relays and contactors Control switches Regulating relays Control wiring and terminations Contact assemblies Drive shafts Bearings Gears and sprockets Cam and toggle assemblies Mechanism components in the air cabinets Pins and keys (check for fatigue and damage) Liquid level gauge Dehydrating breather Mechanical relief device Sudden pressure relay Oil preservation system Doors Gaskets Manholes Oil seals for shaft penetration Paint finish Welded seams Windings Cables Contacts Resistors Reactors Bushings Paper Terminal Boards Phase barriers and support structures Operating linkages Operating shafts inter-phase Carbonization Oxidation Moisture contamination Metal arcing by-products
Consequence of Improper/Inadequate Maintenance Control malfunctions can result in overheating, voltage regulation problems or runaway situations, which can cause physical damage to the LTC or transformer. Clean and inspect wiring, contactors, auxiliary switches, gauges, indicators, etc.). Excessive wear can lead to a unit failure. Check for alignment of mechanism and lubricate mechanism.
Inadequate maintenance can lead to a failure or lack of protection due to an inoperative device. Moisture in the oil accelerates the formation of oxide films, which will eventually result in contact failure. Moisture in the LTC tank can also lead to rust damage in the internal tank and mechanism parts. Inadequate maintenance can lead to leaks or internal contamination.
Can overheat due to loose connections, overload or high contact resistance.
These items can track from contamination, break, or in the case of terminal boards, leak to or from the main tank.
With the oil being in contact with everything in the oil compartment, degradation can accelerate failure of all other components. It is important to filter the oil as part of normal maintenance procedures.
See section 1.7.1 for comments on OLTC (IEC designation) or LTC (IEEE designation)
317
In addition, for OLTC types in which arcing occur in the oil, it is important to thoroughly clean the component as part of routine maintenance. Attention should be given to mechanical wear and arcing contact wear. In non-oil-arcing LTCs, it is expected that the oil will be relatively clean. It is necessary to check the wear gauge on vacuum interrupters in order to assess contact erosion. The interrupters themselves must be pull-tested to ensure they are still under vacuum and not filled with oil. Additionally, the dielectric integrity of vacuum interrupters must be tested with an AC high potential (HIPOT) tester. 6.2.7 GENERAL QUALITY INFORMATION FOR VARIOUS TYPES OF LTCS Over the years as ABB service engineers and technicians have worked on LTCs, several “tricks of the trade” have been compiled. Some of these quality tips are listed in Table 6-3 to Table 6-10. 6.2.7.1
NORTH-AMERICAN PRACTICES Table 6-3: Maintenance Quality Tips for GE LTCs
Model GE LR300, LR400, LR500
GE LR400, LR500, LR700
GE LRT-200 – Not oil-tight
Vacuum Interrupter Viewing Ports
GE LoadVac Isolating Transformer - Plugs
Potential Problem These LTCs are oil-filled under vacuum then pressurized with dry nitrogen and sealed. It is believed that over time the nitrogen blanket is absorbed into the oil, resulting in negative pressure on the tank. This interferes with vacuum interrupter operation and results in burning of the main contacts. These LTCs have an interrupter latch that is adjusted to 0.060" +/- 0.020”. This adjustment is important for good vacuum interrupter tripping action. The problem is getting the measurement feeler gauges to fit. The instruction book (GEK-29296) notes that the terminal board between the LTC compartment and the main tank is not oil tight. Water collecting between the plate and window can freeze and break the glass. This will admit water into the tap changer tank and contaminate the oil. Warning: The motor drive control circuit provides power to the isolating transformers that are part of the vacuum interrupter integrity circuit. Even with all transformer bushings isolated and grounded, 5 kV can exist at the tap selector.
GE LTC Contact Thimble
On most GE LTCs the moving contact fingers are pressurized by a spiral spring assembly. A contact thimble is a tool made from steel pipe that aids in the disassembly of the spiral spring assembly.
Resetting Lockouts on Vacuum Type LTCs
Lockouts occur for a good reason. Resetting a lockout without investigation is like playing Russian roulette. Pulling vacuum on the transformer main tank will deflect the cover and tank walls and cause
Vacuum LTCs: Don't Break Your Bushings
318
Potential Mitigation Action This problem can be eliminated by addition of a bi-directional, regulating, dehydrating breather.
Use drill bit shanks as GO/NO GO gauges. #46 and #60 drill bit shanks work with great results.
When vacuum processing on the main tank is being done, the LTC compartment must be completely sealed. Make sure that the gaskets on the cover plates over the interrupter wear gauge viewing ports are intact. To insure the safety of maintenance personnel, the plug that provides entrance into the reactor compartment must be disconnected during most maintenance procedures. See the applicable instruction manual for the location of the plug. For disassembly: Rotate the post of the assembly until its pin is vertical. Place the contact thimble over the cup washer, aligning the slot with the vertical pin. Squeeze the tool down over the post until the pin drops out. Determine why lockouts occur and make corrections before resetting. Always disconnect transformer bushings from external leads and bus prior to vacuum
Model
Vacuum Interrupters
Potential Problem displacement at the bushing terminals. Failure to disconnect the external bushing terminations could result in a strain on the bushing, causing physical damage or breaking a seal. If you ever disassemble a vacuum tap changer, remember that you must document the existing wear on the interrupter if you intend to reuse it. Failure to do so may ultimately lead to failure of the interrupter because of improper calibration.
Potential Mitigation Action operations.
When the unit is reassembled, you must use this information to recalibrate the wear indicator.
Table 6-4: Maintenance Quality Tips for Westinghouse LTCs Model Westinghouse Type UTT : Air Compartments
Westinghouse UTT : Cam Switches (Prior to UTT-A70)
Westinghouse Type UTT : Terminal Board Tracking
Westinghouse Type UTT: Conversion Kits
Potential Problem On the UTT (not UTT-A or UTT-B), the air compartment that houses the cam switch assembly has a small plate on top of it. The gasket under this plate may deteriorate with age and eventually leak. A leak at this location will cause considerable damage to the cam switch assembly. This damage is not evident to a careful visual inspection from the ground until it is too late. These units have black molded switches that deteriorate with time. They can bind up, breaking parts coupling the cam switch to the tap changer. The motor then runs until a mechanical limit is reached. This often results in expensive damage to the tap changer motor mechanism and/or reversing assembly. Tracking has caused problems on the Type UTT terminal boards. This problem has been attributed to inadequate cleaning during maintenance cycles. In early stages, carbon tracks can be cleaned with sandpaper. If the tracking is allowed to progress unchecked, a flashover could result. Many UTT models previous to the UTT-B model have experienced coking failures.
Westinghouse Type UTH: Balance Coil Leads
The balance coils on W estinghouse Type UTH LTCs have been manufactured with terminals either crimped or brazed to the leads. There is potential for the crimped leads to loosen.
Westinghouse UVT
The dehydrating breather on the W estinghouse Type UVT LTC has a plastic vent plug with a wire that when improperly maintained can prevent the breather from operating.
Westinghouse UVT , UVW
The faster operating LTCs (UVT , UVW ) have very critical timing sequences.
Westinghouse Type UVT: GE LoadVac
Certain vacuum LTCs require vacuum filling to prevent damage to the vacuum interrupter bellows due to trapped air.
Potential Mitigation Action Check your UTTs and replace the gasket before it leaks. The new gasket is 1/8" cork-neoprene approx. 6X6". ABB S#4155D20H05.
Replacement molded switches are no longer available. Therefore, if this problem develops, UTT-B style switches can be adapted for use on these tap changers.
In addition to flushing the LTC compartment, make sure you wipe the boards to remove all carbon deposits. Inspect the boards carefully for any signs that tracking has begun. Proper maintenance will minimize the possibility of tracking on the Type UTT terminal boards. UTT-B contacts were developed to eliminate this hazard and are available for all earlier models. If the coils have crimped terminals, check the terminations very carefully to ensure that they are not loose. The coils are located on the LTC transfer switches. Replacing the plastic vent with a brass filter, ABB part# 72A4551H01, will eliminate this potential problem. To set the more complicated sequences on these tap changers, timing wheels are required. If the main tank is oil-filled, do not tie the LTC tank to the main tank and pull vacuum over the main tank oil. The terminal boards will withstand full vacuum if the following conditions are adhered to: The board temperature must be less than 50°C. The pressure in the maim tank gas space must be 0 psi.
319
Model Westinghouse URS: Drive Motor
Westinghouse and ABB Controls
Potential Problem With age these motors appear to lose power and the LTC will not operate properly. Motor rewind shops often find nothing wrong with the motor. In fact the rotor running bar(s) are open at the shorting ring and restrict the development of torque. "17” link type switches in ”shorted” position on LTC controls means non-functioning circuits. Many W estinghouse and ABB LTC controls are equipped with one or more "17" sliding link type shorting switches. These are shipped in the shorted position for safety reasons.
Potential Mitigation Action New URS motors are no longer available at any price. We recommend calling other users looking for a used motor that is useable or at least can be rebuilt.
The switches must be left in the open position for normal operation. Be sure the “17” switches are open except for certain servicing operations.
Table 6-5: Maintenance Quality Tips for ASEA and Reinhausen Resistive Type LTCs Model Reinhausen Suction Tubes
ASEA & Reinhausen Resistance Type LTC
Potential Problem Entrapment of air in high-stress areas can result in a failure. Commonly missed are the suction tubes in Reinhausen tap changers. This tube connects the "S" pipe to the bottom of the diverter tank for draining. Tighten the kerosene plug before the main tank is sealed. DO NOT over-tighten, or you will crash the gasket and it will leak. Make sure the valve between the diverter compartment and main tank is open during vacuum processing and closed in service.
Potential Mitigation Action The "S' pipe is provided with a bleed screw for venting.
Table 6-6: Maintenance Quality Tips for Moloney LTCs Model Moloney Type MA & MB
Potential Problem The tap changer contacts must move in a quick jerk when they operate. This is often not the case because of a broken spring at the accelerator drum. A broken spring is not always obvious and will result in rapid erosion of the arcing contacts. Over-tightening of these spring mechanisms will always result in a broken spring.
Idem Dehydrating Breathers with Regulators
Potential Problem Some of the dehydrating breathers applied to LTCs have in-and-out breathing regulators. These regulators can become inoperative due to a number of reasons.
Hand Crank Through Every Position
Local maintenance procedures often dictate hand cranking an LTC through a few positions above and a few positions below neutral. Never operate an LTC either electrically or manually when the tank is under vacuum. Deflection of the tank can cause misalignment, and operation of the unit could result in mechanical damage. LTCs often operate within a range of taps that does not change the position of the reversing switch. If the reversing switch remains on one position over an extended period of time, the possibility increases for coking to occur.
Potential Mitigation Action A little jerk is the desired adjustment for the spring mechanism.
Table 6-7: General Maintenance Quality Tips for LTCs
Reversing Switch Contacts
320
Potential Mitigation Action A malfunctioning regulator can result in excessive pressure (positive or negative) within the LTC tank. During LTC maintenance it is good practice to verify proper operation of these regulators. The procedure should include a requirement to hand crank the tap changer through all positions raise and lower This gives you a feel for the unit through the entire range of operation. Binding, misalignment, or other problems will be easier to identify.
Periodically exercising the tap changer through all taps will break up any film or other accumulated contaminants in the vicinity of the contacts.
Idem
Oil Processing
Oil Sampling Safety
Arc-in-Oil Transfer Switch Compartments
Potential Problem This can result in overheating of the reversing switch contacts and, if not corrected in time, failure of the tap changer. Oil processing may seem like the final unimportant step. All is lost if the unit fails because air or moisture is in the wrong spot. Introduction of air bubbles through the sampling value can cause a failure resulting in equipment damage, severe personal injury, or death. Arc-in-oil transfer switch compartments are expected to be found in very dirty conditions. Often, broken parts, water, or other evidence of trouble will be seen on the tank bottom.
Gaskets
Properly applied gaskets provide better seal
Silicone Grease
A lubricant is often used on gaskets and seals. Silicone grease is a good insulator. But if the material migrates to the LTC contacts, high contact resistance and overheating could result. All transformer openings, such as upper filter press/filling openings must be sealed at all times to prevent introduction of water into the transformer tank.
Transformer Openings
Terminal Board
The design withstand pressure of the board can be different between different types of LTCs. The design withstand pressure of the board can be different between LTCs of the same type.
Potential Mitigation Action
Follow manufacturers’ instructions. If the oil is not filtered properly this to can create problems and affect the time the unit can operate until the next servicing. NEVER take oil samples with negative pressure on the tank. Before starting to wipe out, flush, and clean this compartment, do a very careful visual inspection. Starting the cleaning process too soon will destroy this valuable evidence. Always use the correct gasket for the application and maintain the proper compression. Cork-Neoprene is generally used for permanent joints, such as air-filled cabinets and installment mountings. Proper compression is 43%. Nitrile rubber is generally used where reusable gaskets are required, such as inspection covers, bushing flanges, etc. Proper compression is 33% % Compression = 100*(Gasket Thickness – Compressed Thickness)/Gasket Thickness Do not use silicone grease on load tap changers. Put gaskets on dry or use petrolatum.
It is recommended to use Teflon paste for all fittings. Check the integrity of the tank after sealing. Pressurize the tank to 3 to 4 psig with dry nitrogen. Allow the pressurized tank to stand for one to two hours. Examine the tank and fittings for leaks by applying a soap solution to all joints and pipe fittings. After determining that there are no leaks reduce the internal pressure to normal start-up limits. Before applying vacuum to any LTC with the main tank at different pressures, make sure that the terminal board is designed to withstand the pressure applied. If there are any questions, check with the manufacturer.
321
6.2.7.2
EUROPEAN PRACTICE Table 6-8: Maintenance Quality Tips for ASEA and Reinhausen Resistive Type OLTCs
Model ABB diverter switch type UC
ASEA & Reinhausen Resistance Type LTC
Reinhausen Suction Tubes
Potential Problem Correct diverter switch insert.
Tighten the kerosene plug before the main tank is sealed. DO NOT over-tighten, or you will crash the gasket and it will leak. Make sure the valve between the diverter compartment and main tank is open during vacuum processing and closed in service. Entrapment of air in high-stress areas can result in a failure. Commonly missed are the suction tubes in Reinhausen tap changers. This tube connects the "S" pipe to the bottom of the diverter tank for draining.
Potential Mitigation Action After the diverter switch is placed in the housing the OLTC should be maneuvered 3 times before the cover is put on.
The "S' pipe is provided with a bleed screw for venting.
Table 6-9: General Maintenance Quality Tips for OLTCs Part Pressure relay or oil flow indicator Dehydrating Breathers with Regulators
Hand Crank Through Every Position
Reversing Switch Contacts
Oil Processing
Dielectric withstand
Oil Sampling Safety
Breaking Compartments
322
Potential Problem A trip from the pressure relay or the oil flow indicator can be caused of a severe fault Some of the dehydrating breathers applied to OLTCs have in-and-out breathing regulators. These regulators can become inoperative due to a number of reasons. Local maintenance procedures often dictate hand cranking an OLTC through a few positions above and a few positions below neutral. Never operate an OLTC either electrically or manually when the tank is under vacuum. Deflection of the tank can cause misalignment, and operation of the unit could result in mechanical damage. OLTCs often operate within a range of taps that does not change the position of the reversing switch. If the reversing switch remains on one position over an extended period of time, the possibility increases for coking to occur. This can result in overheating of the reversing switch contacts and, if not corrected in time, failure of the tap changer. Oil processing may seem like the final unimportant step. All is lost if the unit fails because air or moisture is in the wrong spot. Dirty oil that contains moisture will have a reduced dielectric withstand Introduction of air bubbles through the sampling value can cause a failure resulting in equipment damage, severe personal injury, or death. Breaking compartments are expected to be found in very dirty conditions.
Potential Mitigation Action Open the tap-changer compartment were the braking takes place for inspection before the tapchanger is put in service again A malfunctioning regulator can result in excessive pressure (positive or negative) within the OLTC tank. During OLTC maintenance, it is good practice to verify proper operation of these regulators. The procedure should include a requirement to hand crank the tap changer through all positions raise and lower This gives you a feel for the unit through the entire range of operation. Binding, misalignment, or other problems will be easier to identify.
Periodically exercising the tap changer through all taps will break up any film or other accumulated contaminants in the vicinity of the contacts.
Follow manufacturers’ instructions. If the oil is not filtered properly this to can create problems and affect the time the unit can operate until the next servicing. Check the dielectric strength of the oil. This test is much better then only checking the moisture in oil content. NEVER take oil samples with negative pressure on the tank. Before starting to wipe out, flush, and clean this compartment, do a very careful visual inspection.
Part
Potential Problem Often, broken parts, water, or other evidence of trouble will be seen on the tank bottom.
Oil filters
Make sure that the oil filter operates in the correct direction It is important that all joints are tight in the oil filter circuit.
Gaskets
Properly applied gaskets provide better seal
Silicone Grease
A lubricant is often used on gaskets and seals. Silicone grease is a good insulator. But if the material migrates to the OLTC contacts, high contact resistance and overheating could result. All transformer openings, such as upper filter press/filling openings must be sealed at all times to prevent introduction of water into the transformer tank.
Transformer Openings
Terminal Board
The design withstand pressure of the board can be different between different types of OLTCs. The design withstand pressure of the board can be different between OLTCs of the same type.
Potential Mitigation Action Starting the cleaning process too soon will destroy this valuable evidence. A wrong operation direction can cause air bubbles to enter the bottom in the tap-changer and create failures A leak in the oil circuit can cause that all oil is drained from the tap-changer resulting in a failure. Always use the correct gasket for the application and maintain the proper compression. Cork-Neoprene is generally used for permanent joints, such as air-filled cabinets and installment mountings. Proper compression is 43%. Nitrile rubber is generally used where reusable gaskets are required, such as inspection covers, bushing flanges, etc. Proper compression is 33% % Compression = 100*(Gasket Thickness – Compressed Thickness)/Gasket Thickness Do not use silicone grease on load tap changers. Put gaskets on dry or use petrolatum.
It is recommended to use Teflon paste for all fittings. Check the integrity of the tank after sealing. Pressurize the tank to 3 to 4 psig with dry nitrogen. Allow the pressurized tank to stand for one to two hours. Examine the tank and fittings for leaks by applying a soap solution to all joints and pipe fittings. After determining that there are no leaks reduce the internal pressure to normal start-up limits. Before applying vacuum to any OLTC with the main tank at different pressures, make sure that the terminal board is designed to withstand the pressure applied. If there are any questions, check with the manufacturer.
Table 6-10: Maintenance Quality Tips for Vacuum OLTCs Model Resetting Lockouts on Vacuum Type OLTCs Vacuum OLTCs: Don't Break Your Bushings
Vacuum Interrupters
Potential Problem Lockouts occur for a good reason. Resetting a lockout without investigation is like playing Russian roulette. Pulling vacuum on the transformer main tank will deflect the cover and tank walls and cause displacement at the bushing terminals. Failure to disconnect the external bushing terminations could result in a strain on the bushing, causing physical damage or breaking a seal. If you ever disassemble a vacuum tap changer, remember that you must document the existing wear on the interrupter if you intend to reuse it. Failure to do so may ultimately lead to failure of the interrupter because of improper calibration.
Potential Mitigation Action Determine why lockouts occur and make corrections before resetting. Always disconnect transformer bushings from external leads and bus prior to vacuum operations.
When the unit is reassembled, you must use this information to recalibrate the wear indicator.
323
7 REPAIR, REFURBISHMENT AND RETROFIT Power transformers are the most important components of electrical energy supply networks. Although these components have high reliability, failures can occur due to external factors such as short circuits in the grid. Failures can also occur due to ageing effects of the active part, especially the insulation system, or ageing of important accessories such as bushings or on load tap changers. . A theoretical failure statistic versus age of various types of transformers is shown in Figure 7-1. Figure 7-2 shows the contribution of various components in/on a transformer to the failure rate Failure rate (%)
Probability of Failure
100% 90% 80%
Generator transformer Net transformer
70%
Industrial transformer
60% 50% 40% 30% 20% 10% Years
0% 0
20
40
60
80
Figure 7-1: Bath-tub failure rate curve
Figure 7-2: Occurrence of failures in different parts of power transformers
In case of failure, the first action is to identify the type of failure. The aim is to localize the failure itself as well as its root cause. In order to fully understand the reason for the defect, it is usually necessary to investigate if any abnormalities had occurred in the grid prior to the failure. The investigation into the failure location inside the transformer is performed using different methods of condition assessment. These have been explained in greater detail in other sections of this handbook.
324
After performing different measurements at site, it is necessary to decide whether the repair should be performed in a repair factory or at site. In cases with minor damage, especially in case of a failure related to connections, bushings or tap changers, the repair should be done at site. In cases with more extensive damage or when windings are involved, several criteria need to be considered. These include the practicality of transporting the unit, the transportation time and risk, the consequences of non-delivery of energy during the repair period and redundancy of the failed units i.e. availability of a spare unit. Several years ago, ABB started to develop processes to perform major repairs, including replacement of windings and repair of the core at site. To date a total of about 200 units, including Utility, Industrial and HVDC transformers and reactors have been repaired. In many of these cases the repair included an upgrade of the unit to a higher rating. The trademarked name for the ABB solution for repair at site is TrafoSiteRepairTM and is marketed globally. TrafoSiteRepairTM is often the preferred alternative if the distance to a repair factory is considerable. In such cases, the total time that the transformer is out of service can be reduced by eliminating the long and risky transport of the transformer to a repair facility. Additionally, TrafoSiteRepairTM could be the preferred method of repair because of difficulties in acquiring transportation authorizations by road or rail. It needs to be mentioned that a refurbishment or “preventive” repair can be beneficial if no failure has occurred, in cases where the ageing of the active part has reached a stage where the continued reliability of the transformer is unacceptable. The TrafoSiteRepairTM process is very similar to that in a repair factory. Therefore, all critical elements of site repair have the same quality requirements as for factory repair and should be performed with the same methods and tools where feasible. To perform the different phases of repair operations at site, ABB sends experienced and skilled personnel to the site. The staffs at the site have the same skills as factory staffs performing the same operations plus the additional experience of performing sophisticated operations in the field.
7.1
PREPARATION PHASE
Before the repair can be performed, components of the transformer such as bushings, etc. should first be removed. Factory repair: The transformer has to be prepared for transportation to a repair shop, where dismantling of the active part will be performed. If necessary, an additional high voltage test is performed before untanking the active part in order to investigate the failure and gain more information on the nature of the damage as well as its location.
325
Site repair: A site repair usually does not require extensive transportation of the transformer. If a suitable workshop is within close proximity of the transformer it may be used for the repair. If not, a temporary workshop is needed and the transportation path for the transformer to the temporary workshop has to be planned. The method for hauling the transformer to the temporary workshop is chosen based on available means at site and the location of the workshop. If a spare foundation may be used as a base for the workshop, means for hauling the transformer may already be available. If a temporary workshop is set up, all required tools and equipment will need to be shipped to the site to be available in time for the different phases of the repair. A more detailed description of how a temporary workshop is set up is described below in the section “Facilities for site repair”.
7.2
UNTANKING AND DISASSEMBLY OF ACTIVE PART
After draining the oil, the active part can be untanked and disassembled. If required, a detailed inspection of the active part can be performed. Factory repair: In a factory repair, the active part is removed from the tank using a fixed overhead crane with a high lifting capacity.
Figure 7-3: 500 ton crane inside a workshop
326
Site repair: If an overhead crane is not available or if the crane does not have enough lifting capacity, special lifting equipment is brought to the site to untank, disassemble and reassemble the active part.
7.3
REPAIR OF THE TRANSFORMER
After the final decision on the scope of the repair, all required materials and components are ordered from qualified suppliers. While waiting for these supplies the work proceeds to remove all damaged parts. It might be necessary to remove all windings from the core after the upper core yoke is removed. If the winding is to be replaced, the new windings are manufactured in a transformer factory according to the design specification for the transformer.
Figure 7-4: Vertical and horizontal winding machine
Factory repair: For a factory repair, the delivered parts are installed upon receipt. In case of a winding replacement, the windings are dried and assembled on the core using the fixed crane. If repair of the core is required, the core is placed in a horizontal position on a core stacking table. This allows the repair or exchange of core sheets to be performed. Site repair: For a repair based on the TrafoSiteRepairTM,concept all windings and other components are supplied from one of the ABB transformer factories. Before shipment to site, windings and insulation components are dried using a vapor-phase process. During transportation, the windings and insulation components are stored in enclosures supplied with dry air, so they are ready for installation at site. To keep the insulation dry during the repair and assembly of the active part, the windings and insulation parts are sealed and supplied with a continuous flow of dry air. If repair of the core requires the core to be placed in a
327
horizontal position, a mobile core stacking table is brought to the site. Mobile lifting equipment is used to tilt the core stacking table.
7.4
ASSEMBLY AND TANKING OF THE ACTIVE PART
The assembly and tanking of the active part is performed in the same way for both factory repair and site repair. However, if an overhead crane is not available during site repair, special lifting equipment is brought to the site. After the assembly of the active part, various low voltage tests on the active part are performed in order to guarantee quality.
7.5
DRYING Factory repair: After assembling, the whole active part is dried in a vapor phase system, in which vacuum is applied with a certain time and temperature profile. In addition, the active part is surrounded by kerosene vapor, which is why this process is called vapor phase drying.
Figure 7-5: Vapor phase chamber
Site repair: After the tank cover has been replaced and sealed, the transformer is put under a low overpressure of dry air to avoid any possible contamination (mainly moisture) until the drying phase begins. There are different drying methods that may be used for drying the transformer at site: o The most common method is the hot oil circulation and vacuum process. It is a proven method that provides a good quality of drying within a reasonable processing time (typically between two to 4 weeks). The drying time can be reduced by including a hot oil spray system in the process. In both cases, the transformer tank must be “vacuum tight”. If this is not the 328
case, then the quality of the drying (remaining moisture in the solid insulation) will be limited and the required drying time will be significantly extended. o The most efficient method in respect of drying time and quality of drying is the Low Frequency Heating method (LFH) in combination with hot oil spray. The windings are heated by driving a low frequency current through the high voltage winding of the transformer while the low voltage winding is short circuited. Simultaneously hot oil is sprayed on the outside of the winding and on the insulation parts. The drying is performed under periods of heating and different levels of vacuum to achieve the most efficient drying. The advantage of this process is that a Low Frequency (LF) current heats the transformer coils from the inside, while the hot oil simultaneously heats the outside insulation. Since the windings and the insulation parts were dried using the vapor phase system and handled under dry air during the storage and installation periods, the moisture content should be quite low. The total drying time is typically one to a maximum of two weeks. o If an LFH plant is not available, simple hot oil spray or hot oil circulation may be used. However, these processes may considerably extend the drying period.
7.6
FINAL ASSEMBLY
The final assembly of the transformer in the field uses the same process as in the factory. If the high voltage test performed after the final assembly is successful, the transformer does not need to be disassembled again for transportation since it is already at the site. The welding of the cover is, however, normally done after the test. If the repair was performed in the factory then the transformer is typically disassembled and prepared for shipping. This may involve the removal of the bushings and other accessories and draining all the oil from the tank. The process is the same as is used for the shipment of new transformers from the factory.
7.7
HIGH VOLTAGE TESTING [165]
As a final quality control the last step of a repair is the high voltage test, in order to prove that the insulation can be stressed with voltages that are higher than in operation. The tests are performed according to IEC or ANSI-Standards, in which the test procedures and test levels are described. Factory repair: A repair factory is equipped with a high voltage test field for performing mainly the following most important high voltage tests: - Applied voltage test - Induced voltage test with partial discharge measurements - Lightning impulse test - Determination of no load losses - Determination of load losses 329
Site repair: After the site repair the most important high voltage (HV) tests are performed using a mobile test field. The system is installed in a 40 feet container and allows performance of the following high voltage tests for transformers up to 600 MVA: - Applied voltage test - Induced voltage test with partial discharge measurements - Determination of no load losses (depending on the transformer characteristics) Additionally, impulse tests and determination of load losses can be performed using modular extensions in additional containers, but this has not been used to date because of the high costs involved. Further, dissolved gases in oil are monitored during the first year after repair. The testing process described above has proven to be an effective way of testing transformers repaired at site in order to ensure a high standard of quality. Over the last fifteen years, ABB has successfully repaired more than 200 transformers at site without any subsequent failure in operation.
7.8
QUALITY PLAN [166]
The repair processes in both workshop and at site follow documented procedures that are described within ABB’s quality system. This is adapted from the quality process used for new transformers manufactured by ABB.
7.9
FACILITIES FOR SITE REPAIR
A site repair of a power transformer based on the TrafoSiteRepairTM concept should be performed indoors, in a facility that makes it possible to maintain a controlled environment with the required levels of cleanliness and orderliness. The facility should, as far as possible, allow for performance of all critical steps of the repair inside the facility. This includes the heavy lifting of the active part and windings for core type transformers. For very large shell type transformers, it may be difficult to handle the lifting of the phases without opening the roof of the repair facility. For such cases, the timing of those activities will be dependant upon the weather conditions. In addition, special measures have to be taken to protect the phases from moisture and contamination. Based on experience gained within the ABB service centers that have performed site repair projects, it is estimated that for approximately 50 % of repair projects a facility is available at the repair site, normally a maintenance shop owned by the customer. For the remaining 50 % of the projects it is necessary to set up a temporary facility. When a permanent facility is available at site, the repair area has to be separated from the rest of the facility in order to maintain cleanliness requirements.
330
To keep the repair time as short as possible the set up time for the facility should be minimal. 7.9.1 TEMPORARY WORKSHOPS If no suitable building is available at the site and a temporary workshop is required, there are various alternatives available for construction of a temporary facility. ABB has mainly used two alternatives. 7.9.1.1
STEEL BUILDINGS
Large halls composed of a steel structure and a cladding of corrugated sheet steel or aluminum can be constructed. This type of building is primarily used when more than one transformer will be repaired at the same site. The advantage with this type of building is that it can be made to fit exactly the need and built by local constructing companies practically anywhere in the world. It can also be designed to withstand severe weather conditions. In some cases the steel buildings used for site repair have been left at the site for future use.
Figure 7-6: A steel building used as temporary workshop by ABB in Brazil 7.9.1.2
LARGE T ENTS
Large rigid tents consisting of a steel structure and claddings of a flexible sheet material such as PVC are available to buy or rent through both global and local suppliers. These types of tents may be set up in a very short time, normally less than a week. They are also designed to withstand severe weather conditions such as strong winds and snow load.
Figure 7-7: Typical tent structure that may be used as temporary workshop
331
7.9.1.3
FOUNDATION FOR A T EMPORARY WORKSHOP
A temporary workshop needs a foundation that is designed to handle the weight of the transformer and built according to the local regulations. In some cases there may be a spare transformer foundation available to build the facility on. The spare transformer foundation may also have a system to handle the oil. However, it is recommended that the oil be drained from the transformer before it is moved to the repair facility. An advantage of using a spare transformer foundation is that it may already have the means for hauling the transformer. 7.9.2 FACILITIES FOR HEAVY LIFTING The major heavy lifting during repair of a core type transformer is the lifting of the active part during untanking and tanking of the transformer. The active part of the largest transformers can weigh up to 400 metric tons. In the factory an overhead crane is used to do the lifting. At a site, where an overhead crane is not available or does not have the required capacity, mobile lifting systems are available from global suppliers. For smaller transformers, the lifting may be performed with a mobile crane. The lifting of windings required for disassembly and reassembly of the active part can usually be performed using a mobile crane.
Figure 7-8: Active part assembled by using a mobile crane for lifting of winding
7.9.3 MOISTURE CONTROL A dry air generation system is normally installed at the temporary workshop to keep the insulation dry during assembly of the active part. It also guarantees a permanent overpressure in the tent to avoid any possible contamination due to either moisture or dust. In addition, the windings and all insulation parts are sealed from the ambient air and continuously supplied with dry air. 332
7.9.4 OIL PROCESSING Required oil processing equipment including tanks is brought to the site. 7.9.5 DRYING EQUIPMENT As described above, different processes for drying may be used. The required equipment for the chosen process is shipped to the site in time for the drying phase of the repair. 7.9.6 HIGH VOLTAGE TEST EQUIPMENT ABB uses a mobile high voltage test field based on state of the art technology (see Figure 7-9), making it possible to perform high voltage tests at site for practically all types and sizes of transformer. The system used is the worldwide first mobile HV test system for transformers based on a frequency converter technique in contrast to conventional motor-generator sets, which are quite heavy and therefore not easily transportable. Motor-generator sets need extensive maintenance and are usually less robust than frequency converters based on semi-conductor techniques. The frequency converter system also provides more flexibility for testing at different voltages and frequency ranges. The mobile high voltage test field is shipped to the site during the testing phase.
Figure 7-9: The high voltage mobile test system upon arrival at a customer site
333
8 ENVIRONMENTAL ASPECTS [167] Environmental consciousness has increased manifold in today’s society. Meeting the environmental requirements in the design of new substations and in the renovation and maintenance of existing substations is an increasing challenge for the electricity industry. Successful resolution of community acceptance issues and compliance with environmental regulations may become major milestones in the process of erecting new or renovating existing substations. In their increasing efforts to satisfy customers and to gain community acceptance for their facilities, utilities have employed various environmental management systems to address these important issues. They have also employed impact evaluation studies to assess the impact of substations on the environment. Most efforts to date have focused on the environmental impact of new substations. However, existing substations have had and may continue to have a significant impact on the environment, if they are not adequately addressed. Furthermore, the impact of existing substations on the environment may be growing due to changes in the surrounding land use, operation of ageing equipment, changes in environmental laws and regulations, and changes in the community perception of substations. Sometimes the environmental aspects are directly related to the safety of people, mainly in the case of fires that produce fumes and toxic gases.
8.1
CONTAMINATION OF OILS WITH PCB (POLYCHLORINATED BIPHENYLS)30
8.1.1 GENERAL The following trade names have been used to identify fluids (askarels) that contain polychlorinated biphenyls (PCB): Aroclor, Chlophen, Pyralene, etc. They are a group of synthetic, fire-resistant, chlorinated aromatic hydrocarbons used as electrical insulating liquids. Under arcing conditions in these fluids, any gases produced consist mostly of non-combustible hydrogen chloride with lesser amounts of combustible gases. Transformers containing PCB contaminated oils shall not be considered waste whilst in service. Should the oil became accidentally contaminated, there are several processes and techniques available for both on-site and off-site decontamination of PCB contaminated oils. These processes are based on chemical reactions between PCBs and a reagent to remove the chlorine present. All PCB decontamination methods, either off-site or on-site, shall be applied by skilled companies complying fully with local regulations. Off-site decontamination techniques are limited because of concerns over the safe transportation of contaminated equipment and liquid to an authorized oil processing facility. Moreover, such processes are subject to local regulations.
30
IEC 60422-2005 - Mineral insulating oils in electrical equipment – Supervision and maintenance guidance
334
Warning In some countries, the risk of presence of high concentrations of PCB in transformer oils still exists. Therefore, it is necessary to verify the concentration of PCB in all apparatus before treating the oil with an oil treatment machine which may be used for the treatment of oil of new transformers. Note that by legislation, new transformer oil is supposed to be free of PCBs. 8.1.2
DEHALOGENATION PROCESSES USING SODIUM AND LITHIUM DERIVATIVES
These processes are typically applied in batch and use reagents based on metallic sodium, sodium hydride, lithium hydride and additives, for the dehalogenation of PCB in the oil. This type of process is typically run under pressure and medium to high temperature (150 °C – 300 °C). This temperature is higher than the flash point of the oil (140 °C – 150 °C) and therefore introduces safety risks. WARNING Proper measures shall be taken to minimize the risk of fire or explosion, especially in the presence of wet oil. 8.1.3
DEHALOGENATION PROCESSES USING POLYETHYLENEGLYCOL AND POTASSIUM HYDROXIDE This process, developed to overcome the problems associated with metallic sodium, uses a liquid reagent based on polyethyleneglycol (PEG) and an alkaline metal hydroxide such as potassium hydroxide (KOH). This type of process, which is run at temperatures of 130 °C – 150 °C, has a limited efficiency on some types of contaminants (e.g. Aroclor 1242). 8.1.4 DEHALOGENATION IN CONTINUOUS MODE BY CLOSED CIRCUIT PROCESS This process uses a solid reagent consisting of a high molecular weight glycol mixture (a mixture of bases and a radical promoter or other catalyst) for chemical conversion of organic chlorine to inert salts, on a support made of high surface area particulate matter. This process normally runs at 80 °C – 100 °C and has the capability to decontaminate equipment on-site through continuous circulation of the oil in a closed system (without draining the oil or using auxiliary tanks). This uses the solvent capability of the oil for continuous extraction of PCBs from solid materials inside the equipment.
8.2
ELECTROMAGNETIC COMPATIBILITY (EMC)
8.2.1 INTRODUCTION Electromagnetic fields (EMF) are an important issue to consider when assessing the environmental impact of existing transformers in installations or substations. Regulations and guidelines concerning EMF levels may exist, mainly for new installations. However, when installations or substations are extended or modernized, regulations regarding EMF levels would then come into consideration. Typical sources of electric and magnetic fields in installation and substations include: transmission and 335
distribution lines entering and exiting the substation, buswork, transformers, air-core reactors and switchgear. 8.2.2 METHODS TO REDUCE EMF LEVELS IN EXISTING SUBSTATIONS For an existing transformer, when EMF levels need to be addressed, it is usually recommended that measurements be taken of both electrical and magnetic fields. However, in both enclosed and open-air substations, the highest magnetic field levels can be found directly underneath or above the incoming and outgoing overhead or underground lines. Although the reduction in EMF levels within existing substations cannot be done without costly intrusive and extensive modifications, there are common techniques in practice. Reductions in electric field levels can be accomplished by: Increasing the height of the buses Decreasing the phase spacing and bus diameter Lowering the operating system voltage, and Making use of vegetation as shielding
Methods for reducing magnetic field levels include: Increasing the distance from the sources Optimizing phase configuration to achieve magnetic field cancellation Minimizing currents by increasing operating system voltages Minimizing power transfers, and Providing reactive load transfers and/or alternate line power flow paths
In addition, magnetic field levels can be further reduced by balancing currents on lines and by shielding conductors and buses. The health effects of electromagnetic fields have been studied extensively over the last 40 years. The results of these studies have been inconclusive and there is no general consensus on the possible adverse health effects of these fields. In spite of this, the electrical utility industry has taken a decidedly proactive stance and is committed to reducing public exposure to EMF. This applies mainly to the area of distribution transformers.
8.3
AUDIBLE NOISE
8.3.1 INTRODUCTION There are two major sources of noise in substations: the continuous noise generated by the operation of power transformers and reactors and the momentary noise produced by the operation of high voltage circuit breakers or load interrupters. Other noise sources in substations include Corona discharges and arcing during operation of switches. By far the most important source of noise is that generated by power transformers and reactors. These pieces of equipment generate a continuous humming noise that might be disturbing for communities living near the substation. Expansion of urban and
336
suburban areas in the last couple of decades has resulted in some of these substations being located within and in direct proximity to residential areas. In these new situations, the noise level generated by the equipment in the substation might not be found acceptable and corrective measures are often required to reduce the level of noise to acceptable levels. In addition, public concern regarding industrial noise has increased over the past few decades and new, more stringent regulations and bylaws have been introduced to limit noise levels in residential communities. 8.3.2 8.3.2.1
BACKGROUND CHARACTERISTICS OF T RANSFORMER NOISE
The primary source of noise from transformers is due to magnetostriction of the iron core. A secondary but much lower source arises from the electromagnetic forces between the individual turns of the windings. The principal frequency of the resulting vibration is twice that of the supply frequency (100/120 Hz) and, because the magnetostriction characteristic of iron is nonlinear, harmonics (200/240, 300/360 and 400/480 Hz) are also generated. The harmonic content of the noise plays a major role in contributing to the annoyance of the noise as perceived by individuals. The flux density is controlled by the magnetizing current and the total noise output is proportional to the exciting voltage times the magnetizing current. Consequently, the noise output remains essentially constant for a given voltage even though unpredictable variations in the radiation pattern occur with time. The noise output is normally unaffected by load. 8.3.2.2
PROPAGATION OF SOUND
In an unobstructed outdoor environment, the energy from a point source of sound propagates as according to the "inverse-square law" - this means that as the sound spreads outwards from the source, the energy decreases as the square of the distance. Thus for each doubling of the distance, the sound energy decreases by a factor 4, i.e. 6 dB. This theoretical attenuation usually applies quite well for distances up to approximately 150 m. Beyond this distance it is subject to the effects of ground and atmospheric absorption, inhomogenities associated with turbulence, moderate and high winds and temperature gradients. In addition, the increase in noise level propagated due to temperature inversion seldom remains constant. It normally varies with time over periods ranging from a few seconds to a few minutes due to changing conditions in the atmosphere. This modulation of the noise, particularly of the type generated by transformers, is another factor that increases the subjective reaction as compared to that from a steady noise source. 8.3.3 CRITERIA FOR COMMUNITY NOISE LEVELS There are a wide variety of regulations and bylaws in use in different corners of the world to control for audible noise levels in the community. Some of the larger cities have quantitative regulations of varying degrees of complexity. Generally, transformer noise should be slightly audible during the quietest period of the day and inaudible during the rest of the day when people are normally active. Experience shows that transformer noise levels 10 dB above the lowest ambient frequency result in complaints from the community while a 5 dB increase does not normally produce a response. A 5 dB 337
cushion, however, is considered to be the minimum required to accommodate the temporal variations in radiation pattern and the atmospheric effects previously discussed. 8.3.4 REQUIREMENTS Existing substations have to comply with newer, more restrictive noise regulations sooner or later, especially when complaints are filed about the elevated noise level of a certain substation. Methods used to mitigate noise problems in existing substations will depend on factors such as: a) The level of noise exceeding the approved level for the area in which the substations is located b) The economics of various solutions – the analysis has to take into account the life cycle cost of the installation, as well as, the benefits the utility may acquire by addressing concerns of the community c) Operational and maintenance implications of installing a certain sound mitigation solution around transformers and/or reactors d) Issues related to the ability to construct the sound mitigating solution (can it be done with the equipment live, is there a need for rerouting of power and/or control cables, etc.) Table 8-1 gives typical noise limits specific to particular settings. Table 8-1: Typical Noise Limits Location Purely Residential
Mixed Residential
Commercial/ Industrial
Industrial
Time of Day Day Early Morning/ Evening Night Day Early Morning/ Evening Night Day Early Morning/ Evening Night Day Early Morning/ Evening Night
Noise Limits 45-50 dB 40-45 dB 35-45 dB 50-60 dB 45-50 dB 40-50 dB 60-65 dB 55-65 dB 45-55 dB 65-70 dB 60-70 dB 55-70 dB
8.3.5 METHODS OF SUBSTATION NOISE CONTROL The first step in the process of mitigating a noise problem at an existing substation is to determine the noise reduction required at the point of the recipient. This is usually the most critical location on the property line of the station. Noise reduction is the total level of untreated transformer noise minus attenuation with distance minus lowest ambient level or the permitted community level. Once the noise reduction has been established, 338
the most appropriate measures for producing the required noise reduction must be selected. The following represents the most widely used methods available for minimizing noise levels created by transformers at existing substations. The newer methods are described in greater detail. a) Replacement of Existing Old Transformers with new units with low noise levels. Manufacturers have made significant steps toward reduction of basic noise levels of power transformers and reactors. Replacement of an old unit with a new, low noise unit might prove to be the best solution if the replacement is dictated also by other factors (end of life of transformer, history of failures of the unit, chronic oil leaks, etc.). Levels up to 10 dB below the standard levels are practical and the costs range up to 1 percent of the cost of a standard transformer per decibel depending on the size. Higher reductions are not normally economically viable compared with other methods of control. b) Landscaping: Planting of tall trees on the outside of the fence line in the direction of the desired noise reduction is one of the solutions that would provide moderate noise reduction. If space is available around an existing substation, landscaped soil berms covered with grass and bushes on the crown is another noise reducing solution. This solution also provides a means of blending the substation into the community. c) Simple Open Roof Barriers: The level of noise reduction obtained with this solution depends on the height of the barrier above the transformer and its relation to the elevation of the neighbourhood that is targeted for noise reduction. Typically, 8 to 13 dB noise reduction could be achieved with such a barrier. The barrier may be constructed from a variety of materials, such as steel plate, cement asbestos sheet or masonry, etc. d) Sound Enclosure: This enclosure is installed around all four sides of a transformer. Depending on the level and directions of noise reduction needed, the enclosure can be with or without a roof. The roof of such a sound enclosure has to be custom designed for a particular transformer. Adequate space must be provided between the tank of the transformer and the walls of the enclosure for maintenance staff to pass. Also, sufficient space must be provided to enable the opening of the doors of the control box of the transformer. Reductions of up to 20 dB are possible if proper attention is given to the details of the construction. Coolers of the transformer are installed outside the enclosure to ensure the design rating of the transformer is not compromised. e) Low Frequency Sound Insulation Panel (LFSI): An effective countermeasure for an existing shunt reactor and/or transformer is the Low Frequency Sound-Insulation Panel (LFSI panel), designed to minimize low frequency noise production. The new soundproof panel is composed of sound absorbing materials and a sound-insulation
339
board with additional weights that are necessary to reduce the vibration created by the sound-insulation board. f) Tight Fitting Enclosure: This solution comprises a total steel plate enclosure (including a steel roof) around the transformer. This solution is commonly known as the “tea cozy” solution. In this arrangement, the walls are installed close to the tank with typically a 10 to 15 cm gap filled with acoustically absorbing material. Strategically placed doors allow access to the control box of the transformer, the tap changer, etc. Such enclosures could provide a noise reduction of up to 22 dB. g) Active Sound Cancellation: This method uses a separate sound source to cancel the transformer noise. This noise source is produced via an amplifier and speaker system and is equal in amplitude and opposite in phase to the unwanted noise. ABB has demonstrated that this method is feasible and especially efficient to reduce low frequency tones. It may provide useful reductions in the range of 10 dB [168].
8.4
RELEASE OF INSULATING OIL
8.4.1 INTRODUCTION Older substations were built under environmental regulations that were less stringent than present regulations. Often there were no requirements to contain any potential leaks of electric insulating liquids within the substation perimeter. Neither were there limits to the level of contaminants in the drainage systems of these substations. Containment and control of oil spills at substations are becoming an increasing concern for most electric utilities. Beyond the threat to the environment and potential legal consequences, clean-up costs associated with oil spills could be increasingly unacceptable. The probability of an oil spill occurring in a substation is very low. However, certain substations, due to their proximity to ground water resources, open water or designated wetlands, the quantity of oil on site, surrounding topography, soil characteristics, etc., have or will have a higher potential for discharging harmful quantities of oil into the environment. 8.4.2 USE OF SYNTHETIC ESTER Petroleum based insulating fluids have been in use in transformers for over a century. It is estimated that 8 to 10 billion gallons of transformer oil are in service around the world today. Due to its excellent performance, availability and low cost, mineral oil has little competition. Concern over fire safety resulted in the use of high temperature mineral oils in critical applications. A small percentage of transformers use synthetic fluids such as silicone and synthetic polyalphaolefin (PAO) hydrocarbon fluids. In recent years, mainly due to environmental concerns, the utilities have been interested in a fully biodegradable insulating fluid particularly for use in transformers located in areas where oil spills would contaminate water. The natural hydrocarbon fluids are only approximately 30% biodegradable; silicone fluid has very low biodegradability. PAOs can have as much as 70% biodegradability. An ester fluid developed from
340
pentaerythritol and saturated carboxylic acids (examples: Midel® 7131) is fully biodegradable, and has found application in traction and power transformers. 8.4.3 USE OF NATURAL ESTER [169] Vegetable oils are plentiful in nature, and therefore should be considered ideal raw materials for a fully biodegradable insulating fluid. However, a literature search would show that vegetable oils were considered in the past only for capacitor use. Capacitors require gas absorbing fluids; hence synthetic aromatic fluids are commonly used. Vegetable oils, though not aromatic, have unsaturation, hence gas absorbing properties. The development of a transformer fluid from vegetable oils caught the attention of researchers only in the 1990s. ABB has developed a vegetable oil based transformer fluid under the name of BioTemp. Several technical papers have been published on this fluid since 1997. The new fluid has an obvious advantage over conventional transformer fluids for use in locations where oil spills are of great concern. Currently, large oil spills, whether mineral oil or vegetable oil, require clean-up. However, for smaller spills clean-up may not be mandatory for vegetable oils. Since distribution transformers carry only limited amounts of oil (up to a few hundred gallons), there will not be any large spills. The EPA still needs to relax some of the restrictions imposed for vegetable oil spills and clean-up before their widespread use become economical for utilities. Other regulatory agencies at the state level also may need to change their rules for oil spills.
341
9 ECONOMICS OF TRANSFORMER ASSET MANAGEMENT 9.1
FAILURE STATISTICS FOR POWER TRANSFORMERS
Failure of a transformer refers to a lack of performance of its function so that it has to be taken out of service. Among other things, failure can occur in transformers as a result of electrical stress from lightning and switching surges, insulation degradation resulting from overloads and/or contamination, and faults that occur downstream of the transformer secondary bushings. However, most catastrophic failures in transformers are the result of faults downstream of the secondary bushings. Depending on the magnitude and duration of the resulting fault current, large mechanical forces could develop inside the transformer windings. The transformer’s ability to withstand such forces depends on several factors, including the design and the condition of the insulation. For example, low-impedance transformers tend to fail more than higher impedance transformers since they will experience more severe fault currents. On the other hand, systems designed with neutral grounding reactors or arc-suppressing reactors would tend to fail less often because of the limited fault current. On account of this, and because auto transformers are designed to have low impedance, they will tend to fail more often than multiple-winding transformers. In the sections that follow, typical failure rates and causes for large populations of transformers are presented. It is important to note that a utility company may experience failure rates that are vastly different from the numbers presented here. As mentioned above, failure rates depend on many factors, some of which may be specific to a given utility (maintenance practices, system design practices, geography, etc.). It is important that each company keeps accurate records of failures and analyses of root causes of failures. This will allow the development of effective corrective measures to prevent similar future failures. 9.1.1 CIGRE SURVEY OF FAILURES IN LARGE POWER TRANSFORMERS [170] In the late 1970s CIGRE working group WG12.05 undertook a task to conduct an international survey to pinpoint the main causes of transformer failures and to evaluate transformer outage times. The survey involved transformers and reactors designed for networks with a highest system voltage not less than 73 kV, without any limitations on rated power, not older than 20 years and installed on generation, transmission, and distribution systems. The working group received data from 13 countries (Australia, Austria, Belgium, Canada, Czechoslovakia, France, Finland, Italy, Japan, Switzerland, United Kingdom, USA31, and the former USSR). The analysis covered more than 1,000 failures that occurred between 1968 and 1978 relating to a total population of more than 47,000 transformer years with a maximum peak of 7,000 units in 1978.
31
The data received from the USA was in summary form and was therefore not integrated into the CIGRE study.
342
The failure rate, in percent per year, is calculated according to the following equation:
100
ny Ny
where : n y Total number of failed transformers in a given year Ny
Total component
years of transformers installed on the system during the year
In this particular study, the failure rates were calculated for different categories of transformers: by voltage class (60-100 kV, 100-300 kV, and 300-700 kV); by type (GSU, substation transformers, and auto transformers); by regulation (LTC or no LTC); and by age (0-5, 5-10, and 10-20 years). Other than for the classification by age of unit, only failures involving forced outages were considered. Figure 9-1 shows the summary of failure rates by type and voltage class of the transformers in the study.
14 12 Failure Rate (% / year)
60 - <100 kV 100 - <300 kV
10
300 - <700 kV All Voltages
8 6 4 2 0 GSU/ LTC
GSU/ No LTC
Substation/ Substation/ LTC No LTC
Auto/ LTC
Auto/ No LTC
ALL/ LTC
ALL/ No LTC
Transformer Type Figure 9-1: Failure Rate of Transformers With and Without LTC
The following comments were made by the working group concerning the results of the survey:
343
For GSU transformers with LTC, the failure rate is considerably affected by the increase in the winding voltage. This also happens in the case of auto transformers, while in the case of substation transformers, there appear to be no significant variations. The lower failure rates shown for auto transformers with LTC are somewhat surprising. Auto transformers without LTC show higher failure rates than the units with LTC. A detailed analysis showed that a concentration of the reported failures were from groups of units from specific networks. This inevitably skewed the failure rates towards higher values that are not entirely representative of this class and type of transformer. A general failure rate, irrespective of the voltage class or function, is of the order of 2 %/year. When no distinction is made with regards to whether a unit has LTC or not, the failure rates seem to increase with voltage (and therefore probably with rated power).
The data was also classified by age of the units and by voltage class. The resulting failure rates are shown in Figure 9-2. The data shows that, other than for the voltage class, 300 - < 700 kV, there is no significant increase in failure rates with the age of the units. For the lower voltage units, failure rates tend to decrease slowly with age. 5
Failure Rate (% / years)
Age of Unit (years)
0-5
4
>5 - 10 >10 - 20
3
2
1
0 60 - <100
100 - <300
300 - <700
Voltage Class (kV) Figure 9-2: Failure Rate as a Function of Unit Age and Voltage Class
9.1.2
344
CANADIAN ELECTRICITY ASSOCIATION FORCED OUTAGE REPORT [171]
This section contains a summary of forced outage statistics reported by the Canadian Electricity Association for all transformer failures in Canada and covering the period January 1, 1998 to December 31, 2002. The data is presented for different voltage classes and three phase bank (one three phase bank or three single phase bank) configurations. The total number of component years for this period was 24,211 years (roughly half of the number for the CIGRE study in the preceding section). The distribution of component years by voltage class and type of three phase bank is shown in Figure 9-3. 9000 Three Single Phase Units
8000
One Three Phase Unit Total Component Years
7000 6000 5000 4000 3000 2000 1000 0 109kV
110-149kV
150-199kV
200-299kV
300-389kV
500-599kV
600-799kV
Voltage Class
Figure 9-3: Distribution of Component Years by Voltage Class (CEA Forced Outage Report)
Figure 9-4 and Figure 9-5 show the average failure rates for each of the voltage classifications and the mean duration it takes to return the bank to service after a forced outage. From the reported data, the following comments can be made: If all the failures are considered without regard to voltage class, three phase units on this system fail twice as often as single phase units in a bank. It takes approximately twice as much time to restore a three phase unit back to service as it take to restore single phase units in a bank. The highest failure rates in one three phase bank and three single phase banks occurred in the 150-199 kV voltage class. These units comprise only 2% of the entire population of units reported. The failure rate for the entire set of reported data is on the order of 5.5%.
345
20% Three Single Phase Units
18%
One Three Phase Unit
Failure Rate (per year)
16%
All Tank Configurations 14% 12% 10% 8% 6% 4% 2% 0% 109kV
110-149kV
150-199kV
200-299kV
300-389kV
500-599kV
600-799kV
ALL VOLTAGES
Voltage Class
Figure 9-4: Failure Rate by Voltage Class of Transformers on the Canadian Power Grid
4500 4000
Three Single Phase Units
Mean Duration (Hrs)
3500
One Three Phase Unit All Tank Configurations
3000 2500 2000 1500 1000 500 0 109kV
110-149kV
150-199kV
200-299kV
300-389kV
500-599kV
600-799kV
ALL VOLTAGES
Voltage Class
Figure 9-5: Mean Duration of Failures by Voltage Class of Transformers on Canadian Power Grid
The failure data was reported according to the failed subcomponent. Figure 9-6 shows a distribution of contributions to failures by subcomponents according to voltage class and without regard to bank configuration. The subcomponent category classified as “other”
346
is the catch-all category for cases where the origin of the failure is not clearly evident. Of the remaining categories, LTCs contribute to the most failures for most voltage classes.
60
Bushings (Including C.T.'s) Windings On-Load Tap Changer Core Leads Cooling Equipment Auxiliary Equipment Other
% Contribution to Failures
50
40
30
20
10
0 109kV
110-149kV
150-199kV
200-299kV
300-389kV
500-599kV
600-799kV
Voltage Class
Figure 9-6: Failures by Subcomponent and Voltage Class
9.2
ECONOMICS OF TRANSFORMER MANAGEMENT FOR FLEETS AND SPECIFIC UNITS 9.2.1
INTRODUCTION
In a time of increasing competition and deregulation within the electrical power supply industry, increasing attention has to be paid to cost cutting and economical issues. Transformers are important elements of a power system. They are important not only to power system performance and reliability of supply, but also to the financial performance of companies. The technical complexities of transformers, as well as their high capital costs and long lifetimes, are important elements in the power system asset management process.
347
9.2.2
GENERAL CONCEPT FOR ECONOMICS OF TRANSFORMER MANAGEMENT
The financial aspects related to service activities should be integrated into a more general concept where the following issues are considered: Risk management Specification and purchase Operation and maintenance Decision process: repair - refurbishment - replacement CIGRE has issued a guide where all these steps have been considered, based on practical experiences accumulated in multiple countries [172]. ABB has developed different simulation models to study transformer populations [173] or specific units [174]. The economic analysis associated with the decision to maintain, refurbish or replace can best be done on a life cycle cost (LCC) basis. A traditional approach to LCC treats future costs as being fixed and their net present value (NPV) is considered. The cost of refurbishment or replacement is set for particular times in each case. In case of refurbishment, variables such as failure rate shall be adjusted to the condition of the units and an improvement level shall be admitted in relation to the maintenance action taken. The basic LCC equation is: n
LCC
CA
CE
CI
(CPM CC M
CO P
COo
CR ) CD
0
where CA CE CI CPM CCM COP COO CR CD
= = = = = = = = =
cost of apparatus cost of erection cost of infrastructure cost of planned maintenance cost of corrective maintenance cost of operation cost of outages cost of refurbishment or replacement cost of disposal
The criteria to be considered for an economic analysis shall also considered: Safety Condition Age Operation condition Availability Maintainability Environmental aspects Legislation Risk 348
These criteria are not necessarily independent; some overlap will occur. For example, a particular risk may be related to an environmental issue; obsolete equipment may still be maintainable and so on. Risks associated with safety overlap economics, system availability, maintainability, environmental and legislation criteria. Also, the owner may choose to apply some or all of the criteria to individual transformers. The transformers represent a large monetary value and this asset must be managed, from both short and medium/long term perspectives. A significant part of typical transformer populations is now 30-40 years old and is approaching an age where the reliability becomes questionable. However, no reliable information is available regarding the lifetime of transformers. Nevertheless, the future investment needs will in some way be dependent on the age distribution. It is obvious that there will be limitations in available capital for future investments. This leads to a need to lower the peak of the investments and to distribute the investments over a longer period of time. There is therefore a need to formulate and implement long term refurbishment and replacement strategies. Such strategies must be based on sound financial considerations and should be communicated and quantified in economical terms. The return on investment should be maximized under given constraints, e.g. a specified level of availability. Along with the trend towards penalties for unavailability, the risk costs have become increasingly important and should be a part of the formulation of the types of strategies that are discussed. Furthermore, the implementation of such strategies will require new tools and methods to identify the highest risk units within the population [175,176]. 9.2.3
DESCRIPTION OF THE SIMULATION MODEL
The basic principle of the model is to minimize the total cost function for the entire population with respect to the total investment need. It is hence the sum of all capital expenditures over the studied time period that is minimized. The cost function is a sum of capitalized cost components. Cash flow effects and availability of capital are not considered. The input data to the model are: -
financial information, e.g. internal rate of return, depreciation time, current energy price population data, e.g. number of units and total installed MVA per year general transformer data for the population, e.g. average load rate, losses, failure frequency as function of time, repair time general financial transformer data for the population, e.g. average acquisition value, maintenance costs, repair costs, consequential costs upon failure, cost and effect of refurbishment
The main cost components of the model are cost of capital, operational and maintenance costs, cost for life extending actions, cost of losses and risk costs
349
including costs for repair, loss of production/revenues, and other costs, e.g. environmental. Risk costs are treated as the failure rate times the consequential costs of the failure. The difficulty in all such calculations is that the shape of the bathtub curve, i.e. the failure frequency as function of time, is not known in detail. In this work, it is assumed that the owner of a network, together with the equipment manufacturer, can make fair estimates of best and worse case scenarios for the bathtub curve of that particular population. Based on the use of these scenarios, we can build an estimate of the future investment needs. The model is designed in such a way that the estimated bathtub curve can be modelled and entered as input. In the model, it is assumed that the technical lifetime of a transformer can be extended by refurbishment actions [177]. In the basic version, the types of action are not specified but it is up to the user to define the cost of such actions and to estimate the effects. In the advanced version, the types of action and their costs can be specified as well as the improvement in lifetime. The cost of losses influences the evaluation in the sense that a new transformer has lower losses than an old transformer. Performance of power transformers has gradually improved over the years. However, a significant step was taken with the introduction of grain oriented, cold rolled core steel in the mid 60’s. 9.2.4 CASE STUDY BY A UTILITY To illustrate the benefit of such a survey, here are the results of a study performed by ABB for a Swiss utility. A condition assessment study was followed by an economic survey. The population is composed of 50 medium sized network and generator step-up transformers. According to the wishes of the utility, the three scenarios below were considered: No maintenance: no preventive actions except the very basic and mandatory actions such as fixing oil leakages or changing the air-drying compound. Light maintenance: basic maintenance plus oil and gas analysis, oil filtering and drying, periodic on-load tap changer overhaul. Heavy maintenance: mid life refurbishment – after 15 to 30 years in operation depending on the condition of the unit defined according to a condition assessment survey. The transformer is untanked in order to check the active part, retighten the electrical connections and reclamp the winding blocks. If required, the oil is regenerated [178] and the active part is dried out [179]. Each accessory is checked and corrective actions are taken accordingly. For each of these three scenarios, the optimization process was run to define which transformer should be maintained or replaced by a new one and when. The graphs
350
presented in Figure 9-7 to Figure 9-9 show the capital that should be spent per year to maintain (blue bars) and replace old units (red bars) in order to operate the network during the next 25 years with the requested reliability level.
Figure 9-7: Scenario 1: No maintenance. Net Present Value = 4.5 MEUR
Figure 9-8 : Scenario 2: Light maintenance. Net Present Value = 3.8 MEUR
Figure 9-9 : Scenario 3:Heavy maintenance. Net Present Value= 2.2 MEUR
The net present value of the costs to operate, maintain and renew the fleet over the 25 coming years varies between 2.2 and 4.5 millions Euros depending on the scenario. In this specific case, refurbishing the transformers (scenario 3: heavy maintenance) after 15 to 30 years depending on their condition is considered to be the best scenario from a financial point of view. 351
9.2.5 CONCLUSIONS The tool described in this section is a very important element in the strategic planning process. It is used to evaluate future investments and to support decisions for maintenance and repair. Two important aspects of the analysis should be emphasized: a) the risk of failure should be evaluated precisely based upon the existing diagnostic tools. This risk has the largest impact on the replacement policy and is often not taken into account in the decision making process; b) maintenance actions should be defined not only in terms of costs but also in terms of the benefits, such as lifetime extension.
352
10 HEALTH AND SAFETY ASPECTS / RECOMMENDATIONS 10.1
PREAMBLE
The information under this section is provided as advice in order to inform the reader of the important Health & Safety issues that need to be addressed before commencing works on or near high voltage systems. The recommendations represent a minimum set of requirements when working on or near electrical equipment rated at voltages above 1000V. If higher standards are required by national regulations and/or local companies, then those higher standards should be adhered to.
10.2
INTRODUCTION
Electrical power systems contain large amounts of energy. Electrical arcs, as well as causing radiation burns, can vaporize materials causing fire and explosion. Voltages above 50V can cause fatal interruption to heart rhythms and cause internal tissue damage. In order to maintain safety, it is necessary to work to a framework of rules to suit the wide range of site situations. The effect of human factors, as well the physical environment in which work takes place should be considered in the application of these rules.
10.3
SCOPE
These recommendations are applicable to all Service Providers involved in the supply of site related services on power and distribution transformers, as well as work on near high and medium voltage systems and equipments. This policy is based on the internal ABB “7 Steps principles” , and defines the minimum safety rules to be followed when working on or near electrical equipment rated above 1000V. It is strongly recommended that all Service Providers shall follow the safety rules below, or equivalent, for all site operations. Each Service Provider may define additional rules and requirements based on local legislation, capabilities, skills, and the nature of services offered.
353
10.4
DEFINITIONS
Medium or High Voltage:
Above 1000V ac.
Electrical Equipment:
All medium and high voltage products, including power and distribution transformers.
Power System:
A connected network of electrical devices which, in the event of a short circuit, contains sufficient energy to cause serious burns to people or physical damage to the plant, other equipment or property.
Service Provider:
Any organization working on or near Electrical Equipment.
Nominated Person:
Qualified Person nominated to have the responsibility for safety and control of a work party.
Qualified Person:
Has the skills and knowledge related to the construction and operation of electrical equipment and installations. Understands the hazards of electricity and how to protect him / herself from these hazards. Is undergoing on-the-job training and who, in the course of such training, has demonstrated an ability to perform duties safely at his or her level of training and who is under the direct supervision of a qualified person is considered to be a qualified person for the performance of those duties.
Trained Qualified Person: Qualified Persons shall, at a minimum, be trained in and familiar with the following: the skills and techniques necessary to distinguish exposed live parts from other parts of electrical equipment, the skills and techniques necessary to determine the nominal voltage of exposed live parts, the clearance distances for qualified and unqualified persons and the corresponding voltages to which the qualified person will be exposed, and the decision-making process necessary to determine the degree and extent of the hazard and the personal protective equipment and job planning necessary to perform the task safely. Work Party:
Persons working or testing under the control of a Nominated Person.
Work Package:
Defined list of service related tasks to be completed by the Work Party within a set amount of time.
Switching:
Operation of equipment designed to alter the electrical state of an electrical installation such as connection, disconnection, altering the flow of current, or system operating voltage, inserting a switching device from a test
354
to a service position, withdrawing a switching device from a service to a test position. Competence:
A combination of skills, knowledge, and practical experience, to enable a person to carry out tasks effectively and safely.
Customer:
Company in charge of the equipment and it’s operation.
10.5
SAFETY MANAGEMENT
These rules focus on electrical safety aspects and are to be implemented in association with other general safety guidelines (such as personnel transportation, manipulation of oil, use of Personal Protection Equipments, work at height, etc…). Each Service Provider shall have a documented electrical safety management policy (safety-related work practices program). The policy or program shall contain information on: a) The application of electrical safety rules, b) Training and competency, c) Written authorization of people, d) Review and audit of compliance. Each Service Provider shall have suitable written procedures to ensure that electrical safety rules are applied to all site operations.
10.6
DOCUMENTATION
The following documentation is recommended to be produced by the Nominated Person prior to commencing work: a) Risk Assessment or Electrical Job Hazard Analysis Sheet (see sample Appendix 5, section 9.9.5), b) Safety Check Sheet (see sample Appendix 7, section 9.9.6), c) Safety Permits to work (see sample Appendix 8, section 9.9.7), d) Pre-job briefing or Tail-Gate Meeting form, e) Energized Electrical Work Permit if applicable (see sample Appendix 9, section 9.9.9). These documents must be retained in job files for verification and audit.
355
10.7
ELECTRICAL SAFETY RULES
10.7.1
GENERAL RULES
a) All Electrical Equipment shall be treated as live unless made safe and
released for work as described in section 9.7.3 below. b) Electrical equipment is subject to Electrical Safety Rules when it is capable of
being energized from a power system through operation of switchgear, or by the replacement of fuses or links. c) Electrical Safety Rules must, at all times, be applied in such a manner as to
prevent danger to persons switching, working on, or in the vicinity of live apparatus. d) Each person within the Work Party must have the Competence to undertake
the scope of work planned for them. e) Normally the Customer personnel shall undertake all actions to safely
disconnect and earth (ground) Electrical Equipment to be worked on. f) Normally Service Provider personnel shall not work on live equipment. g) Work packages which require work on or very near live equipment must
follow relevant additional rules in section 9.7.4. h) Personnel on Site must at all times wear appropriate Personal Protection
Equipment (PPE) . Flame resistant (FR) clothing rated 8 cal/cm2 shall be worn as an everyday uniform. NFPA standard 70E will be used to determine additional protection in the absence of local standards. i)
Other PPE may be used according to local regulations and risk assessment controls.
j)
There must be safe and proper means of escape in the event of failure of any live apparatus.
k) The Nominated Person must establish prior to starting work relevant
telephone numbers for emergency services. l)
Appropriate safety precautions shall be taken when working on high equipment to avoid injury through falling.
m) No un-authorised person may enter the work area.
10.7.2
COMMUNICATION AND CONTROL RULES
a) For each Work Package a Nominated Person must be appointed in writing.
The Nominated Person must understand the limitations of his work and the safe working area. b) The Nominated Person must have sufficient training and experience to be
competent in the discharge of those responsibilities. 356
c) Irrespective of whether the Customer has completed all or part of the steps to
safely earth (ground) Electrical Equipment, the Nominated Person shall ensure and verify that all Electrical Safety Rules have been complied to. d) The Nominated Person has the authority not to proceed with work should he
consider that compliance to Electrical Safety Rules has not been met. e) Only the Nominated Person has the authority to issue a Permit to work. f) All site work packages must have a written scope of work which clearly
defines the tasks to be completed, the relevant time frame to complete tasks, the resources to be utilized as well as relevant contact details of the customer’s representative. g) There must be arrangements to ensure communications are clear and not
subject to misinterpretation. Typically the following may apply: Instructions are written down and repeated to the sender, Instructions and confirmation times are noted, The use of standard phrases which can not be misinterpreted, The use of standard schematics by all persons concerned. h) Work or switching must not be commenced by pre-arranged signals or time. i)
Where there are numerous persons carrying out switching operations or work parties on the same circuit, a control person must be nominated and be responsible for safety co-ordination.
10.7.3
RULES FOR WORKING ON DEAD ELECTRICAL EQUIPMENT
A safe working area must be created and maintained in accordance with the following principles. All 7 principles must be applied on every occasion: Step 1
Clearly identify work location,
Step 2
Disconnect completely, secure against re-connection (Lockout / Tagout),
Step 3
Provide protection against live parts,
Step 4
Take special precautions when close to bare conductors,
Step 5
Verify the installation is dead by approved means,
Step 6
Carry out earthing (grounding) and short circuiting,
Step 7
Issue a Permit to work.
Step 1: Clearly identify the work location a) Sufficient labels, schematics and plans must be available to clearly identify the location and the Electrical Equipment to be worked on.
357
b) Where Electrical Equipment is not easily identifiable, such as cables, suitable identification arrangements must be made by the Nominated Person. c) Nearby live Electrical Equipment must be identified as dangerous by the application of highly visible temporary warning labels. d) There must be clear and continuous identification of the safe working area. It must be possible to easily distinguish between safe and dangerous areas throughout the course of planned work. Step 2: Disconnect Completely, Secure against re-connection a) Verify that the Electrical Equipment has been safely disconnected and earthed (grounded). b) A suitable electrical gap (see Appendix 2 & 3, section 9.9.2 & 9.9.3) must be provided across all points at which the apparatus may be made live including potential in-feeds from low voltage apparatus. c) The gap must be physically secured from inadvertent or willful re-connection, by the application of barriers or locks; or removal of fuses to a safe place; or removal of apparatus from its normal service position; or disconnecting/blocking stored mechanical energy devices. d) It shall not be possible for remote protection or control to reconnect the circuit under work through electrically closing a switching device. e) A prominent warning notice must be fixed to each point of disconnection. f) All keys must be kept in a secure place. Step 3: Provide protection against live parts a) All live apparatus in the vicinity of the work place must be locked off, clearly identified and made inaccessible by barriers or other means. b) A risk assessment must be carried out to ensure that dangerous voltages cannot be directly or indirectly created on any of the electrical circuits connected to the point of work from nearby live circuits (see Appendix 2, section 9.9.2) including the re-arrangement of earth (ground) connections. c) Special attention must be paid when the scope of work requires phased outages of different circuits. The sequence of circuits to be made dead must be clearly understood by all members of the work party. With each change of circuit from live to dead, or vice versa: Access control and warning labels must be changed to suit, Each member of the Work Party must fully understand which new circuits are now live. d) Work on Electrical Equipment connected to overhead lines must cease in the event of a lightning storm.
358
e) On wood pole lines with one or more circuits live, precautions must be taken against steelwork being or becoming live. f) On certain high voltage cable systems it may be necessary to take precautions against large induced voltages, for example by fully insulated working. g) Precautions must be taken to prevent danger from low voltage conductors at the point of work. Step 4: Take special precautions when working close to bare conductors a) Special precautions must be agreed with the Nominated Person when the minimum clearances (Appendix 1, section 9.9.1) cannot be made to unearthed (unground) conductors during preparation of the safe working area by applying screens, testing and applying portable earths (ground). Details on Approach Boundaries distances are given in Appendix 1, section 9.9.1). b) The minimum safety precautions in the above circumstances are: Wear appropriate voltage-rated gloves and applicable PPE, Ensure access is suitable to avoid inadvertent slips, Be accompanied by a second person who can render assistance. Step 5: Verify the installation is dead a) Where the design of the Electrical Equipment allows, it must be confirmed dead by a suitable testing device at all points of work and all points where portable earths (grounds) are to be applied. b) The testing device shall be of a proper category rating, and proved before and after each test. c) Where the design of the Electrical Equipment precludes this, other suitable arrangements shall be agreed with the Nominated Person. Typically: firing a spike through underground cables, using proximity testing devices on insulated conductors, operation of switches to earth (ground) or tracing cables or conductors back to a visible earth (ground) point. Step 6: Verify earthing (grounding) and short circuiting a) The Electrical Equipment to be worked on must be connected to earth (ground) by connections and conductors capable of carrying the full short circuit current at that point. b) Where possible the Electrical Equipment shall be earthed (grounded) by a fully rated switch. c) Earths (grounds) must be applied between the point of work and all possible sources of HV supply, and they shall remain in position for the full duration of work. 359
d) Earths (grounds) must be applied by a Qualified Person who is wearing all applicable PPE and FR clothing to match the Hazard / Risk category outlined in NFPA 70E. e) Portable earths (grounds) shall be applied to all phases and in such a manner as to prevent danger from residual charge or induced voltages. f) Separate earths (grounds) at the point of work shall be connected to create an equi-potential zone for all persons at the point of work. They may be moved during the course of the work. g) Precautions shall be taken to prevent danger from voltages developed across earth (ground) conductors connected to earth (ground) at different points. Step 7: Issue a Permit to work a) Note: The Permit to work is about control of the workplace and people. It is a summary of the previous protective measures and hazards. It is also a clear statement of responsibility from the Nominated Person for these protective measures. b) The Electrical Equipment to be worked on must be released for work through the issue of an electrical Permit to work at the point of work. The Nominated Person issuing this is responsible for creating and maintaining the safe working area in accordance with 7 steps principles. c) The Permit to work shall contain clear, legible details of: The location of the work, and the precautions that have been taken to establish the safe working area, The scope of the work, Hazards in the immediate area, Completion of Site Risk assessment, Completion of Safety Check sheet, Signature of the Nominated Person in charge of the work party, times and dates of issue and cancellation, Signatures of the Work Party members. d) The Nominated Person in charge of the work party shall be responsible for the safety of his work area and all other persons in his work party regardless of seniority.
360
e) Warning signs and demarcation equipment (barricades) are not to be removed until after cancellation or the issue of further safety documents. f) The Nominated Person in charge of the work party shall be responsible for ensuring all persons and tools are withdrawn on completion of work, and hand over of the Electrical Equipment in proper condition according to the work undertaken. g) Where the boundary of the safe working area changes during the course of the work, further Permits to Work must be issued. 10.7.4
RULES FOR WORKING ON OR VERY NEAR LIVE ELECTRICAL EQUIPMENT
All work packages that require work on or very near live Electrical Equipment, other than energized troubleshooting must have prior written approval from the local Service Provider manager, who must be satisfied that personnel have the appropriate skills to undertake the required task. The rules in Sections 9.7.1 - 9.7.3 shall be followed where relevant. The risk assessment shall specifically evaluate whether the work can be done dead or in some other way, and what additional special safety measures must be undertaken. 10.7.5
SWITCHING
Note that switching includes insertion or withdrawal of a switching device. Switching must be undertaken by the appropriate and authorized customer personnel in control of the system with the approval of the Service Provider personnel. Appropriate personal protection equipment must be worn by personnel in the switching area during switching operation. At minimum flame retardant overalls, gloves and a safety visor must be worn. Where possible switching shall be undertaken remotely. 10.7.6
WORK ON OR VERY NEAR LIVE CONDUCTORS
Any work which cannot be done whithin the safe working clearances in Appendix 1, section 9.9.1 must be the subject of a special written procedure (Energized Electrical Work Permit), and carried out by specially trained and authorised (Qualified) persons. Work is considered ‘Live work’ when it is carried out within the live zone distances set out in Appendix 1, section 9.9.1 (Prohibited Approach Boundary) or 361
if the work requires the removal of covers, doors or barriers to expose live conductors. Work must only be carried out by a (Qualified) person who is properly trained and authorized in writing, and who is familiar with the function and operation of the Electrical Equipment concerned. Specific PPE according to the hazard / risk category outline in NFPA 70E must be worn by personnel undertaking the work. At a minimum flame retardant overalls, gloves and a safety visor must be worn. 10.7.7
TESTING AND COMMISSIONING
Where it is necessary to carry out electrical tests on Electrical Equipment, the safe working area must be established by following steps 1 - 6 as described in section 9.7.3, before being released for tests by a safety document, and earths (grounds) removed. The test area must be under the control of a suitably competent (Qualified) person and precautions taken to avoid electric shock as in Step 4 in Section 9.7.3. Additional warning signs and barriers must be used to protect other persons nearby from test voltages. If signs and barriers do not provide sufficient warning and protection from electrical hazards, an attendant shall be stationed to warn and protect employees Work on Electrical Equipment shall only be done, or supervised, by a person competent (Qualified) to recognize danger and apply controls from: Live low voltage wires ac and dc, Voltages arising from current transformers, protection, pilot cables and earths (grounds), Primary power conductors at high or low voltage, Interference with fully operational power systems, Test equipment.
10.8
WORK AT HEIGHT: ADDITIONAL SAFETY EQUIPMENT FOR POWER TRANSFORMERS.
10.8.1
“NO-RISK SYSTEM”
ABB has studied and patented “NO-RISK System” , a collective safeguard to prevent falls that complies with Directive 2001/45/EC of the European Parliament and of the Council, concerning the minimum safety and health requirements for the use of work equipment by workers at work: “...if temporary work at a height cannot be carried out 362
safely and under appropriate ergonomic conditions from a suitable surface, the work equipment most suitable to ensure and maintain safe working conditions must be selected…”. “NO-RISK” is a cable based fall arrest system that can be installed on every kind of transformer and offers protection to individuals working at height during the maintenance activities that transformers could require.
Figure 9-10-1: “NO-RISK System” typical application
“NO-RISK System” equipment includes: One (1) Collective safeguard, certified by ABB, that can be installed on every transformer by means of patented support structures. The kit consists of: - Two (2) Supporting brackets to be permanently welded on the transformer tank, - Two (2) Safety rope vertical supports, - Two (2) Safety rope locking devices, - One (1) Shock absorber, - One (1) Safety rope, - One (1) Turn buckle, - One (1) Box to store the above listed parts.
363
One (1) Personal safety kit, consisting of: - One (1) Safety harness, - One (1) Adjustable rope, - One (1) Snap hook, - One (1) Hard hat, - One (1) Pair of gloves, - One (1) Reflective vest, - One (1) Bag containing the kit.
Figure 9-10-2: “NO-RISK System” equipments
364
10.8.2
10.9
“FALL ARREST TOWERS AND BASE PLATES”
APPENDICES
Notes on use of Appendices: The following tables are for guidance only. They should be used as part of a thorough risk assessment. The tables have been derived from ABB documents which contain much more detail. Where possible consult local standards, which may state different figures and methods of application to be adhered to.
365
10.9.1
APPENDIX 1 - MINIMUM WORKING CLEARANCE
The minimum working clearance is the minimum distance, in air, between a live exposed conductor, and any part of a person’s body, tool, conductor or apparatus that a person may be touching. The clearance must take into account the nature of the work and relative positions of the live conductor and the working area. Where work infringes this clearance then addition control measures should be implemented to maintain safety. Where work infringes the live working zone then it shall be considered to be live work. System Voltage kV <1 10 20 36 70 132 275 480
Minimum Working Clearance mm 700 (2 ft. 3 in.) 1350 (4 ft. 5 in.) 1400 (4 ft. 7 in.) 1580 (5 ft. 2 in.) 1900 (6 ft. 3 in.) 3100 (10 ft. 2 in.) 3800 (12 ft. 6 in.) 5200 (17 ft. 1 in.)
Live Working Zone mm 200 350 400 580 900 1100 1800 3200
(0 ft. 8 in.) (1 ft. 2 in.) (1 ft. 4 in.) (1 ft. 11 in.) (2 ft. 11 in.) (3 ft. 7 in.) (5 ft. 11 in.) (10 ft. 6 in.)
NB. Source: EN 50110-1, whereas in this standard: - Minimum working clearance is ‘Dv’ (Outer limit of vicinity zone), - Live working zone is ‘Dc’ (Minimum working distance) in this standard.
Approach Boundaries to exposed energized parts for Shock Protection (mainly applicable in the USA). (1)
Definitions.
Limited Approach Boundary:
A shock protection boundary to be crossed by only qualified persons (at a distance from a live part), which is not to be crossed by unqualified persons. Set your barricades here or at flash protection boundary if it’s larger than 10 feet (3050 mm),
Restricted Approach Boundary: A shock protection boundary to be crossed by only qualified persons (at a distance from a live part) which, due to its proximity to a shock hazard, requires the use of shock protection techniques and equipment when crossed. (use voltage rated PPE and Equipment),
366
Prohibited Approach Boundary: A shock protection boundary to be crossed by only qualified persons (at a distance from a live part) which, when crossed by a body part or object, requires the same protection as if direct contact is made with a live part. (2)
This distance is for shock protection, if flash protection boundary is greater the barricades need to be at flash protection boundary.
(3)
Protection boundary may also need to be extended if conductive materials that may come intact with energized parts are being handled.
All dimensions are live part to employee: Nominal System Voltage Range Phase to Phase kV
0.051 to 0.750 0.751 to 15 15.1 to 36 36.1 to 46 46.1 to72.5 72.6 to 121 138 to 145 161 to 169 230 to 242 345 to 362 500 to 550 765 to 800
Limited Approach Boundary 1 Location of barricades to protect unqualified persons from electrical shock 2-3 ft. in. (mm) 10 ft. 0 in. (3050) 10 ft. 0 in. (3050) 10 ft. 0 in. (3050) 10 ft. 0 in. (3050) 10 ft. 0 in. (3050) 10 ft. 8 in. (3250) 11 ft. 0 in. (3350) 11 ft. 8 in. (3550) 13 ft. 0 in. (3950) 15 ft. 4 in. (4700) 19 ft. 0 in. (5800) 23 ft. 9 in. (7300)
Restricted Approach Boundary 1 Qualified person wears voltage rated PPE before entering this area ft. in. (mm) 1 ft. 0 in. (305) 2 ft. 2 in. (660) 2 ft. 7 in. (790) 2 ft. 9 in. (840) 3 ft. 3 in. (990) 3 ft. 5 in. (1050) 3 ft. 7 in. (1100) 4 ft. 0 in. (1220) 5 ft. 3 in. (1600) 8 ft. 6 in. (2600) 11 ft. 3 in. (3450) 14 ft. 11 in. (4550)
Prohibited Approach Boundary 1 Entering this area may result in serious injury or death ft. in. (mm) 0ft. 1 in. (25) 0 ft. 7 in. (180) 0 ft. 10 in. (255) 1 ft. 5 in. (430) 2 ft. 1 in. (635) 2 ft. 8 in. (815) 3 ft. 1 in. (940) 3 ft. 6 in. (1070) 4 ft. 9 in. (1450) 8 ft. 0 in. (2450) 10 ft. 9 in. (3300) 14 ft. 5 in. (4400)
367
10.9.2
APPENDIX 2 - MINIMUM DESIGN CLEARANCES WHERE POWER LINES CROSS OR ARE IN CLOSE PROXIMITY
These provide a useful guide when assessing the degree of risk from nearby exposed power lines. They do not take into account the additional risks of failure created by extreme weather conditions or poor condition of the equipment. The clearances are calculated for the upper conductor operating at its maximum likely temperature and the lower conductor at 25 °C less. They must also allow for a maximum wind loading swing of 45deg. System Voltage kV <1 10 24* 36 70 132 275 480
Minimum Design Clearance between circuits mm 1000 (3 ft. 3 in.) 1800 (5ft. 11 in.) 1900 (6 ft. 3 in.) 2000 (6 ft. 7 in.) 2300 (7 ft. 7 in.) 2700 (8 ft. 10 in.) 3700 (12 ft. 2 in.) 4400 (14 ft. 5 in.)
* Extrapolated Source: derived from UK spec. EATS 43-8 Company vehicles or mobile equipment capable of having parts of its structure elevated near energized overhead lines shall be operated so that a clearance of 10 ft. (3050 mm) is maintained. If the voltage is higher than 50kV, the clearance shall be increased 4 in. (100 mm) for every 10kV over that voltage. However, under any of the following conditions, the clearance may be reduced: If the vehicle is in transit with its structure lowered, the clearance may be reduced to 4 ft. (1220 mm). If the voltage is higher than 50kV, the clearance shall be increased 4 in. (100 mm) for every 10kV over that voltage, If insulating barriers are installed to prevent contact with the lines, and if the barriers are rated for the voltage of the line being guarded and are not a part of or an attachment to the vehicle or its raised structure, the clearance may be reduced to a distance within the designed working dimensions of the insulating barrier.
368
10.9.3
APPENDIX 3 - MINIMUM SEPARATION ACROSS POINT OF DISCONNECTION IN AIR
These distances are between open isolator blades, or distances between fixed points of disconnection. Where separation is not fixed, such as overhead line spans, greater clearances will be required (see Appendix 1 & 2). Consideration should also be given to other conditions which may bridge or degrade the insulation gap. System Voltage kV 12 24* 36 66 132 275* 480*
Electrical clearance (Phase to earth / ground) mm 229 (0 ft. 9 in.) 330 (1 ft. 1 in.) 432 (1 ft. 5 in.) 786 (2 ft. 7 in.) 1473 (4 ft. 10 in.) 2800 (9 ft. 2 in.) 4000 (13 ft. 1 in.)
* Extrapolated Source: derived from EN 60129
369
10.9.4
APPENDIX 4 - PRINCIPLES OF RISK ASSESSMENT
The following outlines the very basic principles of risk assessment. There is a considerable amount of information generally available on the topic. Risk assessment should be carried out at both the planning and implementation stages of projects. It is the key to the application of rules and to setting up the ‘Safe Working Area’. There are 3 principles: 1) Identify the Hazards These are things which have the capacity to cause harm in any given situation. 2) Assess the Degree of Risk This is much more difficult. It takes into account the hazard in relation to the tasks, the potential severity of failure and the likelihood of failure. It must consider the competency of the people, human factors, technical factors and environmental factors. The degree of risk will change if unforeseen circumstances alter the work. In these circumstances the risk should be reappraised. 3) Define and Implement Controls These will be determined by the degree of risk. There is a hierarchy of the preferred type of controls, starting with removing the hazard and descending to the use of PPE. Controls may be a combination of physical measures and by management of people and documentation/rules. They must take into account human factors.
370
10.9.5
APPENDIX 5 - EXAMPLE OF SAMPLE RISK ASSESSMENT SHEET.
371
10.9.6
APPENDIX 6 - ELECTRICAL JOB HAZARD ANALYSIS SHEET.
(To be completed by the person doing the task/job by checking the appropriate boxes). Yes No N/A CONSIDERATIONS FOR TASK/JOB:_______________________ Is the job scope understood? The job scope must be understood before continuing the analysis and performing any work. Am I trained and qualified to do the task? Only trained and qualified employees may perform electrical task or complete this analysis. To be qualified, you must understand the construction and operation of the particular equipment that you have been asked to work on and how to avoid the hazards associated with this equipment and environment. Have I performed this task before? Contact your supervisor if you feel you are not qualified to perform the task or complete this analysis. Have you conducted a pre-job briefing? Before starting each job, the employee in charge shall conduct a job briefing with all employees involved. The briefing shall cover at least the following subjects: Job scope, hazards associated with the job, how to avoid the hazards (work procedures involved, special precautions, energy source controls, and personal protective equipment requirements), and your role in performing the work. This job briefing must be performed even if you are working alone. Is the electrical equipment Locked and Tagged Out (completely de-energized for this task)? Have you verified that all forms of energy have been isolated from the equipment? For electrical energy, you must first test your voltage detector for proper operation, verify that no voltage is present within the work area, and then test to see if your voltage detector is still working properly. Is there exposed, energized electrical equipment near the work area? If so, check the appropriate voltage range(s). _____> 49 to 250 Volts _____> 250 to 600 Volts _____> 600 Volts Do I have the proper electrical personal protective equipment required to do the task? Proper electrical personal protective equipment must be acquired, when applicable, prior to the completion of the analysis and beginning the work. Electrical jobs may be split into tasks and a Job Hazard Analysis performed for each task. Do I have the proper voltage rated tools and test equipment in proper working order to perform this task? Proper voltage rated tools and test equipment must be acquired, when applicable, prior to completion of the analysis and beginning the work. Is a permit required for this task? If so, which of the following permits is required for this task? _____ Energized Electrical Work Permit _____ Confined Space Entry Permit _____ Other Documentation Can I control my environment? You must have control of your environment prior to the completion of this analysis and beginning work. ____ Close working quarters ____ High traffic area ____ Flammable atmosphere ____ Wet or damp environment ____ Inability to control intrusion/distraction by others ____ Could drop a tool/component onto exposed, energized equipment/bus bars/conductors
372
Do I understand that completing this job safely is more important than the need or pressure to complete this job? You must be able to answer this question “Yes” prior to the completion of this analysis and beginning work. If you have a problem answering this question “Yes”, contact your supervisor or the Health & Safety Department. Do I have any unresolved safety concerns about performing this task? You must be able to answer this question “No” prior to the completion of this analysis and beginning work. If you have a problem answering this question “No”, contact your supervisor or Health & Safety Department. NOTE: If you have checked any gray boxes, contact your supervisor or Health & Safety Department before working on this equipment.
Employee’s Signature: ___________________ Date: ___________ Time: __________
373
10.9.7
APPENDIX 7 - SAMPLE SAFETY CHECK SHEET
Customer Name
Safety Check Sheet
Substation Name
Site Name Job Number
Nominated Person Telephone Number for Ambulance/First Aid: Telephone Number for Fire Department: Telephone Number for Emergency Services:
Check List 1 2 3 4 5 6
Is there safe means of escape in event of switchgear failure? Is the scope of work documented and clearly defined Do members of the Work Party have the competence to perform the scope of work? Have all members of work party been issued with correct PPE for the scope of work? Has a risk review been undertaken to evaluate risks within the nearby vicinity and on the job? Does the risk assessment consider direct and indirect possibilities for re-connection of the circuit under work?
7
Is work place clearly identified and demarcated?
8
Is live equipment nearby the work place clearly identified? Does each member of the work party fully understand which circuits are live and which circuits are dead? During execution of the work is it planned to change any circuits from dead to live or vice versa? WARNING : If Yes then with each change: demarcation and warning signs must be adjusted accordingly each member of the work party must fully understand which new circuits are now live
9
10
11 12 13
Is the electrical equipment to be worked on disconnected and safely earthed (grounded)? Have adequate steps been taken to prevent reconnection? Can remote protection or control operation reconnect circuit under work?
374
Yes
No
Comment
14
Are there warning notices at all disconnection points?
15
Has access to nearby live equipment been prevented through the positioning of barriers, locks or other means? Have adequate safety measures been taken to prevent access to live low voltage conductors? Have voltage transformers been safely disconnected to prevent high voltage at the point of work being applied through energising transformer low voltage side?
16 17
20
During preparation of the safe working area, will any member of the work party come close to live exposed conductors? WARNING: If yes then special safety precautions must be taken during this activity
21
Has a voltage detection tester been used to verify that all points of work are dead? Has the voltage detection tester been checked for correct operation before and after use?
22 23 24 25
Have earth (ground) been applied to all phases at the point of work? Are earth (ground) conductors and connections rated for maximum fault level at point of work? Is there a written Electrical Safety Permit to work? Additional checks for work on or near live equipment
1 2 3 4 5
Is scope of work approved by local Service Unit manager? Do members of the work party have correct PPE for the scope of work? Has a detailed risk assessment been undertaken? Do all members of the work party fully understand which parts of the equipment are live? Are all tools and test equipment functioning correctly and calibrated?
Signed: …………………………
Date: …………………………
375
10.9.8
APPENDIX 8 - SAMPLE SAFETY PERMIT TO WORK.
Electrical Safety Permit to work
Customer / Plant-Responsible-Person Contractor / Nominated Person Plant / Control Panel Location and Scope of Work to be executed
All parts of the electrical system, which are not addressed, are considered to be in live condition!
1.
Authorization for Switching Operations
Date, Time, Name, The customer (plant responsible person):
Signatures
if necessary the authorization is handed over to:
2.
Permission for Working
The Plant-Responsible-Person gives permission to the Nominated Person to execute above described work on the defined area / part of the plant. Work place clearly identified Circuit disconnected and secured against re-connection Access to nearby live parts prevented Installation verified as dead Circuit correctly earthed (grounded) Execution and Confirmation by the Plant-Responsible-Person and Checked by the Nominated Person: Plant-ResponsiblePerson assigned:
Date:
Time:
Name:
Company:
Signature:
Nominated Person took over:
Date:
Time:
Name:
Company:
Signature:
376
3.
Release to start Work
The Nominated Person performs the workplace risk assessment, completes safety check sheet and grants the release to start work Site risk assessment completed Safety check sheet complete Plant-ResponsiblePerson released:
Date:
Time:
Name:
Company:
Signature:
Instructed employees, own one's and contractors:
Date:
Time:
Name:
Company:
Signature:
Date:
Time:
Name:
Company:
Signature:
Date:
Time:
Name:
Company:
Signature:
Date:
Time:
Name:
Company:
Signature:
4.
End of Work
Inspection and announcement of completion of described and executed work / evacuation of working area Remove all tools, equipment and material Uncover or remove protection of adjacent live parts Remove earthing (grounding) and short-circuiting Remove all locks or devices, which were used to prevent re-connection Remove all signs used for marking the working area FROM NOW ON THE INSTALLATION IS REGARDED AS LIVE Inspection by Nominated Person if the installation is ready for re-energizing BEFORE RE-ENERGIZING ALL PEOPLE NOT NEEDED HAVE TO LEAVE THE DANGER ZONE Nominated Person hand over the installation to the Plant-Responsible-Person Re-connection by the person authorized for switching operations Nominated Person assigned:
Date:
Time:
Name:
Company:
Signature:
Plant-Responsible-Person took over:
Date:
Time:
Name:
Company:
Signature:
The released work space herewith has been energized!
Original:
Nominated Person
Copy 1:
Plant responsible person
Original to be retained in job file
377
10.9.9
APPENDIX 9 - SAMPLE ENERGIZED ELECTRICAL WORK PERMIT.
Energized Electrical Work Permit TO BE COMPLETED BY THE REQUESTER:
CHECK
1) Job Location (Customer Name & Location): 2) Description of Work to be performed:
3) Why Equipment cannot be de-energized:
4) Description of Safe Work practices implemented:
5) Location of main disconnect (In case of Emergency): 6) CPR-Trained Stand-By person (Required): 7) Arc flashing rating of Energized Work Area:
0
1
2
3
4
8) Personal Protective Equipment to complete the job:
9) Method(s) to Restrict Access: APPROVAL TO PERFORM THE ENERGIZED WORK DESCRIBED ABOVE
REQUESTOR JOB
TITLE
DATE
ELECTRICALLY QUALIFIED PERSON JOB TITLE
YES SERVICE MANAGER OR MANAGEMENT REPRESENTATIVE
378
DATE
NO
NA
SERVICE MANAGER CONTACTED
DATE
References 1.
ABB Transformer Handbook, Rev 02, 2004
2.
ABB Transformer Handbook, Rev 02, Sect. 7.1.1, 2004
3.
Excerpted from ABB Instruction Leaflet 44-666G, “Instructions for Installation, Maintenanceand Storage of Type “O Plus C” Bushings 115kV and Higher”
4.
Pritpal Singh, “C2 Power Factor and Capacitance of ABB Type O Plus C, AB, and Type T Condenser Bushings”, Doble Client Conference Paper, 2001.
5.
ABB Transformer Handbook, Rev 02, Sect. 7.3.2, 2004
6.
Rick Youngblood, “Cinergy Taps Into Longer Life”, Transmission & Distribution World (Online Edition), Nov 1, 2000
7.
A. Tahani, "Numerical Modeling of Electrification Phenomena and Its Implication for Dielectric Integrity", 1994, Ph.D. Thesis, Rensselaer Polytechnic Institute, Troy NY 12180-3590
8.
R. Tamura, et al., "Static Electrification by Forced Oil Flow in Large Power Transformers", IEEE Trans. on PAS, Vol. 90 (1980), pp.335-343
9.
J. F. Roach and J. B. Templeton, “An Engineering Model for Streaming Electrification in Power Transformers”, Electrical Insulating Oils, STP 998, H.G. Erdman, Ed., American Society for Testing and Materials, Philadelphia, 1988, pp. 119-135
10.
G. K. Frimpong and J. M. Walden, “Streaming Electrification Model Tests”, EPRI, Palo Alto, CA: 1999. TR-113535
11.
Pettersson, L.: “Estimation of the Remaining Life of Power Transformers and Their Insulation”. (Electra No 133, Dec 1990, pp 65-71)
12.
Pettersson, L., Fantana, N.L., Sundermann, U.: “Life Assessment: Ranking of Power Transformers Using Condition Based Evaluation - A New Approach”, (CIGRE Paper12-204, 1998)
13.
Pettersson, L., Fantana, N.L., Persson,J.O, Walldén, K.I.,: “Condition Based Evaluation of Net Transformers – Experience from a New Ranking Procedure.” (CIGRE Paper12-108, 2002)
14.
Craig L. Stiegemeier, Mark Perkins, Asim Fazlagic, James Dunn, “Mature Transformer Management ProgramTM for Arc Furnace Transformers”, AISTech2004 Technical Conference, Association for Iron & Steel Technology Conference and Exposition, Nashville, TN, September 16, 2004
15.
Asim Fazlagic, Mark Perkins, Brandon Saeger, “Transformer Upgrading Tools and Practices”, Proceedings of the 2004 TechCon conference, January 26-29, 2004
16.
Ramsis Girgis, Mark Perkins, Asim Fazlagic, “Evolution of ABB’s Transformer Risk/Life Assessment Process”, Proceedings of the 2003 International Conference of Doble Clients, paper no. TX1 379
17.
Mark Perkins, Lars Pettersson, Nicolai Fantana, TV Oommen Steven Jordan, “Transformer Life Assessment Tools and Methods”, Proceedings of the 2000 International Conference of Doble Clients, Section 8-1
18.
M. Perkins, L. Pettersson, N. Fantana, TV Oommen, S. Jordan “Transformer Life Assessment Tools with Specific Application to Nuclear Station Generator Transformers” Proceedings of the IEEE EIC/EMCW Conference, Cincinnati, Ohio, October 26-26, 1999, pp. 685-690
19.
Asim Fazlagic, Mark Perkins, “Transformer Life and Condition Assessment Overview of Tools and Methods”, 2000 EUCI Condition Assessment of Power Transmission & Distribution Systems Conference, December 6-8, 2000, Denver – Colorado
20.
Excerpts from: Dielectric Diagnosis of Electrical Equipment for AC Applications and its Effects on Insulation Coordination – State of the Art Report, Presented by Working Group 33/15.08, CIGRE 1990 Session, August 26- September 1, pp. 134.
21.
E.J. Rogers, L.E. Humbard, D.A. Gillies: “Instrumentation techniques for lowvoltage impulse testing of power transformers”, IEEE Trans. on PAS, May/June 1972
22.
E.P. Dick, C.C. Erven, "Transformer diagnostic testing by frequency response analysis”, IEEE Trans. on PAS, Nov. /Dec. 1978.
23.
G. Zafferani, "Contribution of diagnostic techniques on large power transformers to the Improvement of service reliability", Proc. of AEI Annual Meeting. Trieste, 1980, Paper II.1.22
24.
E. Dornenburg, W.Strittmatter, “Monitoring oil-cooled transformers by gas analysis", Brown Boveri Review No. 5, May 1974.
25.
CIGRE W6 15.01, “Detection of and research for the characteristics of an incipient fault from analysis of dissolved gases in the oil of an insulation", Electra No. 42, Oct. 1975.
26.
G. Belanger, M. Duval, "Monitor for hydrogen dissolved in transformer oil". IEEE Trans. on EI, Oct. 1977.
27.
P.J. Burton, J. Graham et al., “Recent developments by CEGB to improve the prediction and monitoring of transformer performance. CIGRE General Session 1984, Report 12-09.
28.
W. Lampe, L. Petterson, et al., “Hot-spot measurements in power transformers", CIGRE General Session 1984, Report 12-02.
29.
R. Wilputte, M. Randoux, "Lessons drawn from the routine testing of insulating oils used in power transformers on the Belgian network", CIGRE General Session 1986, Report 12-07.
30.
J.F. Morel, G. Wind, ''Detection et localization des decharges partiellee par ultrasons", RGE No. 1, Jan. 1970. 380
31.
R.T. Harrold, "Acoustic waveguides for sensing and locating electrical discharges within high voltage transformers and other apparatus", IEEE Trans. on PAS, Apr. 1983.
32.
CIGRE WG 12.01, "Measurement of partial discharges in transformers", Electra No. 19, Nov. 1971.
33.
AIEE Std. 505-1955, "Test code for power-factor (dissipation factor) testing of power transformers"
34.
ANSI/IEEE Std. 21 – 1976, "General requirements and test procedures for outdoor apparatus bushings”
35.
EEMAC Standard GL1-3 -1979, "Power transformer and reactor bushings"
36.
IEC Publ. 137 (1984), "Bushings for Alternating Voltages above 1000 V”
37.
Doble Client Committee on Circuit-Breakers and Bushings, "Bushing Field-Test Guide”, Document BG661
38.
A. Bargigia, M. De Nigris, C. Masetti, “Most recent developments in surge arrester testing", Proc. 56th Int. Conf. of Doble Clients. Boston, Apr. 1989.
39.
S.Shirakawa et al., "Maintenance of surge arresters by a portable leakage currentdetector", IEEE Trans. on PWRD, July 1988
40.
J. Lundquist, L. Stenstrom et al., "New method of the resistive leakage currents on metal-oxide surge arresters in service", IEEE PES Summer Meeting. Long Beach. CA, July 1989, Paper 89SM817-8 PWRD.
41.
Y. Du, M. Zahn, B.C. Lesieutre, A. V. Mamishev and S. Lindgren, ”Moisture Equilibrium in Transformer Paper-Oil Systems”, IEEE Electrical Insulation Magazine, Vol. 15, No. 1, pp. 11-20, January/February 1999.
42.
J. Fabre amd A. Pichon, “Deteriorating Processes and Products of Paper in Oil – Application to Transformers”, 1960 CIGRE Conference, Paris, France, Paper 137, 1960
43.
L. E. Lundgaard et. al., ”Ageing of oil-impregnated paper in power transformers”, 2002 IEEE Power Delivery Transactions – Derived from data presented in Table 2
44.
H. P. Moser, Transformerboard, Special Print in Scientia Electrica, Translated by EHV-Weidmann Limited, St. Johnsbury, Vermont, Section C, 1979
45.
W. A. Fessler, et. al., ”Bubble Formation in Transformers”, EPRI Report EL-5384, EPRI, Palo Alto, CA, August 1987
46.
FIST 3-5 Maintenance of Liquid Insulation: Mineral Oils and Askarels, US Dept. of Interior, Bureau of Reclamation, 1992
47.
T. V. Oommen, “Moisture Equilibrium in Paper-Oil Systems”, Proceedings of the Electrical/Electronics Insulation Conference, Chicago, IL, pp. 162-166, October 36, 1983
48.
Tables are taken from IEEE Std. C57.106-2002 381
49.
C. M. Bruce, J.D. Christie and P. Griffin, 55th Annual Conference of Doble Clients, 1988 Ed., Section 10-9.1.
50.
Table 13, Transformer Maintenance Manual, FIST 3-30, United States Department of the Interior, Bureau of Reclamation, October 2000
51.
H. Moore, “Factors Affecting the Health and Life of Transformers”, Proceedings of TechCon 2000, page 11.
52.
P.M. Balma, R. C. Degeneff, H. R. Moore, L. B. Wagenaar, “The Effect of Long Term Operation and System Conditions on the Dielectric Capability and Insulation Coordination of Large Power Transformers”, IEEE Transactions on Power Delivery, Vol. 14, No. 3, July 1999.
53.
T.V. Oommen, “Bubble Generation During Transformer Overload”, EPRI Report EL-6761, March 1990
54.
T.V. Oommen, “Further Experimentation on Bubble Transformer Overload”, EPRI Report EL-7391, March 1992
55.
T.V. Oommen, E.M. Petrie and S.R. Lindgren, “Bubble Generation in Transformer Windings Under Overload Conditions”, Paper 8E, Doble Client Conference, March 1995
56.
T.V. Oommen and S.R. Lindgren, “Bubble Evolution from Transformer Overload”, IEEE Transmission and Distribution Conference, October, 2001
57.
United States Department of the Interior (Bureau of Reclamation), Transformer Maintenance Manual, Facilities Instructions, Standards and Techniques, Volume 3-30, October 2000
58.
John C. Drotos, John W. Porter, Randy Stebbins, “Dissolved Gas Analysis of Transformer Oil”, published by the S.D. Myers Co., 1996
59.
Martin Heath Cote Associates, “Maintenance of High Voltage Transformers”, London, England, 1989
60.
B. Fallou, “Detection and Research for the Characteristics of an Incipient Fault From Analysis of Dissolved Gases in the Oil of an Insulation”, Elecktra, No. 42, pp. 31-52, 1975
61.
IEEE Standard C57.104-1991 – Guide for the Interpretation of Gases Generated in Oil-Immersed Transformers.
62.
United States Department of the Interior (Bureau of Reclamation), Transformer Maintenance Manual, Facilities Instructions, Standards and Techniques, Volume 3-30, October 2000
63.
R. R. Rogers, “IEEE and IEC Codes to Interpret Incipient Faults in Transformers Using Gas in Oil Analysis”, CEGB Transmission Division, Guilford, England, 1995
64.
International Electrotechnical Commission (IEC 60599 Edition 2), Mineral OilImpregnated Electrical Equipment in Service Interpretation of Dissolved and Free Gas Analysis, 1999
382
Generation
During
65.
T. V. Oommen, “Adjustments to Gas-in-Oil Analysis Data Due to Gas Distribution Possibilities in Power Transformers”, IEEE Transactions on Power Apparatus and Systems, Vol. PAS-101, No. 6 June 1982, pp. 1716-1722
66. United States Department of the Interior (Bureau of Reclamation), Transformer Diagnostics Manual, Facilities Instructions, Standards and Techniques, Volume 331, June 2003 67.
T.V. Oommen and E.M. Petrie, “Particle Contamination in Oil-Filled Large Power Transformers”, IEEE PES Winter Meeting, New York, January 31-February 5, 1982
68.
T.V. Oommen, “Particle Counting Of Transformer Oil: Impact Of the New Standard Based On Medium Test Dust Calibration”, Doble Conference Proceedings, March 2004.
69.
ISO 4406-1999, “Hydraulic fluid power – Fluids – Method for coding the level of contamination by solid particles”
70.
ISO 11171, “Hydraulic Fluid Power – Calibration of Automatic Particle Counters for Liquids”, Available from American National Standards Institute, 11 West 42nd Street, New York, NY 10036
71.
CIGRE Brochure N° 157, – Effect of Particles on Transformer Dielectric Strength, November 1999
72.
P.J. Sinz, Der Einfluss von Feuchte und Partikeln auf die elektrische Festigkeit von Isolierölen. Ph.D work Technical University, Graz, Austria, 1990.
73.
C. Vincent, N.G. Trinh, R. Olivier, J. Aubin, “Behavior of an oil-paper interface in presence of carbon particle contamination,” IEEE International Symposium on Electrical Insulation, Pittsburgh, USA, June 1994.
74.
NETA Maintenance Testing Specifications for Electric Power Distribution Equipment and Systems, Page 193
75.
H. Horning, J. Kelly, S. Myers, ”Transformer Maintenance Guide”, Second Edition, 2001.
76.
A. L. Rickley and R. E. Clark, “Transformer Exciting Current Measured with Doble Equipment (A Progress Report)”, Doble Client Conference Report, Sec. 6:1001 1008, 1971.
77.
Paul Gill, “Electrical Power Equipment Maintenance and Testing”, Marcel Dekker, Inc., 1998.
78.
”A Basic Guide to Thermography”, A LAND Instruments International document (www.landinst.com), 2004.
79.
Z. Azmat and D. Turner, “Infrared Thermography and its Role in Rural Utility Environment”, Rural Electric Conference, 8-10 May 2005, pp. B2/1-B2/4.
80.
IEEE C57.119-2001, “Recommended Practice for performing temperature rise tests”, page 10. 383
81.
Bob Turnbull and Steve McConnell, Southern California Edison, "How Infrared Thermography helps Southern California Edison Improve Grid Reliability", InfraMation 2000 Proceedings Volume 1. Available on the internet at http://www.flirthermography.com/media/027turnbull.pdf.
82.
Niancang Houm “The Infrared Thermography Diagnostic Technique of HighVoltage Electrical Equipments with Internal Faults”, International Conference on Power Systems Technology (POWERCON), Vol. 1, 18-21 August 1998, pp. 110115.
83.
Excerpts from ABB Contact, March 1998, Special No. 1.
84.
Tord Bengtsson, et. al., “Acoustic Diagnosis of Tap Changers”, CIGRE, Paper 12101, 1996
85.
Rick Youngblood, et. al., “Application of DGA to Detection of Hot Spots in Load Tap Changers”, Minutes of the Sixtieth Annual International Conference of Doble Clients, 1993, Sec. 6-4
86.
Rick Youngblood, et. al., “Application of DGA to Detection of Hot Spots in Load Tap Changers”, Minutes of the Sixtieth Annual International Conference of Doble Clients, 1993, Sec. 6-4
87.
M. Duval, “A Review of Faults Detectable by Gas-In-Oil Analysis in Transformers”, IEEE Electrical Insulation Magazine, May/June 2002, Vol. 18, No. 3. pp. 8-17
88.
F. Jakob, K. Jacob, S. Jones, R. Youngblood, “A Nomograph for Interpretation of LTC-DGA Data, NETA Conference, San Antonio, March 15, 2004
89. Charles Sweetser and Tony McGrail, “Sweep Frequency Response Analysis Transformer Applications – A Technical Paper from Doble Engineering”, Ver. 1.0, January 2003. 90. Various SFRA Case Studies given on Doble Engineering Website (www.doble.com), used with permission of Doble Engineering. 91. P. Picher et al., Final Report of Cigré WG A2.26, “Mechanical condition assessment of transformer windings using frequency response analysis (FRA)”, ELECTRA, No. 237, April 2008, pp. 35-45. CIGRE Technical Brochure No. 342, April 2008. (67 pages) [ISBN 978-2-85873-030-8]. 92. IEEE PC57.149TM/D1. “Draft trial-use guide for the application and interpre-tation of frequency response analysis for oil immersed transformers”. March 2006. 93. ICS27.100, F24, document No. 15182-2005. “Frequency response analysis on winding deformation of power transformers”. From the Electric Power In-dustry Standard of People’s Republic of China, June 2005. 94. IEC Committee Draft 14/626/CD, “IEC 60076-18 Ed.1: Power transformers - Part 18: Measurement of frequency response”, Nov. 2009. 95. Simon Ryder, “Frequency Response Analysis for Diagnostic Testing of Power Transformers”. Electricity Today Magazine Article, Issue 0601, 2006.
384
96.
T. V. Oommen, “Electrical Insulation Materials and Applications”, ABB publication, November 1989
97.
A. M. Elmsley and G. C. Stevens, “ A Reassessment of the Low Temperature Thermal Degradation of Cellulose”, 6th International Conference of Dielectric Materials, Measurement Applications, UK, pp. 229-232, 1992
98.
L. E. Lundgaard et. al., ”Ageing of oil-impregnated paper in power transformers”, 2002 IEEE Power Delivery Transactions.
99.
T. K. Saha, “Review of Modern Diagnostic Techniques for Assessing Insulation Condition in Aged Transformers”, IEEE Transactions on Dielectrics and Electrical Insulation, Vol. 19, No. 5, October 2003
100 B. Pahlavanpour et al. , “Experimental Investigation into the Thermal-ageing of Kraft Paper and Mineral Insulating Oil”, IEEE Int. Symp. On Electrical Insulation, Boston, MA, pp. 341-345, 2002 101. D. J. T. Hill et. al., “A Study If Degradation Of Cellulosic Insulation In Power Transformers – Part 2: Tensile Strength Of Paper”, IEE Proceedings On Scientific Measurement Techniques, Volume 147, pp 285-290, 2000 102. H. P. Moser et. al., Transformerboard II, Rapperswill, Switzerland: H. Weidmann AG, 1987 103. P. J. Burton et al. “Recent Developments by CEGB to Improve Prediction and Monitoring of Transformer Performance, CIGRE paper number 12-09, 1984 104. Mineral Insulating Oils – Method for Determining 2-Furfural and Related Compounds, IEC Document 61198, 1993. 105. T.V. Oommen, E. M. Petrie, R. B. van Breemen and C. A. Heney, “Analysis of Furanic Compounds from Cellulose Aging by GC-MS and Attempts to Correlate with Degree of Polymerization”, CIGRE Berlin Symposium, April 1993. 106. S. M. Ortel, “The Colorimetric Analysis of 2-Furfuraldehyde in Transformer Oil”, Doble Conference Paper 10A-1, 1992. 107. B. Pahlavanpour and A. Wilson, “Analysis of Transformer Oil for Transformer Condition Monitoring”, IEE Colloquim on An Engineering Review of Liquid Insulation, Digest No. 1997/003, 1997 108. A. DePablo, “Furanic Compound Analysis: a Toll for Predictive Maintenance of Oil-Filled Electrical Equipment”, CIGRE Task Force Report 15.01.03 109. X. Chendong et. al., “To Estimate the Ageing Status of Transformers by Furfural Concentration in the Oil”, CIGRE Committee 33 Colloquium, Leningrad, Moscow, 1991. 110. A. DePablo, “Furfural and Ageing: How They Are Related”, IEE Power Division Colloquium Insulating Liquids, National Grid Leatherhead, UK, 1999 111. B. Pahlavanpour, “Power Transformer Insulation Ageing”, CIGRE SC 15 Symposium, Sydney, Australia, 1995 385
112. A.B Shkolnik, K. M. Bigin and J.J. Kelly (SD Myers Inc.), “Creating a Preliminary Model for Estimating Degree of Polymerization of Thermally Upgraded Paper Based on Furan Concentrations in Transformer Oil”, Doble Conference Paper, Boston, MA, April 1999 113. A. M. Emsley et. al., “Degradation of Cellulosic Insulation in Power Transformers. Part 3: Effects of Oxygen and Water on Ageing in Oil”, IEE Proc. Sci., Measurement Techniques, Vol. 147, pp. 115-119, 2000 114. A. M. Emsley et. al., “Degradation of Cellulosic Insulation in Power Transformers. Part 2: Formation of Furan Products in Insulating Oil”, IEE Proc. Sci., Measurement Techniques, Vol. 147, pp. 115-119, 2000 115. T.V. Oommen, “Cellulose Insulation in Power Transformers: How Long Shall We Keep It?”, TechCon Conference Paper, San Diego, Jan, 2005 116. M. Perkins, G. Frimpong, A. Fazlagic, “Dielectric Frequency Response Measurement as a Tool for Troubleshooting Insulation Power Factor Problems, IEEE ISEI Conference Paper, Boston, MA, April 2002 117. U. Gafvert, G. Frimpong, J. Fuhr, “Modeling of Dielectric Measurements on Power Transformers”, CIGRE 1998 Session Paper, 08/31/98 118. G. Frimpong, M. Perkins, A. Fazlagic, U. Gafvert, “Estimation of Moisture in Cellulose and Oil Quality of Transformer Insulation Using Dielectric Response Measurements”, Doble Client Conference, Paper 8M, Boston, MA, 2001 119. Derived from Chapter 9 of “Testing of Power Transformers – Routine Tests, Type Tests and Special Tests”, ABB Publication, October 2003 120. IEC Standard 60270, Partial Discharge Measurements, 2000 121. IEEE Standard C57.113, IEEE Guide for Partial Discharge Measurements in Liquid Filled Power Transformers and Shunt Reactors 122. From Power Diagnostix website - http://www.power-technology.com/ contractors/ pressure/power_diagnostix/power_diagnostix2.html 123. VDN-Störungs- und Verfügbarkeitsstatistik – Berichtsjahr 2004, Verband der Netzbetreiber – VDN – e.V. beim VDEW
124. Transformer Lifetime Data Management, CIGRE Technical Brochure No 298 – 2006 125. IEC 60599, IEC Interpretation of the analysis of gases in transformers and other oil filled electrical equipment in service, 2007 126. IEC 60567, IEC guide for sampling of gases and oil from oil filled electrical equipment and for the analysis of free and dissolved gases, 2005 127. Duval M., Langdeau F., Gervais P. and Belanger G., “ Acceptable Dissolved Gasin-Oil Concentration Levels in Power and Instrument Transformers as a Function of Age”, DOBLE Client Conference, 1989
386
128. Testing of Power Transformers, ABB Business Area Power Transformers, Pro Print GmbH, Düsseldorf 2003 129. IEC 60 076-3, Power Transformers – Part 3: Insulation levels, dielectric test and external clearances 130. C57.12.00, IEEE Standard General Requirements Distribution, Power, and Regulating Transformers
for
Liquid-Immersed
131. C57.12.90, IEEE Standard Test Code for Mineral-Oil-Immersed Distribution, Power, and Regulating Transformers 132. Dörnenburg et.al., “Betriebsüberwachung durch Untersuchung des Isolieröls“, ETZ vol. 98, 1977 part 3, page 211 – 215 133. Duval M. et al., “Update on Hydro Quebec’s experience in the interpretation of dissolved-gas analysis in HV Transformers”, CIGRE Symposium Berlin 1993, Paper 110 – 14 134. Oommen et al., “New mechanism of moderate hydrogen gas generation in oilfilled transformers”, CIGRE Paris 1998, paper 12-206 135. Recent developments on the interpretation of dissolved gas analysis in transformers, CIGRE Brochure 296, 2006 136. Mechanical Assessment of Transformer Windings Using Frequency Response Analysis (FRA), Interim-Report CIGRE WG A2.26, 2006 137. Mechanical condition assessment of Transformer Windings using frequency response analysis (FRA), CIGRE Technical Brochure 342, 2008 138. A.J. Kachler et al.: „Kritische Anmerkungen zur Feuchtigkeitsbestimmung von Transformatoren mit der »Recovery – Voltage – Methode“, Elektrizitätswirtschaft, vol. 95 (1996) part 19, page 1238 - 1245 139. Dielectric response methods for diagnostics of power transformers, CIGRE Brochure 254, 2004 140. V.D. Houhanesian, W.S. Zaengl: “Time domain measurement of dielectric response in oil-paper insulation systems”. Presented at the 1996 IEEE Intern. Symposium on Electrical Insulation, Montreal, June 16-19,1996 141. V.D. Houhanessian: “Measurement and analysis of dielectric response in oil-paper insulation systems”. Ph.D. dissertation, Swiss Federal Institute of Technology Zürich, ETHZ, 1998 142. Static electrification in large power Transformers, CIGRE Technical Brochure No. 170, 2000 143. Lars Jonnson, “Advanced transformer control and monitoring with TEC”, ABB Review, Volume 4, 2004. 144. D.Chu, A. Lux, “On-Line Monitoring of Power Transformers and Components: A Review of Key Parameters”, Proceedings of Electrical Insulation Conference and Electrical Manufacturing & Coil Winding Conference, 26-28 Oct 1999, pp.669-675. 387
145. Trevor Lord and Graham Hodge (Lord Consulting, AVO New Zealand), “On-Line Monitoring as a Strategic Tool to Enhance Supply System Reliability”, http://www.avo.co.nz/techpapers/on-line-monitor/strategictool.php. 146. Rahmat Shoureshi, Tim Norick, Ryan Swartzendruber, “Intelligent Transformer Monitoring System Utilizing Neuro-Fuzzy Technique Approach”, PSerc Publication 04-26, July 2004. 147. Tony Pink, Peter Stewart, “Power Transformer Control System Developments”, TechCon 2004 North America. 148. Yong Liang, “Simulation of Top-Oil temperature for Transformers”, PSerc Publication 01-21, Feb 2001. 149. P. Köstinger, T.M. Bruarøy: “Drying of power transformers in the field, applying the LFH-Technology in combination with oil reclamation”, Cigre 2006. 150. V. Sokolov et al ,Moisture Equilibrium and Moisture Migration within Transformer Insulation Systems, CIGRE WG 12.18, Dublin, 2001 151. B. Fallou R.G.E Tome 79 No8 Sept. 1970 152. H.P. Moser/ V. Dahinden Transformerboard II Weidmann 1987 153. V.W.Montsinger. Loading transformers by temperature“, Trans AIEE, April 1930, pp 886-192 154. A.M.Emsley,, G.C.Stevens: “Review of chemical indicators of degradation of cellulosic electrical paper insulation in oil-filled transformers”, IEE Proc. Sci. Meas. Technol., Vol. 141, No. 5, September 1994, pp. 324-334. 155. J.Fabre, A.Pichon : “ Deteriorating processes and products of paper in oil. Application to transformers”, CIGRÉ paper 137, (Paris), 1960. 156. H.P.Moser, V.Dahinden et al.: “Application of cellulosic and non cellulosic materials in power transformers”, Cigre paper 12-12, Paris, 1986. 157. L.E.Lundgaard, W.Hansen, D.Linhjell: “Ageing of Kraft and thermally upgraded oil impregnated paper “, Nord-IS 05, Trondheim, 2005 158. L.Lundgaard, W.Hansen, D.Linhjell and T.Painter, (2002) Ageing of Oil Impregnated paper in power transformers”, IEEE Trans Pow.Del., Vol 19, No.1, 2004, pp 230-238. 159. L.E.Lundgaard, W.Hansen; S.Ingebrigtsen, D.Linhjell, M.Dahlund“ Aging of Kraft paper by acid catalyzed hydrolysis“ ICDL, 2005, Coimbra 160. S.Ingebrigtsen , M.Dahlund; W.Hansen, D.Linhjell, L.E.Lundgaard: “Solubility of carboxylic acids in Paper (Kraft)-Oil Systems”, CEIDP, Boulder, Colorado, 2004 161. P.Koestinger et al. Practical experience with the drying of power transformers in the field, applying the LFH Technology, Cigre meeting Paris 2004 162. Ø. Berg et al., Experiences from on-site transformer oil reclaiming, Cigre meeting Paris 2002
388
163. ABB Transformer Handbook, Rev 02, Sections 9.4-9.4.15, 2004. 164. IEEE C57.125 - IEEE Guide for Failure Investigation, Documentation, and Analysis fro Power Transformers and Shunt Reactor. 165. ABB Transformer Handbook, Rev 02, Sect. 14, 2004 166. ABB Transformer Handbook, Rev 02, Sect. 3, 2004 167. CIGRE Brochure N° 221, “Improving The Impact of Existing Substations on the Environment”, 2003 168. J. Vierengel et. al., “Use of Active Noise (ANC) Technology to Quiet Power Transformers”, CIGRE Report N° 12-301, 1998 169. T. V. Oommen and C. C. Claiborne, “Biodegradable Insulating Fluid from High Oleic Vegetable Oils”, CIGRE Report 15-302, 1998 170. An International Survey of Failures in Large Power Transformers in Service, ELECTRA No. 88, pp. 21-48, 1983 171. Forced Outage Performance of Transmission Equipment, Canadian Electricity Association Report for the Period January 1, 1998 to December 31, 2002, pp. 80-95. 172. Brochure CIGRE N° 248-2004 – Guide on Economics of Transformer Management. 173. C. Bengtsson, J-O. Persson, M. Svenson, Replacement- and refurbishment strategies for transformer populations, CIGRE Colloquium SC 12, Dublin, 2001. 174. P. Boss, T. Horst, P. Lorin, K. Pfammatter, A. Fazlagic, M. Perkins, Life Assessment of Power Transformers to Prepare a Rehabilitation based on a Technical –Economical Analysis, Report 12-106, CIGRE SC 12, Session 2002. 175. L. Pettersson, N.L. Fantana and U. Sundermann, “Life Assessment: Ranking of Power Transformers Using Condition Based Evaluation, A New Approach”, CIGRE Paris Conference Paper 12-204, 1998 Session 176. L. Pettersson, J.O. Persson, N.L. Fantana and K. Walldén, “Condition Based Evaluation of Net Transformers, - Experience from a New Ranking Proceedure”, CIGRE Paris Conference Paper 12-108, 2002 Session 177. T. Grestad & K. Renström, "Experiences From Oil Reclaimed on Energized Power Transformers", International Conference Power Transformers 6-7 April 2000, New Delhi, India, Sect. III, p125-134 178. O. Berg, K. Herdlevar, M. Dahlund, K. Renström, A. Danielsen, U. Thiess, “Experiences from on-site transformer oil reclaiming”, Paper 12-103, CIGRE Paris Session 2002 179. P. Koestinger, E. Aronsen, P. Boss, “Practical experience with the drying of power transformers in the field, applying the Low Frequency Heating Technology (LFH)“, Paper A2-205, CIGRE Paris Session 2004
389
INDEX
ACCESSORIES ................. 71, 149, 284 ACCESSORY FAILURES ............ 64, 73 ACETYLENE................ 96, 99, 103, 107 ACID NUMBER ............................ 81, 82 ACOUSTIC PARTIAL DISCHARGE. 288 ACOUSTIC SIGNAL......................... 267 ADVANCED DGA (ADGA) ............... 117 ADVANCED DIAGNOSTICS BROCHURE ................................. 437 AGING........................ 95, 205, 294, 295 AIR CLEANER FINE TEST DUST (ACFTD) ............................... 118, 119 APPARENT CHARGE.............. 224, 267 ASEA........................................ 320, 322 AXIAL COLLAPSE ........................... 199 AXIAL WINDING COLLAPSE .......... 199
CARBON DIOXIDE ...... 96, 99, 104, 106 CARBON MONOXIDE ............... 96, 104 CELLULOSE .............................. 85, 204 CHARGE GENERATION ............. 56, 57 CHARGE RELAXATION .................... 56 CHENDONG .................................... 208 CONDUCTIVITY .............................. 215 COOLERS........................ 288, 307, 339 COOLING......... 23, 24, 27, 30, 285, 288 COPPER .......................................... 121 Core ................................................. 188 CORE....... 19, 20, 28, 29, 143, 313, 327 CORE GROUND . 110, 116, 142, 217, 218, 219, 220, 313, 314 INADVERTENT CORE GROUND 142 LAMINATIONS ............................. 142 CORONA DISCHARGES......... 166, 336 CREEPAGE ................................. 25, 35
B
D
BUBBLE EVOLUTION ................. 92, 93 BUBBLES......................................... 166 BUCHHOLZ RELAY.. 97, 101, 240, 243, 245, 246, 247, 275, 310, 311 BUCKLING............................... 200, 201 BUSHING CONDENSER BUSHINGS ............. 32 CORE ....................................... 32, 75 DISSOLVED GAS ANALYSIS (DGA) .................................................. 156 MOISTURE................................... 156 OIL SAMPLING ............................ 154 POWER FACTOR MEASUREMENT .................................. 158, 161, 164 TYPE T ......................................... 173 TYPE U......... 164, 165, 167, 168, 169 VOLTAGE TAP............. 32, 33, 36, 37
De-ENERGIZED TAP CHANGER (DETC) ................................. 306, 313 DEGREE OF POLYMERIZATION (DP) 74, 113, 204, 205, 207, 208, 209, 210, 295, 296, 314 DEHALOGENATION OF OILS ....................................... 335 DEPABLO ................................ 208, 209 DETC ....................................... 189, 192 DIELECTRIC FREQUENCY RESPONSE (DFR) ....................... 256 SIGNATURES ..... 216, 217, 218, 219, 220, 221 DISSIPATION FACTOR 64, 90, 91, 175, 176, 211 DISSOLVED GAS ANALYSIS (DGA) 64, 82, 96, 97, 102, 106, 107, 108, 113, 117, 126, 252, 308, 310, 311 OIL SAMPLING PROCEDURE....... 97
A
C CAPACITANCE... 24, 74, 135, 139, 159, 175, 176 390
TOTAL DISSOLVED COMBUSTIBLE GASES (TDCG) .................. 96, 107 DRYING INSULATION SYSTEM DRYING. 298, 305, 328, 333 E ECONOMICS MANAGEMENT OF TRANSFORMER FLEETS .................................... 347 ELECTROMAGNETIC FIELDS (EMF) .............................................. 335, 336 ETHANE............................................. 96 ETHYLENE ................................ 96, 107 EXCITATION TEST... 74, 144, 145, 146, 252 F FACTORY REPAIR. 325, 326, 327, 328, 329 FAILURE ANALYSIS.......... 67, 237, 240 FAILURE RATE... 59, 60, 66, 68, 77, 78, 237, 324, 342, 343, 344, 345, 346, 348, 350 FANS.................................................. 18 FAULT ANALYSIS ................... 237, 238 FAULT LOCALIZATION ........... 244, 309 FIELD SERVICES BROCHURE....... 429 FLASHOVERS ................. 257, 258, 261 Frequency response......................... 184 FREQUENCY RESPONSE................ 74 Frequency response analysis........... 184 FREQUENCY RESPONSE ANALYSIS (FRA) .............................. 74, 255, 266 FURANS ............................ 82, 207, 284 G GAS CHROMATOGRAPHY............... 74 GASKETS ........................ 307, 321, 323 GENERATOR STEP-UP TRANSFORMER .......................... 242 GROUND RESISTANCE ......... 143, 219 GROUNDED SPECIMEN TEST (GST) ..... 134, 136, 137, 138, 140, 159, 163, 217 GROUNDED SPECIMEN TEST WITH GUARD (GST/G) . 134, 136, 137, 138, 140, 159
H HEALTH ................................... 353, 373 HIGH VOLTAGE TESTING..... 325, 329, 330, 333 HIPOT .............................................. 318 HOT OIL SPRAY HEATING ..... 298, 299 HYDROGEN ................ 74, 96, 102, 107 HYDROLYSIS OF CELLULOSE............................. 80 I INDUCTIVELY COUPLED PLASMA (ICP) ............................................. 120 INFRARED................. 74, 149, 150, 153 INHIBITOR ................... 82, 91, 300, 306 INSULATION RESISTANCE ... 131, 132, 133, 142, 249, 250, 275, 279, 304, 309, 313, 314 INSULDUR....... 105, 205, 206, 207, 209 INTERFACIAL TENSION 80, 81, 82, 90, 91 IRON ................................ 118, 120, 121 K KARL FISCHER ................................. 88 KRAFT PAPER ..... 72, 83, 85, 205, 207, 209 L LEAKAGE CURRENT ........................ 78 LIGHTNING...................................... 329 LOAD TAP CHANGER.... 40, 41, 42, 43, 44, 45, 46, 47, 48, 49, 52, 53, 69, 79, 113, 117, 180, 285, 288, 307, 317, 318, 319, 320, 321, 322, 323, 343, 344 ACOUSTIC SIGNAL ..................... 178 ARCING TAP SWITCH................... 40 DISSOLVED GAS ANALYSIS (DGA) .......................................... 179, 181 DIVERTER SWITCH ...................... 40 GE TYPE LR300........................... 318 GE TYPE LR400........................... 318 GE TYPE LR500........................... 318 MOTOR CURRENT...................... 178 MOTOR DRIVE ............................ 307 PREVENTIVE AUTO .......... 41, 42, 43 391
REACTANCE TYPE ........... 41, 42, 43 REINHAUSEN ...................... 320, 322 RELAY TIMING ............................ 179 RESISTANCE TYPE ................ 44, 45 STENESTAM RATIO (DGA)......... 180 TAP SELECTOR ............................ 53 WESTINGHOUSE TYPE UTH...... 319 WESTINGHOUSE TYPE UTT ...... 319 WESTINGHOUSE TYPE UVT...... 319 WESTINGHOUSE TYPE UVW..... 319 LOAD TAP CHANGER ENGINEERING, PARTS & SERVICE BROCHURE 445 LOAD TAP CHANGER RETROFITS BROCHURE ................................. 443 LOW FREQUENCY HEATING. 299, 305
OIL RECLAIMING ... 294, 295, 297, 300, 301, 306 OLTC........................................ 188, 192 ON-SITE COIL REBLOCKING BROCHURE ................................. 449 ON-SITE REPAIR .... 326, 327, 328, 330 OOMMEN................................... 87, 112 OSTWALD COEFFICIENT............... 104 OVERHEATING CELLULOSE ........................ 100, 106 Local ............................................... 73 TERMINAL ........................... 168, 171 OXIDATION ................................. 81, 91 OXYGEN................ 82, 96, 99, 101, 312
M
PAPER CONTAMINATION .............. 220 PARTIAL DISCHARGE ... 33, 46, 74, 75, 83, 100, 111, 112, 116, 157, 223, 224, 226, 227, 229, 231, 233, 254, 265, 267, 284, 329, 330 ACOUSTIC ................................... 233 PARTICLE ANALYSIS ............. 121, 304 EFFECT ON DIELECTRIC STRENGTH .............................. 122 PARTICLE COUNT . 118, 119, 121, 122, 123, 125 POLARIZATION....... 133, 249, 256, 270 POLARIZATION CURRENTS .......... 256 POLARIZATION INDEX ................... 133 POLYCHLORINATED BIPHENYLS (PCB).............. 83, 169, 173, 334, 335 PORCELAIN .................................... 153 POWER FACTOR33, 82, 140, 165, 304, 314, 315, 316 TAP......................................... 34, 316 TIP-UP.......................................... 141 PRESERVATION SYSTEMS ........... 101 PRPDA..................................... 227, 266
MAINTENANCE .... 36, 66, 92, 294, 302, 303, 304, 305, 306, 307, 315, 317, 318, 319, 320, 322, 323 MATURE TRANSFORMER MANAGEMENT BROCHURE....... 433 MECHANICAL STRESS .................... 77 MECHANISM ......................... 43, 47, 53 MEGGER ......... 126, 129, 131, 142, 143 METHANE.................................. 96, 102 MIGRATING INK .............................. 166 MOISTURE ... 74, 77, 83, 84, 86, 87, 88, 89, 92, 93, 94, 95, 183, 215, 219, 288, 291, 305, 315, 332, 388 MOLONEY ............................... 320, 429 MONITORING. 284, 285, 286, 288, 290, 291, 292, 293 MTD METHOD OF PARTICLE COUNTING .......................... 118, 119 N NEUTRALIZATION NUMBER ............ 81 NITROGEN ........................................ 96 NOISE CONTROL METHODS ................. 338 O OIL IMMERSED TRANSFORMERS 126 OIL LEVEL INDICATOR................... 311 OIL PRESERVATION ...................... 101 OIL QUALITY ....................... 79, 89, 250 392
P
R RECOVERY VOLTAGE METHOD (RVM) ........................... 256, 266, 270 REFURBISHMENT .......................... 324 REGENERATION............................. 306 REMANENT FLUX ................... 277, 278
REPAIR... 105, 150, 305, 311, 324, 327, 458 RISK ASSESSMENT . 60, 355, 370, 371 ROGERS RATIO.............. 110, 111, 112 RUST ............................................... 259 S SAFETY .... 39, 300, 302, 303, 318, 334, 335, 340, 349, 353, 354, 355, 356, 357, 359, 360, 361, 362, 364, 366, 373, 375, 377 SAMPLING.. 97, 98, 109, 118, 156, 321, 322 SATURATION .............................. 89, 90 Short circuit ...................................... 190 SHORT CIRCUIT ....... 73, 116, 309, 310 SHORTED TURNS .......................... 202 Single phase transformer ................. 189 SLUDGE ...................... 81, 86, 259, 300 SPECIFIC GRAVITY .......................... 80 SPRING MECHANISM....................... 35 STANDARDS ............... 32, 33, 158, 329 STATIC CHARGE ............................ 262 STREAMING ELECTRIFICATION ELECTROSTATIC CHARGING TENDENCY (ECT).......... 55, 56, 58 SUBSTATION .......................... 338, 374 SURFACE PROTECTION................ 308 SURGE ARRESTERS................ 76, 244 T TANK........................ 136, 140, 284, 317
TAP SELECTOR . 42, 43, 44, 48, 52, 53, 258, 318 TEMPERATURE . 18, 79, 88, 90, 93, 95, 103, 132, 175, 178, 288, 299 INDICATORS................................ 244 THROUGH-FAULT. 67, 69, 70, 142, 312 TRACKING............................... 116, 319 TRANSFORMER RELOCATION BROCHURE ................................. 453 TRANSFORMER REMANUFACTURING BROCHURE ...................................................... 425 TRANSFORMER TURNS RATIO (TTR) 41, 128, 129, 130, 249, 250, 251, 275 U UNGROUNDED SPECIMEN TEST (UST) ..... 36, 134, 136, 137, 139, 140, 158, 163, 217 V VACUUM DRYING........................... 298 W WATER ... 79, 83, 84, 85, 86, 89, 90, 91, 92, 205, 318 WINDING RESISTANCE 126, 127, 142, 249, 251, 275, 279 Windings .......................... 190, 191, 192 WINDINGS....................... 131, 199, 313 X X-WAX ..................................... 262, 263
393
ABB Transformers Service General Brochures
395
396
Insert here the 7 pages general brochure (cover page but not the last back page with ABB contacts)
397
398
399
400
401
402
403
404
ABB Transformers Service Product Leaflets
405
Insert here a blank page, then the following leaflets Leaflets: - Condition Assessment - Spare Parts - Drying - Oil reclaiming - Repair and upgrade - Increase power - Nomex - On-Site-Repair - On-line monitoring
406
Page
Page
407 409 411 413
408 410 412 414
415 417 419 421
416 418 420 422
ABB TRES North America Service Brochures
423
424
Transformer Remanufacturing ABB Factory Services Help Protect Your Important Power Transformer Investments When a transformer goes down, one of your major assets has stopped producing income but is still accruing costs. ABB knows our clients need their assets up and working in the shortest possible time to produce the power that customers need. Our facilities in St. Louis, Missouri provide full capabilities to service power transformers, including dismantle, design, repair, rebuild, and comprehensive electrical testing. As the largest transformer manufacturer in the world, ABB knows the challenges our clients face and how to meet them. Like many businesses, utilities and industry are asked to do more with less: • Produce more power without adding transformers • Maintain the same physical plant with fewer resources • Improve competitive position with lower O&M and capital cost Repairing a power transformer, instead of replacing it, can lower capital and maintenance costs dramatically and provide a quicker turnaround than buying a new one. This results in clients realizing a higher return out of the investments already made. With top quality work backed by comprehensive OEM technology, years of repair experience, and the largest transformer design database in the world, ABB offers superior reliability – resulting in less time, money, and personnel that have to be devoted to maintenance.
425
Transformer Remanufacturing
Power Transformer Remanufacturing Resources at a Glance Design Documentation and Drawing Database
ABB maintains the most extensive OEM database in the transformer industry with design documents on file from Asea, BBC, General Electric, Moloney, and Westinghouse. Resources include:
• Millions of design drawings for most transformers installed in the US • More than 80 design, materials, and project engineers and technicians dedicated to customer field support • Engineering studies • Core form and shell form capability Shipping and Receiving
When moving power transformers, ABB uses only highly qualified riggers and haulers that meet ABB’s stringent ISO9001 criteria for heavy hauling. We track the transformer during shipments and provide risk of loss insurance to protect against any damage during the transportation process. A fleet of 14 rail cars including five special Schnabel cars and six heavy-duty depressed center cars, as well as off-road modular platform trailers, 400-ton, Schnabel trailers are available to meet these stringent transportation requirements.
426
Major Plant Equipment and Systems ABB facilities in St. Louis, Missouri are ISO 9001 registered to meet the repair requirements for most large power transformers. Major equipment and systems include:
• Multiple Georg lines for core cutting • Disassembly isolation/remediation area • 360 tons of overhead crane capacity • Core stacking tables for disassembly, inspection, and assembly • Core form winding areas that include horizontal, vertical, and GE layer machines • Insulation fabrication • Dry-process ovens for newly-manufactured windings • VapoTherm processing • Paint shop and specialty shipping department
Testing The ABB state-of-the-art testing facilities ensure accurate and repeatable test results. At the St. Louis plant, ABB has full dielectric and thermal testing capability up to 345 kV, 1050 KV BIL, and 300 MVA.
Testing equipment includes:
• Impulse tests to 1050 kV BIL • Haefeley oscilloscopes for impulse measurement • Tettex and Haefeley equipment for resistance and losses measurements • Tettex transformer turns ratio (TTR) test set • Hipotronics 800 kV DC applied test set • Corona measurement system • Temperature tests with gas in oil
427
Field Services for Power Transformers Servicing Power Transformers On Site Power transformers are valuable assets, and companies —utility as well as industrial—have every incentive to keep them running reliably for as long as possible. ABB has what it takes to service your power transformers. ABB TRES (Transformer Remanufacturing and Engineering Solutions) is uniquely qualified to test, analyze, and improve upon any power transformer, regardless of original manufacturer. For any requirement, from a single OEM part, to a maintenance program, to a long-term Asset Management program, ABB’s TRES is the best choice to keep your power transformers online and operating efficiently, 24/7. ABB has the most extensive OEM database in the transformer industry with design documents on file for Asea, BBC, ABB, General Electric, Moloney, and Westinghouse. ABB offers many upgrades that exceed original operation specifications. We fabricate and maintain a huge inventory of OEM parts as well.
429
Power Transformer Field Service Resources at a Glance Planning:
Planning is a critical step in a successful transformer service job. Identifying potential obstacles, conducting route surveys to determine transportation requirements, and doing engineering assessments are only a few of the many steps taken in the planning phase. Utilizing the millions of transformer drawings and years of expertise, the 100+ professionals at ABB ensure that your transformer arrives on schedule in a safe and cost effective manner. Transportation:
ABB provides logistical service and support to transport, relocate, coordinate, and install transformers. When moving your power transformer, ABB uses only our network of highly qualified riggers and haulers. We track the transformer during shipments and provide risk of loss insurance to protect against any damage during the transportation process. To support this business, ABB maintains a fleet of 14 rail cars including five special Schnabel cars and six heavy-duty depressed center cars as well as off-road modular platform trailers and Schnabel trailers.
430
Installation:
ABB installs over 100 transformers annually. Our highly qualified technicians and top quality equipment provide safe, accurate, rapid completion of the job. ABB’s fleet of mobile installation and oil-processing trailers can be dispatched to any job site in North America.
Maintenance and Retrofit:
ABB TRES provides preventative and corrective maintenance support for your installed equipment. Determining the best maintenance program often begins with a performance and capability study conducted by an ABB design engineer. Recommendations are made in a formal report to the operator. Many repairs and retrofits can be successfully performed onsite, avoiding the cost associated with transformer movement. Retrofit and upgrade of transformer capabilities are available in the areas of bushings, tap changers, thermal/cooling, controls, reblocking, and others.
ABB maintains 15 mobile work trailers with the finest installation equipment available, including: • Semi-tractor with 15-ton hydraulic crane • Motor-generator set • Air compressor and air dryer • De-gassing equipment, 1800-4800 GPM • Liquid nitrogen cold traps • Cutting and welding equipment • OSHA required PPE and safety equipment • Hand tools, rigging, and lifting fixtures • Electrical test equipment • Oil test equipment
Repair:
ABB’s modern manufacturing and repair facilities in St. Louis, Missouri serve the industry when transformers must be removed from the substation for repairs. These facilities are ISO 9001 registered to meet the repair requirements for large power transformers. ABB provides full capabilities to service power transformers, including dismantle, r-design, repair, rebuild, and comprehensive electrical testing. ABB’s state-of-the-art testing facilities ensure accurate and repeatable test results. ABB has full dielectric and thermal testing capability up to 765 kV, 2050 BIL, and 1000 MVA.
MTMProgram – ABB’s Mature Transformer Management Program: Many transformer fleets in North America are approaching the end of their design lifetime, increasing the risk of unplanned outages. These outages can be catastrophic in cost, loss of revenue, and environmental and social impact. ABB TRES can identify and quantify risk fleet wide. Condition and Life Assessments are used to extend unit lifetime and optimize transformer performance. With this structured and rigorous asset management program, customers can prioritize maintenance and capital budgets to insure maximum economic benefits.
Testing and Diagnostics:
In addition to standard testing equipment and capabilities, ABB offers advanced testing and diagnostic analysis in a variety of areas, including: frequency response analysis, dielectric frequency response, ABB DGA analysis, furanic, and degree of polymerization testing. More important than the actual test is the analysis and interpretation of the results by ABB transformer design and testing experts.
431
Mature Transformer Management Program
MTMProgram™
433
Introduction The MTMProgram™ addresses the emerging issue of power transformer aging. While this subject has been a topic of discussion for over two decades, the strength of our transmission infrastructure has allowed transformers to operate beyond their design life. Deregulation and economic controls have changed the demands of new systems. These transformers that are operating beyond their design life will soon begin to fail in significant numbers. This issue can be addressed by identifying weak units through an economical approach that deals with the dynamics of the aging process.
As the largest OEM in the world with a unique history, ABB is often entrusted with diagnosing and assessing the condition of various transformers. ABB has detailed historical transformer design knowledge of nearly 75% of the installed base of large power transformers in North America, including Westinghouse, GE, Asea, Brown Boveri, and other predecessor technologies. The ABB assessment processes and technical tools developed are the natural result of our distinctive market position. ABB has developed a four-step process (Figure A): Transformer Fleet Screening Transformer Design and Condition Assessment Life Assessment/Profiling Implementation of Engineering Solutions
Figure A Steps of the ABB Mature Transformer Management Program
STEP ONE
Transformer Fleet Screening STEP TWO
Transformer Design and Condition Assessment Rigorous, unit-based design evaluation and condition assessment.
Risk of Failure Screening
STEP THREE
Life Assessment/Profiling Detailed life assessment, including design and engineering analysis for life extension of each specific transformer.
STEP FOUR
Implementation of Engineering Solutions Replacement
434
R efurbishment
Cooling Upgrade
ABB’s Four-Step Process STEP ONE
STEP TWO
Transformer Fleet Screening The fleet risk assessment process is the first or precursor step in the transformer life management process. This process is used to sort through the readily available analytical and statistical information about each transformer in the fleet. This way, accurate and intelligent action plans can be made regarding the future of each transformer and the fleet as a whole. The goal is to prioritize action plans for the transformers in the fleet and identify transformers that are candidates for detailed design and condition assessments (Figure B). Fleet screening will be performed each year as part of the program.
Figure B Typical results of the transformer fleet risk assessment
Transformer Design and Condition Assessment The transformer design evaluation and condition assessment process is a paramount step in the transformer life assessment and asset management approach. It requires rigorous, state-of-the-art analysis methods/rules typical to the design, testing, and quality assurance tools presently used by ABB designers in the design and manufacture of both core form and shell form transformers. The assessment combines input from the design assessment, historical loading, operational history, and also routine and advanced diagnostic data (Figure C).
Figure C Typical results of the short circuit strength analysis used in a life assessment study.
Little Risk of Failure
Slight Risk of Failure
High Risk of Failure
HV Radial (hoop)
HV Axial (tipping or crushing)
LV Radial (buckling)
LV Axial (tipping or crushing)
LTC Winding Radial (buckling)
LTC Winding Axial (tipping)
Relative Importance Design #1 Design #2
Design #3 Design #4
Urgent Action Needed Preventive Action Needed Normal Maintenance Action Needed
A B B
M A T U R E
T R A N S F O R M E R
M A N A G E M E N T
P R O G R A M
435
ABB’s Four-Step Process (Continued) STEP THREE
Life Assessment/Profiling Life assessment/profiling is a unit-based ranking that typifies the risk of failure based on results of the design and condition assessment. This is a more detailed and precise risk of failure estimate than a fleet risk assessment since it focuses on specific knowledge of the transformer design and actual condition assessment. The resulting ranking provides an accurate estimate of the risk of failure for the transformer, which can be compared to the expected failure risk of other transformers in the industry. Once the status of a unit is known, recommendations for maintaining, improving the unit condition, or establishing a contingency can be prioritized. The result is the elimination of high-risk units without increasing budget expenditures.
STEP FOUR
Implementation of Engineering Solutions Based on the results of this rigorous analysis program, engineered solutions are prescribed to achieve risk reduction, life extension, and in general, health improvement of the fleet. Such engineering solutions options include: Preventative and Corrective Maintenance Activities Field Repair and Retrofit Solutions Relocation and Transportation Testing and Advanced Diagnostics Factory Repair Solutions Planned Transformer Replacement Solutions
Conclusion Clearly, capital requirements for wholesale unit replacement are not economically feasible. However, neither is the revenue loss resulting from a doubling or tripling of system failures. Therefore, the logical approach is to continually identify the “weak system units” and replace, remanufacture, retrofit, or reposition these critical assets on the system before they remove themselves from service. As this system is followed over multiple years, maintenance and operating budget dollars will be directed to the highest risk units. Remaining expenditures can then be directed to mediumrisk areas. The result is a dynamic that moves high-risk units into lower risk areas and prevents the migration of low- or medium-risk units into
436
higher risk positions. As the health of your fleet continues to improve annually, ABB anticipates your operations, and maintenance budgets will begin to decrease, resulting in over-all savings for your company. ABB’s MTMProgram is distinctive in the transformer industry. Because we possess nearly 75% of the detailed transformer design database in the industry, only ABB can provide an analysis based not just on statistics, but based on this specific design knowledge. Consequently, our clients get the most accurate, detailed analysis possible. The ABB MTMProgram provides a technical, economic, optimized solution to improve the reliability and availability of your transformer fleet.
ABB Advanced Diagnostic Testing Services
ABB Transformer Repair and Engineering Services
437
Advanced Diagnostic Testing Services from the World’s Leading Manufacturer of Power Transformers ABB leadership begins with our unmatched experience in the power transformer industry. ABB Transformer and Repair Services (TRES) experts have a detailed design and development knowledge of Westinghouse, General Electric, ABB, Asea, BBC, National Industries, Moloney, and other transformers built over the years. As the successor OEM, ABB has the original design information for these units. In addition to these designs, ABB can draw on broad industry knowledge gained from years of transformer service and repair experience of all manufacturers’ transformer designs. What’s more, ABB utilizes the most up-to-date-design programs and design practices in the industry. This combi-
nation of knowledge, diagnostic tools, and field experience is what makes ABB the acknowledged leader in the field of Advanced Diagnostic Services. ABB can diagnose your power transformers and provide you with the information you need to make effective O&M decisions.
Dielectric Frequency Response — More actionable information than standard power factor tests. The Dielectric Frequency Response (DFR) test is used to assess the integrity of a transformer’s insulation system. The test determines the moisture level or presence of other contaminants in the solid insulation and the oil conductivity simultaneously with oil power factor. Standard power factor tests alone do not yield this information. This is an extremely useful tool in an overall condition assessment program. The DFR test is a measurement of the dielectric properties (i.e. capacitance, loss, and Power Factor) of the transformer’s insulation as a function of frequency. This offline test utilizes the same type of connections as the standard 60 Hz insulation power factor test. However, it covers a frequency range, typically from 1 mHz to 1,000 Hz while the standard power factor (Doble) test is done only at 60 Hz. This test yields more information with increased sensitivity to insulation issues by utilizing the dielectric response phenomenon. A further application is the Dielectric Frequency Response Signature method (DFRS), where the signature of the measured response is then compared with a modeled response of a transformer with a “normal” insulation structure and a library of signatures of known defects. The method is demonstrated by utilization in cases where high or
438
abnormal power factor results were measured in the field. The DFR test has gained popularity in recent years as a diagnostic tool for transformer insulation system testing. One important primary use of the test has been for determining the moisture content in the cellulose insulation structure of power transformers. The analysis of moisture in transformers is performed using the results of the DFR measurement and an analysis tool that models the actual insulation geometry and the insulating material (oil, paper, pressboard, etc.) of the transformer. ABB has used these tools for years in the analysis of transformers, both in the factory and in the field. The experience gained has shown the potential of the DFR test for identifying not only moisture problems, but also other defects in the transformer insulation structure.
Demonstrating the value of DFR: Case Study #1 Better information for client resulted in avoidance of unnecessary maintenance. Our client provided ABB with a list of seven transformers. In each case, moisture-in-oil test results indicated the need for oil processing and drying. Working with the client, ABB performed DFR testing and determined that only two units actually required drying, instead of seven. ABB’s recommendation to dry two transformers, while carefully monitoring the other five, afforded a significant amount of O&M savings. This also avoided over-drying and loosening the windings of several units.
Xfrmr#
Temp (°C)
Type
Construction
Oil Cond (pS/m)
Moisture by Oil Sat (%wt)
Moisture by DR (%wt)
1
23
GSU
Core
0.381
2.5
0.9
2
28
GSU
Core
0.492
1.8
0.9
3
23
GSU
Core
0.412
1.4
0.9
4
23
GSU
Core
1.34
2.8
0.7
5
13
3-wdg
Shell
1.5
*
1.2
6
27
Auto
Core
3
3.5
2
7
27
Auto
Shell
0.3
3.3
1
Surface moisture in paper, estimated from moisture in oil, compared with volume moisture in insulation measured by DFR
Demonstrating the value of DFR: Case Study #2 Carbon tracking of the insulation system identifies a problem that could have produced catastrophic failure. This transformer was investigated due to combustible gas results in the field. The DFR test was done as part of a condition assessment of the transformer to determine the cause of the gassing. The power factor results were all within the normal industry practice (less than 0.5%). The DFR result showed a noticeable deviation from normal responses. ABB’S Dielectric Frequency Response Signature method (DFRS) was used to investigate the cause of the abnormality. Comparisons were made to library DFRS cases, and carbon tracking or contamination was identified as the cause of the deviation. The chart shows a comparison of the transformer DFRS result to a case of known contamination. The fact that there was much less deviation than the library case indicated that the extent of the defect was very limited. Based on ABB Dissolved Gas Analysis and the suspected carbon tracking identified by the DFRS method, the transformer was disassembled for close inspection of the insulation structure. An area of burning of the winding was found in the high-low space of one phase of the transformer. The carbon was probably caused by a partial discharge. The photograph shows the small area where carbon was produced. Ultimately, a catastrophic failure was avoided.
439
ABB’s Advanced Dissolved Gas Analysis Software — Deeper analysis that comes from years of ABB experience. ABB has developed an internal software package that combines DGA raw data, ratios, trending, key indicators, and ABB’s resident design expertise and transformer construction knowledge to interpret the results. By combining ABB’s design and manufacturing knowledge with the analysis capabilities of the software, we offer greater analytical depth than what is standard practice in the industry. ABB’s design database of Westinghouse, GE, Asea, BBC, Moloney, National Industries, and other industrystandard transformers, combined with our modern transformer design capabilities, put ABB in the unique position of being able to offer this proprietary software. The ABB Dissolved Gas Analysis, combined with our design knowledge and factory and field testing experience, give us the ability to pinpoint specific sources and causes of gas generation, rather than simply identify general categories of gas generation.
440
Frequency Response Analysis — An important tool for identifying potential winding geometry changes. Frequency Response Analysis (FRA) is a low-voltage, offline measurement of the impedance of the transformer winding as a function of frequency. The test is performed by applying a variable frequency AC voltage to each individual winding of the transformer and measuring the current that flows out of the winding. The plot of the current divided by the voltage vs. frequency is known as the Swept Frequency Response Analysis (SFRA) of the winding.
ABB’s expert interpretation of FRA test results is an excellent method to check movement or displacement of windings or other internal winding circuit changes and is much more effective than the low-voltage impedance test routinely performed on transformers. The value of the FRA test is to identify potential winding geometry changes that may affect the ability of the transformer to withstand through- faults, helping to avoid catastrophic transformer failures.
ABB recommends the FRA test be performed in the factory at the time of original transformer testing to provide a baseline reading of the windings in an asnew condition. For installed transformers, a test in the field can be used to provide the baseline value. FRA should be performed periodically during the service life of the transformer or after a specific incident producing significant through-fault currents in the transformer. Comparison of such an FRA test to the original baseline value is very useful in diagnosing the condition of the windings.
Winding defects shown in coil displacement
441
Load Tap Changer Retrofits Application ABB load tap changer (LTC) replacements or retrofits are designed to economically solve operating problems inherent in existing tap changers, such as: LTC mechanisms that have reached the end of their useful mechanical life The rapid diminishing of parts availability and qualified service personnel on vintage equipment Forced reliance on expensive and sometimes questionable quality parts due to obsolete design or being built by former manufacturers
Before Retrofit
Cost of unplanned outages has risen dramatically
Features All mechanical parts are designed and tested for demanding service Single source for all parts and services Proven, reliable vacuum or resistive technology
After LTC Retrofit
Up-to-date tap changer designs Backed by over 80 years of transformer engineering and design experience All engineering, drafting, field modification drawings, new controls, wiring diagrams, parts, materials, and even installation can be provided
Benefits Increased transformer life up to 25 years in some cases Reduced maintenance costs
Troublesome LTC Removal
Field Installation of Replacement LTC
Improved reliability of operation, particularly under demanding conditions Increased contact live available from modern, proven tap changers Field retrofit is an economical alternative to shipping large power transformers Same downtime as same-model, active mechanism replacement
443
Load Tap Changer Retrofits Because of the wide variety of flange sizes, lead configurations and lengths, operating mechanisms, and control differences, field retrofitting has generally been considered to be impractical. ABB has proven that it is both possible and economical to retrofit an existing transformer with a new production model load tap changer. The transformer outage typically required for a retrofit is only two weeks, and all transformer work is completed at the site. ABB has designed and installed over 35 LTC retrofits on different makes of transformers, demonstrating the ability to perform custom engineering and service work with proven, predictable results. Projects include: Installation of Westinghouse UVT to non-LTC transformer Westinghouse URT UVT Federal Pacific TC-25 UVT W URT-HC Reinhausen RMV-I GE LRT Westinghouse UVT Ferranti Packard RT UVT Moloney MC Reinhausen RMV-I FP TC-25 FP LR-525 GE LRT-500
Reinhausen RMT-I Reinhausen RMT-I Reinhausen M (in-tank)
Westinghouse URH Reinhausen M Westinghouse UNR RMV-II GE LR-83 Reinhausen RMV-II Westinghouse URT
RMV-II
Load Tap Changer Retrofit Assembly is Shipped for Field Installation
Many customers have found retrofits to be a technically sound as well as an economical alternative to the purchase of a new transformer. Contact ABB or your local representative for more information.
444
Load Tap Changer (LTC) Engineering, Parts, & Service
ABB Transformer Remanufacturing & Engineering Solutions (TRES)
445
How ABB Can Help Proper Load Tap Changer (LTC) maintenance has become increasingly complex even for the best utility and industrial managers. Factors resulting from interconnections and power networks to aging equipment and the declining pool of technical experts add to the challenge. When you evaluate the liability of a single LTC failure at today’s costs, establishing an effective maintenance strategy becomes a matter no one can ignore.
OEM grade renewal parts for LTCs are available from ABB on an immediate basis anywhere in North America. When necessary, obsolete parts can be made by ABB because we maintain over seven million drawings to assure that LTC services conform to the original design specifications.
446
ABB offers a comprehensive and systematic approach to effectively maintain many manufacturers’ LTCs, including ABB, Westinghouse, Reinhausen, Moloney, GE, and others. Our LTC program can supplement existing in-house programs or work independently to satisfy the total maintenance need. ABB’s LTC team provides support 24/7, and all eld services are furnished by the ABB quali ed technicians and engineers. For services ranging from documentation and design engineering, to the latest in testing and oil processing, to providing 100% OEM grade parts and life extension kits, ABB is the best resource for all LTC service requirements. Our LTC services increase transformer life, reliability, and lower overall maintenance and operations costs.
Documentation and Engineering The ABB design engineers and technicians specialize in LTCs and the LTC interface with control circuits and power transformers. With access to an original engineering documentation and procedures database containing more than seven million drawings for most current LTC designs, our dedicated service professionals are ready to help. Services provided are: Establishing proper test procedures Identifying parts Setting proper operating parameters Performing studies to engineer improvements Troubleshooting Failure analysis
Original Replacement Parts Factory-trained engineers with years of LTC experience supervise every field project ABB undertakes. Our goal is always a quality job, on time, on budget, with total customer satisfaction.
Field Service ABB performs eld maintenance, testing, troubleshooting, and failure analysis. We match our employees to the appropriate make and model of LTC, equip them with accurate diagnostic tools, and ensure that they follow stringent procedures to minimize outage time and maximize equipment integrity and job site safety. Typical equipment includes: Timing xtures for many LTC models Testers (hi potential testers, turns ratio testers, and insulation power factor testers) Filter presses Vacuum pumps Boroscope equipment Meggers Oil test sets Custom tools High-current test sets
Whenever feasible, ABB procurement specialists restore an LTC to original speci cations when replacement parts are needed. Our procurement specialists have the ability to immediately source and deliver OEM-grade parts to customers anywhere in North America. ABB provides: Oil seats Insulating panel boards Assemblies (contact assemblies, brake assemblies, cam switch assemblies, and mechanism assemblies) Control cabinets Kits (vacuum interrupter kits, remote indication kits, voltage regulating relay kits) Arc chutes Rotary position switches Inspection door gaskets
Project Management A project engineer manages every LTC service project that ABB undertakes. The engineer assures that all engineering, drafting, purchasing, eld resource requirements, terms of service contracts, and warranty considerations always meet or exceed ABB’s corporate standards and customer expectations.
Retrofit and Upgrade Kits ABB is continuously monitoring and searching for LTC retr t and upgrade opportunities where our designs can be applied towards newer technologies and materials. In fact, a large percentage of the units ABB services involve modi cations to incorporate currently produced parts and/or upgrade units. Retr ts and upgrades often involve: Replacing obsolete LTCs with current-production LTCs Addition of a LTC to a non-LTC transformer Conversion from a reactance-type LTC to a resistance-type LTC (or the reverse procedure) Cam switch assembly and brake assembly upgrading Control modi cation Addition of paralleling equipment and/or data acquisition equipment
ABB’s LTC service capability includes all the necessary electrical, mechanical, oil testing, and processing equipment in a selfcontained trailer to perform onsite maintenance repairs or retrofits.
Each ABB service project includes: Schedule coordination 24-hour-per-day project support Project review and documentation of changes
447
ABB provides OEM-grade parts, maintenance, and modernization services for the following Load Tap Changers (LTCs). ABB
WESTINGHOUSE
UZE UZF UCG UCC UCD UBB UCL UZD
UVT UTS URT URS UTH UNR UTN UT UTR UR UB UC URF URH LR URV VR SDR PDR URT-HC URT-DTS UT-ATS URT-ATS UTT (-A,-A70, -B) URT-46, -69 UVW (UVW-A) URL-4 (-8,-16)
448
GENERAL ELECTRIC LR9 LR10 LR15 LR17 LR19 LR21 LR27 LR29 LR31 LR38 LR40 LR41 LR45R LR47 LR48 LR59 LR67
LR68 LR69 LR72 LR79 LR81 LR83 LR85 LR89 LR91 LR92 LR95 LR96 LR300 LR400 LR500 LR700
REINHAUSEN
MOLONEY
RMS-1 RMT-1 RMV-1 (-II) TYPE M TYPE T TYPE G TYPE R TYPE F TYPE MS M Delta V VV MA4 MA7/MA8 MA9
MA-1 & 2 MB MB-1 MB-2 MC MH
FEDERAL PACIFIC
ALLIS CHALMERS
McGRAW EDISON
TC-15 TC-25 TC-515 TC-525 TC-546
TLB TLH TLS
220 397 996 500 V2A
Power Transformer On-Site Coil Reblocking Service Certain large power transformers are prone to coil degradation due to various design, operating and environmental factors. Particularly, large power substation and generator step-up transformers that were built by General Electric in Pittsfield, Mass. prior to 1972. Because of aging, loading and the use of low density pressboard in their original construction, it’s probable that their coil blocking is loose. Also, these units have experienced oil box problems, with resultant cooling deficiencies. As a result: Coil clamping pressure could be less than needed to withstand a through fault Conductor and turn insulation could be abraded through excessive movement of the windings The oil box could be ruptured, starving the windings of necessary coolant. This creates hot spots in the windings and deteriorates insulation even further The transformers could fall catastrophically, which leads to the following situations: safety and ecological hazards of large oil spills, the high costs of cleanup, and the even higher costs, both financial and social, of interrupted service ABB Power Transformer Technical Services engineers have been called on by utilities for OEM support on power transformers built by ABB, Westinghouse and General Electric. ABB has a staff of former GE transformer designers and specialists, along with all the drawings and specifications, for all GE power transformers over 40 MVA.
GE power transformers are highly susceptible to coil movement. Regardless of the manufacturer, if it is feasible from a design standpoint, ABB’s field reblocking services can restore transformer integrity. Identify High Risk Transformers ABB evaluates a number of indicators to determine if reblocking is needed, including: Design and construction. Essentially all GE Mark II designs (1965-1971), Mark I designs (1959-1964), and pre-Mark I designs (pre 1959) are at risk. These units have shown a tendency for shrinkage of the low density pressboard used in their construction, resulting in loose coil blocking. Operating history. The number of faults experienced and their severity, as well as the loading history, are factors that can contribute to the loosening of the transformer coils. Gas-in-oil analysis, degree of polymerization. A high CO2/CO ratio in power transformers could indicate aging of the insulation. A more definitive test which can determine degradation of insulation is the degree of polymerization test. ABB may recommend these tests and is capable of providing the analysis.
449
Internal inspection. The only certain way to evaluate tightness of blocking and loosening of the coils is to drain the oil from the transformer then visually and physically inspect the Internals of the transformer. Some of the items inspected are: Tightness of window wedges and wedge blocks Bearing of spacers on end rings Any crushing of end rings at the bearing surface between them and spacers Clearance to the winding cylinders Alignment and tightness of radial spacers and associated channel till Oil box condition Areas that are inaccessible to visual inspection by the human eye, are viewed through a portable for a better evaluation boroscope
Define the Scope of Work By evaluating the general condition of the transformer, including bushings, tap changers and their drives, coolers, tank shielding, leads and lead supports. Determine Where the Work Can be Completed Either in the field or in an ABB repair facility. Cornpleting work in the field is preferable if there is sufficient room to position jacks, replace channel fill if necessary, and in general maneuver inside the unit.
ABB engineers have the advantage of referring to original design information arid drawings to determine the correct clamping force, the proper reblocking and fill materials and the need for any additional components that may be necessary to ensure the future reliability of the transformer Any additional components that may be needed can be supplied by ABB.
A typical General Electric Mark II power transformer with flanged ends and layers tapered. These transformers are very likely to experience coil movement problems which can be corrected by the ABB coil reblocking process.
450
Implement and Guarantee the Work ABB will review design drawings for the specific transformer. We will supply materials that meet present day design requirements. All material will be properly vapotherm processed and coordinated Estimate the Costs and Benefits to arrive at the site immediately prior to the start of Utilities cannot afford unreliable transmission the workscope. systems. Power transformers must be capable of ABB will support the job by supplying surviving in a real world environment where supervision, labor, tools and material for through faults can occur at any moment. A unit with very little or no compression force reblocking only, or can also provide complete turnkey operation including all oil handling and on the windings has virtually no short circuit testing as well. We will guarantee all materials and integrity. The result of this could be a failed workmanship in accordance with our standard transformer, which would need to be rebuilt or replaced by a new unit. The new equipment costs terms and conditions. Each ABB service project, regardless of size or can be minor compared to the unexpected service workscope, includes complete: interruption. In rare cases where on-site field reblocking is not possible, the unit can be shipped to either the ABB transformer repair facility in St. Louis
• Schedule coordination with the customer including crews and outages • Complete schedule coordination between service crews, equipment and parts delivery • 24-hour-per-day project support • Complete project review arid documentation which includes changes to the original shop order information, this ensures that any changes or modifications made are documented for future reference
Every field reblocking project ABB undertakes is supervised by factory trained engineers that average 30 years of experience. Our goal is always a quality job, delivered on time and budget, with total customer satisfaction.
Before setting the jacks in place and applying the final clamping force to the coils, all necessary spacing over the end rings is performed.
451
Railcar Rental Program for Power Transformer Relocation Moving large power transformers can be a challenge. Their large dimensions and extreme weight pose unique requirements to ensure safe and efficient transportation. ABB’s Railcar Rental Program helps customers meet those unique requirements with a fleet of specialty rail cars.
Railcar Types and Uses ABB owns, operates and rents a fleet of railcars designed specifically for the transportation of large, heavy loads. Three different types of cars are utilized based on the specific load requirements: depressed center, Schnabel and side rail. ABB’s rail specialists are available to assist you in determining the best choice.
Railcar Capacities and Daily Rates/Fees The ABB Railcar Rental Program includes the type and class of railcars listed below. Car #
Type
Load (lbs.)
Daily Rate
Fees
PTDX7060* PTDX7061* PTDX-201 PTDX-202** PTDX-203 PTDX-204 PTDX-205*
Dep Center Dep Center Schnabel Schnabel Schnabel Schnabel Side Rail
512,000 620,000 750,000 1,000,000 750,000 750,000 733,000
$2,000 $3,000 $3,500 $4,500 $3,500 $3,500 $2,000
$5,000 $10,000 $2,000 $2,500 $2,000 $2,000 $2,000
* One time loading fee – no daily charge ** A special train is required to move this car under load. Special train rates are charged on a per-mile basis In addition to normal freight charges.
Railcar Rental Arrangements and Terms ABB will help you make the choice in all areas of railcar selection, scheduling, insurance, and contracting. Rental terms are negotiated individually for each contract however; typical terms include, but are not limited to, the following: Depressed Center. The 12-axle depressed center flatcars are used primarily with larger load requirements. These cars are equipped with a cushioning system to provide a smooth ride along the rails.
•Daily rental rates are applicable from the day the car departs until the day it returns. •All freight charges are the customer’s responsibility. •Any damage to the railcar, whether caused by customer or railroad, is the responsibility of the customer.
Schnabel. Certain transformers are designed to be an integral part of the “Schnabel-type” car. The transformer attaches to railcar frames utilizing a pinning system located near the base. This allows the transformer to ride approximately six inches above the rail. These cars range in mechanical design from 12 to 20 axles. Load requirements determine car capacity requirements.
•A rental contract must be executed prior to the release of any railcar to the customer. •ABB technical assistance is required on-site during the loading and unloading of Schnabel cars utilizing ABB price list 48-519.
453
Contact list for main ABB Service Centers Below is a contact list with the main ABB Service centers. Also updated contacts for more than hundred countries are available on:
www.abb.com/transformers ___________________________________________________________________ Head Quarters ABB Management Services Business Unit Transformers Product Group Service P.O. Box 8131 Affolternstrasse 44 8050 Zürich Switzerland www.abb.com/transformers
North Asia China ABB Zhongshan Transformer Co., Ltd No.1 Haicheng North Road Hengmen, Nanlang Twon Zhongshan, Guangdong Post code: 528449 P. R. China Tel: +86 760 3392288-3802 Fax: +86 760 3392898
________________________________________________________________ Europe Denmark ABB A/S Meterbuen 33 DK- 2740 Skovlunde Denmark Tel: +45 4450 4450 Fax:+45 4450 4700 Finland ABB Oy, Transformers Strömbergin Puistotie 15D Vaasa Finland Tel: +358 50 3342235 Fax: +358 10 22 41021
454
Germany ABB AG GBU Transformatoren Delitzscher Straße 74 06112 Halle Germany Tel: +49 345 5686 247 Fax: +49 345 5686 120 Italy ABB Power Technologies SpA Unità Operativa Trasformatori Viale dell’Industria, 18 20010 Vittuone (MI) Italy Tel: +39 02 9034 71 60 Fax: +39 02 9034 7493 Norway ABB AS Power Products Division P.O.Box 470 Brakeroya N-3002 Drammen Norway Tel: +47 2416 5547 Fax: +47 3224 7934 Email : [email protected] Poland ABB Sp. z o.o. 67/93 Aleksandrowska str 91-205 Lodz Poland Tel: + 48 601079417 Fax: +48 42 6526096 Spain Asea Brown Boveri S.A. San Romualdo 13 28037 Madrid Spain Phone: +34 91 5819393 Fax: +34 91 5810733 Sweden ABB AB Power Transformers 771 80 Ludvika Sweden Tel: +46 240 784322 Fax: +46 240 13091
455
Switzerland ABB Sécheron SA Rue des Sablières 4-6. P.O. Box 2095 1211 Geneva 2 Switzerland Tel: +41 58 586 22 11 Fax: +41 58 586 23 08 Turkey ABB Elektrik San A.S. Esentepe Mah. Milangaz Cd. No.52 Kartal, Istanbul Turkey Tel: +90 216 528 2526 Fax: +90 216 387 1890 United Kingdom ABB Ltd - Transformer Service Oulton Road Stone Staffordshire, ST15 0RS United Kingdom Tel: +44 1785 825 050 Fax: +44 1785 819 019
Middle East and Africa Egypt 7, Dr.Mohamed Kamel Hussein St., El Nozha El Gadida-Heliopolis , Cairo, Egypt Tel: +20 (2) 26251555 Fax: +20 (2)26222620 Jordan ABB Ltd- Jordan P.O Box 926098 Amman 11190 Jordan Tel: +962 6 416 3122 Fax: +962 6 416 4906 Saudi Arabia – Middle East ABB Service Company Limited P.O. Box 2873 Al-Khobar 31952 Kingdom of Saudi Arabia Tel: +966 3 882 9394 Fax: +966 3 882 4603
456
South Africa ABB Campus 2 Lake Road, Longmeadow Business Estate (North) 1609, Modderfontein, Gauteng, South Africa Tel: +27 10 202 5356 Fax: +27 11 579 8571
________________________________________________________ North America Canada TRES Canada 201 Westcreek Blvd, Brampton, Ontario Canada, L6T 5S6 Tel: +1 905 460 3250 Fax: +1 905 460 3018 Mexico TRES Mexico Blvd. Centro Industrial No.12 Los Reyes Zona Industrial 54073 Tlalnepantla, Edo. De México Apartado Postal M-2434 06000 México D.F. Mexico Tel: +52 (55) 5328 1400 Ext. 3435 Fax: +52 (55) 55 65 65 28 United States of America TRES US 4350 Semple Avenue St. Louis, MO 63120-2241 USA Tel: +1 877 839 7877 Fax: +1 314 679 4595
South Asia Australia ABB Australia Pty. Limited Power Technologies Service – Transformer service Locked Bag 7315, Liverpool BC NSW 1751 Australia Tel: +61 2 9821 0228 Fax: + 61 2 98210919 New Zealand ABB Limited Private Bag 92609 Symonds Street Auckland New Zealand Tel: +64 3 3383787 Fax: +64 3 3380110
457
India ABB Ltd, Transformers Vadodara-390013 India Tel: +91 80 8395181 Fax: +91 265 638 921 Thailand ABB Ltd Transformer Repair & Service 322 Moo 4 Bangpoo Industrial Estate Soi 6 Sukhumvit Rd. Prakesa, Muang, Samutprakarn 10280 Bangkok Thailand Tel: +66 2 762 2033 Fax: +66 2 709-3368
___________________________________________________________________ South America Brazil ABB Ltda. Av. Monteiro Lobato 3411 – Guarulhos – SP Brazil Tel: +55 11 6464 8690 Fax: +55 11 6464-8399 Perú ABB S.A Avenida Argentina 3120 Lima Perú Tel : +51 1 415 5100 Fax: +51 1 561 3040
458
Related Documents
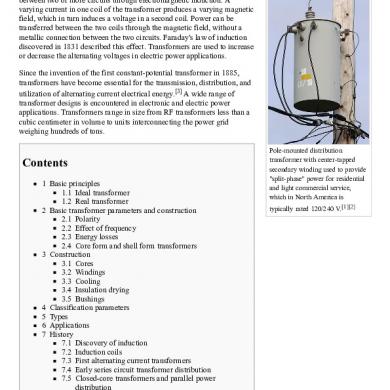
Transformer
March 2021 0
Transformer
February 2021 2
Transformer
January 2021 2
Power Transformer
February 2021 1
Transformer Design
February 2021 4
Transformer Protection
January 2021 1More Documents from "elect57_0805"


_transformer Service Handbook_version Int_v4 0_rev 3.pdf
February 2021 0