Ph Real Estate Market
This document was uploaded by user and they confirmed that they have the permission to share it. If you are author or own the copyright of this book, please report to us by using this DMCA report form. Report DMCA
Overview
Download & View Ph Real Estate Market as PDF for free.
More details
- Words: 4,350
- Pages: 36
Loading documents preview...
REAL ESTATE MARKET INSIGHTS March 18, 2019
Executive Summary •
Real Estate Values seen all-time highs across all sectors in 2019. We have seen the highest land value in Bonifacio Global City at PhP 1.3M per sqm and the highest condominium price at PhP 540K per sqm in Shang at The Fort.
•
Offices at Bay and Alabang still enjoy the lowest vacancy rate at 1% -- translating to record rental rates with PhP1.2K/sqm/month in the Bay and PhP 750/sqm/month in Alabang. Makati City and Bonifacio Global City will have very low supply of office space by 2021.
•
There is only 216k sqm of PEZA accredited space so far this year in Metro Manila against forecast demand of 450K sqm from the IT-BPM industry – this deficit will be the biggest hurdle for growth in IT-BPM expansion – there are 29 buildings (totaling 544K sqm of vacant office space) under PEZA application across Metro Manila. LPC pleads for the government to approve more PEZA zones in Metro Manila and across the Philippines. Quezon City has the largest supply of PEZA Accredited space from now until 2023.
•
The Philippines has recorded more than 200K sqm of office demand as of 1Q 2019. The IT-BPM industry led the Philippine office demand with 115K sqm or 56% of the 1Q 2019 take-up followed by the Offshore Gaming industry with 36K sqm. With Metro Manila making 92% (187K sqm) of that demand. Regional districts have started strong with Clark, Tarlac, and Davao leading the provincial sites.
•
Boom in warehousing demand in the logistics market attributed to the 226,000 sqm requirement of warehouse space needed by Online retailers.
•
There is a surge in Mainland Chinese buyers in the residential condominium sector and we anticipate for this to continue for the long term especially with rekindled diplomatic ties between Philippines and China
•
Chinese tourists are now using mobile payments such as WeChat Pay and Alipay all over the world; 93% of Chinese tourists would increase their spending if mobile payments are made available.
2
PHILIPPINE OFFICE MARKET
Metro Manila Cityscape • •
Most of these districts will be fully developed by 2020. Metro Manila may see a deficit in office supply by 2022 as key business districts maintain low vacancy rates.
PROPOSED BULACAN AEROTROPOLIS
3 MAJOR CBDs MAKATI
400 Hectares
ORTIGAS 169 Hectares BGC
300 Hectares
Quezon City
869 hectares of master-planned or Roughly
mixed-use developments spread across the 3 Major CBDS
50 BUSINESS PARKS MAKTAI. MAKATI CBD. CENTURY CITY. ROCKWELL CENTER. CIRCUIT MAKATI. QUEZON CITY. UP TECHNOHUB. EASTWOOD CITY. ETON CENTRIS. ARANETA CYBERPARK. ROBINSONS BRIDGETOWNE IT PARK. VERTIS NORTH. UP TOWN CENTER. FAIRVIEW TERRACES. ALI CLOVERLEAF BALINTAWAK. NUVO. SM CITY NORTH EDSA COMPLEX. MANDALUYONG. GREENFIELD DISTRICT. ROBINSONS CYBERGATE. ROCKWELL SHERIDAN. SAN JUAN. SANTOLAN TOWN PLAZA. ORTIGAS. ORTIGAS CBD. ROCKWELL BUSINESS CENTER. ARCOVIA CITY. SILVER CITY. CAPITOL COMMONS. PARKLINKS. MUNTINLUPA. FILINVEST CITY. LA FUERZA. NORTHGATE CYBERZONE. MADRIGAL BUSINESS PARK. ALABANG WEST. AYALA SOUTH PARK. TAGUIG. ARCA SOUTH. BONIFACIO GLOBAL CITY. UPTOWN. VERITOWN. BONIFACIO CAPITAL DISTRICT LAS PINAS. PORTOFINO. EVIA. PASAY. NEWPORT CITY. SM MALL OF ASIA COMPLEX. METROPOLITAN BUSINESS PARK. DOUBLE DRAGON CYBERCAMPUS. FILINVEST CYBERZONE PASAY. PARANAQUE. ASIAWORLD CITY. ASEANA BUSINESS PARK. AYALA ASEANA. WESTSIDE CITY. MANILA. CITYPLACE. SAN LAZARO.
Approximately 1,891.5 hectares spread across 50 business parks
4 UPCOMING RECLAMATION PROJECTS 1. New Manila Bay International Community (UAA Kinming Group) 2. Manila Waterfront City (WMPD) 3. Solar City Urban Center (MGDC). 4. Coastal Bay Project (SMPH).
1,508 hectares of upcoming reclaimed land shared across 4 projects
San Juan
Manila
1 2
Mandaluyong
3 4
Bay/ Pasay
Ortigas/ Pasig
Makati BGC / Taguig
Parañaque
Las Pinas
Alabang
4
100 KMS TO CLARK
PROPOSED BULACAN AEROTROPOLIS
LEGEND
FILLED – APPROVED PROJECTS
EXISTING INFRASTRUCTURE
OUTLINED – PROPOSED PROJECTS
1
C6 EXTENSION (SEMME) C5 EXTENSION
2021
1
NAVOTAS RECLAMATION PROJECT
2
2
PASAY/ SM 360 RECLAMATION PROJECT
3
CAVITE LAGUNA EXPRESS WAY
2020
3
MCCRP NORTH SECTOR RECLAMATION – SOUTH PARCEL/ MANILA SOLAR CITY (MGDC)
4
NORTH HARBOR LINK
2020
5
MAKATI – BGC SKYTRAIN
2021
LAS PIÑAS – PARAÑAQUE COASTAL BAY PROJECT (ALLTECH)
6
LRT 1 EXTENSION - CAVITE
2021
5
MANILA HARBOR CENTER 50 HAS.
7
NLEX – SLEX CONNECTOR 1
2021
6
BRADI’S SMART HARBOR MANILA
8
NLEX – SLEX CONNECTOR 2
2021
7
NEW MANILA/ UAA KINGMING RECLAMATION
9
MAKATI INTRA-CITY SUBWAY
2025
8
BASECO RECLAMATION PROJECT
10
JICA SUBWAY
2025
9
MANILA WATERFRONT CITY RECLAMATION
10
MCCRP NORTH SECTOR RECLAMATION – NORTH PARCEL (ASSERCO)
11
HORIZON MANILA RECLAMATION (JBROS)
12
PASAY HARBOUR 265 RECLAMATION PROJECT
13
PARAÑAQUE 300 RECLAMATION (SMPHI)
14
844 RECLAMATION BY CAVITEX HOLDINGS (PROVINCE)
15
420 HECTARES RECLAMATION PROJECT (BACOOR)
16
PP. NO. 88 FOR PHIL. NAVY RECLAMATION
17
SANGLEY POINT INTERNATIONAL AIRPORT (PROVINCE)
18
5-ISLAND RECLAMATION BY CENTURY PEAK (PROVINCE)
19
MANILA BAY INTEGRATED FLOOD CONTROL, COASTAL DEFENSE AND EXPRESSWAY PROJECT
TOTAL
Malabon Navotas
Quezon City
EDSA
Marikina
Caloocan NORTH HARBOR
SOUTH HARBOR
145.9 km
Pasig
Mandaluyong Makati
MANILA BAY Pasay
Taguig PROPOSED SANGLEY AIRPORT
NAIA
Parañaque
Las Piñas
13,560 Ha.
19 Projects totaling 13,560 Hectares of reclaimed land along with an infrastructure pipeline of 85.2 Kms of road and 60.7 Kms of rail within Metro Manila and its immediate vicinity has sparked a Rebirth of Manila Bay Interest
Rizal
San Juan
Manila
Muntinlupa
SLEX
4
TOTAL
Valenzuela
2020
C5
LEGEND
North Caloocan
LAGUNA DE BAY
Regional Cityscape LAOAG. CAMELLA. VALDEZ CENTER. CAGAYAN. CAGAYAN SPECIAL ECONOMIC ZONE AND FREEPORT. PROJECT PRIMO. BAGUIO. BAGUIO AYALA LAND TECHNOHUB. SM BAGUIO CYBERZONE BUILDING. PCH IT CENTER. ABANAO SQUARE. NUEVA ECIJA. PALAYAN CITY GOV’T. CENTER & CENTRAL BUSINESS HUB TARLAC. LUISITA BUSINESS PARK. TARLAC PROVINCIAL IT PARK. BULACAN. PDC TECHNOPARK. ALTARAZA. FIRST BULACAN IT PARK. CIUDAD DE VICTORIA. ABS-CBN CAMPUS. HORIZON IT PARK RIZAL. HIGHLAND CITY URDANETA. CB MALL.
Over
101 I.T. parks and
business districts
Countryside development going through unprecedented construction boom driven by
IT-BPM and tourism.
PAMPANGA. CLARK GLOBAL CITY. CLARK SPECIAL ECONOMIC ZONE. PHILEXCEL BUSINESS PARK. BERTAPHIL BUSINESS PARK. SM CITY CLARK. CLARK GREEN CITY. NEPO CENTER. ALVIERA. CAPILION. THE INFINITY. FILINVEST MIMOSA. SKYTECH IT PARK AKLAN. BORACAY NEW COAST. CAPIZ. PUEBLO DE PANAY TECHNOPARK. ILOILO. ILOILO TECHNOHUB. ATRIA PARK DISTRICT. GAISANO CAPITAL. AYALA SICOGON. ILOILO BUSINESS PARK. BACOLOD. LOPUE’S EAST IT CENTER. ONE AND TWO SANPARQ. THE BLOCK IT PARK. ROBINSONS CYBERGATE CENTER. THE UPPER EAST LOPUE’S SOUTHSQUARE IT PARK. BACOLOD IT PARK. CAPITOL CENTRAL. DUMAGUETE. DUMAGUETE BUSINESS PARK. LINKSYS IT PARK. LP IT PARK. YY STAR DAS.
Unprecedented countryside development.
134,096 hectares of master-planned or
Approximately
LAOAG CAGAYAN
2
2
BAGUIO
4
mixed-use developments
CAVITE. BATANGAS. LAGUNA. VERMOSA. PONTEFINO. SUNTECH IT PARK. HAMILO COAST. NUEVA ECIJA 2 2 SMDM IT CENTER. SOUTHFORBES IT PARK. SOUTHWOODS. NUVALI. ETON CITY. BATSTATEU 12 BULACAN/RIZAL PAMPANGA KNOWLEDGE, INNOVATION AND SCIENCE PARK. 7 MAPLE GROVE. PANGASINAN 1 1 QUEZON CAVITE / GREENFIELD CITY. PUERTO AZUL. BATANGAS 13 CEBU. CEBU IT PARK. CEBU SRP. / LAGUNA CEBU BUSINESS PARK. MACTAN NEWTOWN. ABOITIZLAND CEBU. WATERFRONT TOWNSHIP. CITTA DE MARE. SMC. OAKRIDGE BUSINESS PARK. AKLAN 1 1 CAPIZ GATEWAY CENTRAL INFORMATION TECHNOLOGY PALAWAN PARK. ILOILO 5 10 CEBU BOHOL. TAGBILARAN IT HUB DAVAO. MATINA IT 4 BACOLOD 7 PARK. ABREEZA. DAVAO PARK DISTRICT. LANANG IT PARK. DAMOSA IT PARK. NORTHPOINT. 1 BOHOL CAMELLA. CIUDADES. LUBI ISLAND PLANTATION. DUMAGUETE 4 ROBINSONS CYBERPARK DAVAO. A57 TECHNO PARK. AZUELA COVE. 5 PALAWAN. LIO RESORT TOWN. SAN CAGAYAN DE ORO VICENTE. PUERTO PRINCESA. ROXACO ZAMBOANGA 4 LAND BUSUANGA. QUEZON. BALESIN 12 ISLAND CLUB DAVAO ZAMBOANGA. MEGALAND MALL. CITYMALL ZAMBOANGA. ZAMBOECOZONE AND FREEPORT NEW TOWNSHIP. ZAMBOECOZONE Legend: HIGHLANDS. CAGAYAN DE ORO. Number of townships LIMKETKAI CENTER. SM CITY BPO 2. CENTRIO. ONE PROVIDENCE. HABINI 6 BAY DEVELOPMENT. TARLAC
Philippine Office Demand Activity
Building Completion | Industry | District (As of 1Q 2019) As of 1Q 2019, the Philippines has recorded more than 200K sqm of office demand. Metro Manila makes up 92% of the take-up with 187K sqm. The regional districts have started strong as well with Davao coming in at second with 6K sqm take-up followed by Clark and Tarlac with 5K sqm each. The IT-BPM industry led the Philippine office demand for 1Q 2019 with 115K sqm or 56% of the 2019 take-up followed by the Offshore Gaming industry with 36K sqm.
*Gross Leasable Area
7
Metro Manila Demand Activity Industry | District (As of 1Q 2019)
1Q 2019 Metro Manila Demand Activity is now at 187,000 sqm, or about 15% of FY 2018 Demand Activity -- We are optimistic in our FY 2019 demand forecast to reach 1.2M sqm. The IT-BPM industry led the office take-up for 1Q 2019 with 102,000 sqm or 54% of the 2019 take-up followed by the Offshore Gaming industry with 37,000 sqm take-up. The other notable industry is the Flexible Workspace with 5,000 sqm take-up. Quezon City remains the top location for the IT-BPM industry due to its high supply of PEZA space. It will be the go-to district for IT-BPM expansions in 2019. The Offshore Gaming industry still chooses the Bay City as their preferred location.
*Gross Leasable Area
8
Metro Manila Demand Activity FY 2016 | FY 2017 | FY 2018 | 1Q 2019
The IT-BPM industry continues the upward trend since 2017 with now having 102K sqm take-up in three months. We expect for it to grow at a faster pace and reach the forecasted 450K sqm take-up in 2019 should there be more PEZA spaces available in the market
*Gross Leasable Area in thousands (sqm)
9
Regional Demand Activity Industry | District (As of 1Q 2019)
The regional districts have started strong with Davao having 6K sqm take-up followed by Clark and Tarlac with 5K sqm each. We expect Clark Global City to absorb most of the demand for office space outside of Metro Manila. The IT-BPM industry have continued occupying office space outside Metro Manila and moved to the regions across the country where there are available PEZA spaces and a qualified labor pool.
*Gross Leasable Area
10
Philippines Office Supply Current vs. Pipeline
Philippine office supply will grow by 34% in the next 5 years. The unprecedented level of developments outside Metro Manila is expected to add 1.23 million square meters to its current supply of 2.08 million. We forecast Clark Global City to be largest producer of office space outside Metro Manila in the next 5 years.
11
METRO MANILA OFFICE MARKET
Metro Manila Office Supply Current vs. Pipeline
Current vacancy rate across Metro Manila is at 5.57% Offices at Bay and Alabang still enjoy the lowest current vacancy rate at 1%. Makati City and Bonifacio Global City will have a very low supply of new buildings coming in by 2021. We are seeing record high office rental rates across the districts. Bay and Ortigas Center will be the largest suppliers of office space in the next 5 years.
Current supply
for 58 years (1960s to 2018)
Pipeline supply
for 5 years (2019 to 2023E)
10.94M sqm 3.12M sqm
Legend:
Leased
Pre-committed
Vacant
13
Metro Manila Office Supply Pipeline Per District, Per Year (2019 to 2023E)
Metro Manila will continue to see decreasing office supply in the next 5 years, therefore we anticipate a significant increase in rents during this period. In 2021, Metro Manila will see a 38% decrease in new supply that will be added in the market. After 2019, Bonifacio Global City will not have a new stock added until 2023.
3.12M sqm Total supply 2019 to 2023E
*Gross Leasable Area in thousands (sqm)
Legend:
Leased
Under Nego
Vacant
14
Metro Manila Office Supply - PEZA Status PEZA vs. Under Application for PEZA vs. Non-PEZA Vacant Spaces
There is only 216k sqm of PEZA accredited space so far this year in Metro Manila against forecast demand of 450K sqm from the ITBPM industry – this deficit will be the biggest hurdle for growth for the IT-BPM industry – there are 29 buildings (totaling 544K sqm of vacant office space) under PEZA application across Metro Manila. Quezon City will be the go-to district because of the five available townships with PEZA Accredited spaces that can cater to the expansion requirements of the IT-BPM industry.
*Gross Leasable Area in thousands (sqm)
Legend:
PEZA
Under App
None
15
Metro Manila Office Supply - PEZA Status 1960 to 2023 PEZA Vacant Space
There are only 26 PEZA Accredited buildings (totaling 912K sqm vacant space) that can accommodate a take-up of 10,000 sqm and above. Only Quezon City can accommodate the demand from the IT-BPM industry from now until 2023.
16
Regional Office Supply
Pampanga, Cebu, and Davao - Current vs. Pipeline Supply Cebu, Davao, and Pampanga are the major business districts outside Metro Manila contributing about 2.4M sqm of office to the Philippine Supply. Cebu leads the supply of office space outside Metro Manila with more than 1M sqm of office supply with only 57,000 sqm of vacant space available, but we expect Clark to provide supply within the next five years to rival that of Cebu.
*Gross Leasable Area in thousands (sqm)
Legend:
Leased
Vacant
17
Regional Office Supply
Other Regions - Current vs. Pipeline Supply The ever-growing IT-BPM industry significantly impacts acceleration of developments not just in Metro Manila, but all over the Philippines. The efforts of the National Government to fund infrastructure projects positively impact cities nearby Metro Manila such as Cavite, Laguna, and Pampanga as these cities become more accessible.
*Gross Leasable Area in thousands (sqm)
Legend:
Leased
Vacant
18
Economic Drivers by the numbers IT-BPM & POGO Industries
The IT-BPM and POGO Industries continue to be significant demand drivers for office space. The IT-BPM industry generates about USD 1.2B to the office annual rental income while the POGO Industry generates an estimate of USD 170M. These industries contribute about USD 16.5B to the Philippine Economy. In just 3 years, the POGO industry contributed USD 8.2B of salaries which exceeds the IT-BPM industry with USD 6.4B. The POGO Industry is also notable driver for the residential market which generates an annual housing rental income of USD 501M. CONTRIBUTION TO THE PH ECONOMY
ESTIMATED YEARLY SALARY IT-BPM POGO PhP 338B or PhP 435B or USD 6.4B USD 8.2B
ESTIMATED YTD FIT-OUT COST (including furniture, fixtures & technology)
IT-BPM PhP 488B or USD 9.2B
POGO PhP 70.2B or USD 1.3B
Component
Estimated Contribution to the PH Economy
IT-BPM Salaries
USD 6.4B
IT-BPM Office Rental
USD 1.2B
POGO Salaries
USD 8.2B
POGO Office Rental
USD 170M
POGO Housing Rental
USD 501M
ESTIMATED EMPLOYEE FOOTPRINT IT-BPM 1.3M
POGO 354K
ESTIMATED ANNUAL HOUSING RENTAL POGO PhP 26.6B or USD 501M
Estimated Total Contribution to the PH Economy
16.5B
ESTIMATED ANNUAL OFFICE RENTAL IT-BPM POGO PhP 64B or PhP 8.9B or USD 1.2B USD 170M
USD Conversion = $ 53
Source: Bureau of Immigration, IBPAP Organization
19
Real Estate Values
Land Values – Various Sectors as of 1Q 2019 Real Estate Values seen all-time highs across all sectors in 2019. We have seen the highest land value in Bonifacio Global City at PhP 1.3M per sqm and the highest condominium price at PhP 540K per sqm in Shang at The Fort. The Growing Tourist Market (7.1 Million Tourists in 2018) has led to record high prices in tourist hotspots nationwide. Industrial Land values hit highs due to scarcity of supply, especially in the Greater Metro Manila Area.
Luxury Village Properties continue to be a strong and steady investment option given the limited supply. Dasmarinas Village leads the way commanding up to 450,000 per sqm. Golf Shares also ride land values to all time high share prices. Luxury Condominiums also see record high prices, with the poshest condominiums priced at over half a million pesos per sqm.
Commercial
Residential
Tourism
Industrial
Business District
Values PhP/sqm
Luxury Village
Values PhP/sqm
Tourism Hotspot
Values PhP/sqm
Industrial District
Values PhP/sqm
Arca South
300K – 350K
Forbes Park
350K – 400K
El Nido
30K – 40K
Laguna
7K – 8K
Bay City
350K – 450K
Dasmarinas Village
350K – 450K
San Vicente
10K
Cavite
5K – 6K
BGC
480K – 1.5M
Urdaneta
320K
Siargao
10K – 25K
Batangas
6.5K – 7.5K
Davao
195K – 220K
Corinthian
190K
Mactan
12K
Pampanga
6K – 7K
Filinvest City
309K – 420K
Greenhills
250K
Cebu
6.5K – 7.5K
Makati City
400K – 1.2M
Green Meadows
300K
Golf Club
Share Value
Bulacan
6K – 7K
Ortigas
250K – 600K
Valle Verde
200K
Manila Golf
65M
Cagayan De Oro
4K – 5K
Clark
99K *simulated sale
Ayala Alabang
95K – 130K
Wack Wack
35M
Cebu
190K – 350K
Hillsborough
70K
Alabang Country Club
7M
Golf Club Shares
Condominiums Luxury Flat
Values PhP/sqm
Horizon Homes
540K
The Estates
533K
20 20
INDUSTRIAL
Logistics Market
Warehousing Requirements The rise of the E-Commerce industry in the Philippines is driving up the need for warehouse space of Online retailers Online retailers are the fastest growing in the logistics market in terms of warehouse expansion requirements demanding 226,000 Sq.M or 44% of 516,000 sqm.
Source: LPC Research, LPC Industrial Pipeline, Various News Articles
22
Logistics Market
Warehouse Demand arising from E-Commerce Every PhP 50B increment of E-commerce revenue generates 125,000 Sq.M of warehouse demand E-commerce alone will take up about 773,000 SqM of warehouse space by 2023 Warehousing requirements will be increasing on an annual growth rate (CAGR) of 34% YOY
E-Commerce warehouse take up is projected to annually grow by 34% till 2023
773 577 431
CAGR 2019 – 2023 34% 2015-2018 24%
321 240 134
89
110
70
2015
2016
2017
*Warehouse Space (SqM) in Thousands Source: CBRE Research, Google-Temasek
Legend:
2018
2019
2020
2021
2022
2023
Demand of warehouse space for E-Commerce per year
23
Logistics Market Warehouse Specifications
E-Commerce is changing how warehouses are typically designed; designs are becoming more sophisticated Due to higher specifications, warehouse construction costs are expected to increased by 43% but will translate to a 66% increase in average warehouse lease rates
Past Specifications
New Specifications
70% of lot area
Warehouse Footprint
70% of lot area
30% of lot area
Open Area
30% of lot area
4 Meters to 8 Meters
Ceiling Height (Clear Height)
8 Meters to 12 Meters
3,000 psi
Floor Loading
3,000 psi (8 – 10 meters) 4,000 psi (10 – 12 meters)
Drive in type of loading bay 3 bays per 5,000 sqm
Loading Bays
4 Meter depth with canopy 6 bays per 5,000 sqm
PhP 14,000 P/Sq.M
Average Construction Costs
PhP 20,000 P/Sq.M
1,000 to 5,000 sqm
Typical Warehouse Sizes
2,000 Sq.m to 10,000 Sq.m
BTS: 10 years RBF/SFB: 3 – 5 years
Typical Lease Terms
BTS: 10 years RBF/SFB: 3 – 5 years
PhP 120 – 150 p/sqm
Typical Lease Rate
PhP 220 – 250 p/Sq.M
Other New Specifications: Wet stand pipe, smoke detector and sprinkler system
3-phase electricity
Roll up doors
Small office/mezzanine office and CR facilities
High bay lights
Reinforced concrete flooring with rebars at 8 inches depth
RESIDENTIAL
The Chinese Impact
Coming of New Residential Market There is a surge in Mainland Chinese buyers in the residential condominium sector and we anticipate for this to continue for the long term especially with rekindled diplomatic ties between Philippines and China. Because of foreseen significant shift in buyers, residential sales will no longer be dominated by the OFWs
“1Q 2018: half of residential sales came from overseas buyers of which 50% are mainland China. If we don’t control them, it could reach up to 90%” – DMCI
President Isidro Consunji
Chinese investors accounted for 34% of sales compared to 10% in 2016
30% of 1Q residential sales are Chinese buyers up from 10% in 2017 and less than 5% in 2016
Source: Nikkei Asian Review. DOT, DOLE, Ayala Land Annual Report
26
Inventory Analysis
Project Performance by location in Metro Manila Mainland China buyers have preference for CBD districts, near schools & support commercial retail and near Chinese communities or locations where there are already existing Chinese (Usually takes up 20% to 45% of foreign buyers) Assuming with a constant aggregate take-up of 7,757 units, the remaining inventory will be depleted in 3 months
*Depletion of inventory = Unsold units / total monthly take-up **Average monthly take-up = Total monthly take-up / no. of current projects Source: LPC Research
27
Shang at The Fort is the Most Expensive Condominium Metro Manila price ranges are positioned at PhP 113K/sqm to PhP 540K/sqm
Shang at The Fort (Horizon Homes) has seen the most expensive condominium price at PhP 540K per sqm. Sustained demand amidst limited supply of condominiums in Makati enabled prices to an all-time high of PhP 533,000/sqm due to growing affluent market
Residential condominium buyers are mostly Investors rentals for BPO and POGO market and Professionals for End-use Mainland Chinese make up the largest share of foreign buyers for investment purposes Developers may start to have a focus group targeting Chinese market and look for Chinese developers as partners
28 Source: LPC Research
The Chinese Impact
Coming of New Residential Market Chinese buyers will continue to push property prices up. BAY AREA 2019
2009 164%
PhP 270k/sqm
PhP 102k/sqm Sea Residences
Current Price
Launch Price
SMDC
2019
2009 74%
Anchor Land 2018 Selling Price: PhP 285k/sqm % Sold: 75% Take-up: 192 units/month Turnover: 2024
PhP 228k/sqm
PhP 131k/sqm Solemare Park Suites
Copeton Baysuites
Current Price
Launch Price
Anchor Land
2019
2009
Gentry Manor
200%
PhP 91k/sqm Bay Garden Club Federal Land
Launch Price
Megaworld
PhP 273k/sqm Current Price
2018 Selling Price: PhP 322k/sqm % Sold: 75% Take-up: 35 units/month Turnover: 2024
29
The Chinese Impact
Coming of New Residential Market Strong demand has led to tenants dictating record high prices for rental units. Rental rates have seen an increase of up to 80% of rates from 3 years ago BAY GROWTH IN RENTAL RATES in Bay area 1BR units have gone from Php25,000 back in 2015 to Php45,000 while a 2BR unit’s price rose from Php55,000 to Php85,000 High Rental rates - Bay: P1.2k to P1.6k per sqm per month Alabang: P1k to P1.6k per sqm per month Tenants are maximizing the area of the unit by fitting 4 people in 1BR units, and 8 people in 2BR units Lease terms - Prefer to pay in cash for 1 year advance and 6 months deposit
The Chinese Impact
Coming of New Residential Market High rental growth rates in Bay and Alabang are driven by Chinese workers from offshore gaming customers and mainland Chinese who frequent brick and mortar casinos compared to Non-POGO tenants in Makati and BGC A total of 57 POGO licenses were issued from 2016 to 2019
31 Source: LPC Research (based on a 1BR unit), price excl. of VAT
TOURISM
Asia Pacific International Tourist Arrivals FY 2017 vs. FY 2018
The World Tourism Organization’s (UNWTO) Global Tourist Arrivals for 2020 was unexpectedly achieved in 2018, with 1.4 billion arrivals. Philippine tourist arrivals grew by 7% from 6.6 million in 2017 to 7.1 million in 2018. China continues to be the driver for tourism in Asia as seen in Hong Kong with 14% growth, 15% in South Korea and the 30% growth in the Philippines. Countries which enforced simpler visa requirements attracted more visitors as evident in Japan, Vietnam and Myanmar which grew by at least 9% to as much as 22% in tourist arrivals.
Exponential Chinese Tourist Influx Top 10 Tourist Market in the Philippines
In 2018 the Philippines grew by a notable 7.6%, surpassing the global average of tourist arrivals The top 3 source markets of Philippine Tourism are: South Korea, China, and USA. South Korea remained the top source market with 1.6 million arrivals despite its -1.2% decrease in 2018. However, China continues to be the fastest growing market with 34% increase.
Mobile Payments boosts Chinese Tourists’ spending Chinese Tourists exhibiting stronger purchasing power
In 2017, Mainland Chinese tourist became the biggest spenders and contributed the most to Global Tourism Revenue with USD 258B which is almost twice as much as US-tourist spending of USD 135B.
Chinese tourists are now using mobile payments such as WeChat Pay and Alipay all over the world; 93% of Chinese tourists would increase their spending if mobile payments are made available. About 1,000 establishments in the Philippines are starting to accept payment via Chinese mobile payment applications. Being open to more mobile payments will encourage the Mainland Chinese tourists to spend more than an average of USD 1K per day.
RUSSIA
EUROPE $3,754 USA $4,462
GERMANY FRANCE
S.KOREA $3,007
AUSTRIA SWITZERLAND
HK $2,847
UNITED ARAB ERIMATES
MACAU $2,335 THAILAND $2,026
WECHAT PAY AND ALIPAY WECHAT PAY ONLY
Source: Nielsen Global, WeChat Pay, Alipay (TechinAsia), AUB-Vice President Maria Magdalena Surtida
JAPAN $2,952
TAIWAN $2,027 PHILIPPINES $1,154
SINGAPORE $2,971 AUSTRALIA $3,541
Our Insights. Your Success.
Real Estate Options
DISCLAIMER: 1. This Leasing Material has been prepared in good faith and with due care by LPC solely for the information of potential lessees to assist them in deciding whether they are interested in the premises offered for lease. 2. The information does not form part of any offer or contract and is intended as a guide only 3. You should not rely on any material contained in this Leasing Material but should make independent investigations to satisfy yourselves as to the correctness and relevance of any statements or representations, and consult with legal, financial and tax advisers where appropriate. 4. All calculations including, but not limited to dimensions, area and rent, contained in the Leasing Material are based on figures provided to the client by outside sources and have not been independently verified by LPC and therefore may not be correct, complete, or relevant 5. No representation or warranty is made by LPC as to the accuracy or completeness of the Leasing Material, in whole or in part. No liability for negligence or otherwise is assumed by LPC or the lessor of this property for any information contained in the Leasing Material 6. All Dollar ($) amounts quoted, if any, do not include any goods and services tax, value added tax, consumption tax or similar tax unless specifically stated in writing 7. Except as expressly indicated herein, LPC does not undertake any obligation to advise you of any changes or updates with respect to the information contained herein
Executive Summary •
Real Estate Values seen all-time highs across all sectors in 2019. We have seen the highest land value in Bonifacio Global City at PhP 1.3M per sqm and the highest condominium price at PhP 540K per sqm in Shang at The Fort.
•
Offices at Bay and Alabang still enjoy the lowest vacancy rate at 1% -- translating to record rental rates with PhP1.2K/sqm/month in the Bay and PhP 750/sqm/month in Alabang. Makati City and Bonifacio Global City will have very low supply of office space by 2021.
•
There is only 216k sqm of PEZA accredited space so far this year in Metro Manila against forecast demand of 450K sqm from the IT-BPM industry – this deficit will be the biggest hurdle for growth in IT-BPM expansion – there are 29 buildings (totaling 544K sqm of vacant office space) under PEZA application across Metro Manila. LPC pleads for the government to approve more PEZA zones in Metro Manila and across the Philippines. Quezon City has the largest supply of PEZA Accredited space from now until 2023.
•
The Philippines has recorded more than 200K sqm of office demand as of 1Q 2019. The IT-BPM industry led the Philippine office demand with 115K sqm or 56% of the 1Q 2019 take-up followed by the Offshore Gaming industry with 36K sqm. With Metro Manila making 92% (187K sqm) of that demand. Regional districts have started strong with Clark, Tarlac, and Davao leading the provincial sites.
•
Boom in warehousing demand in the logistics market attributed to the 226,000 sqm requirement of warehouse space needed by Online retailers.
•
There is a surge in Mainland Chinese buyers in the residential condominium sector and we anticipate for this to continue for the long term especially with rekindled diplomatic ties between Philippines and China
•
Chinese tourists are now using mobile payments such as WeChat Pay and Alipay all over the world; 93% of Chinese tourists would increase their spending if mobile payments are made available.
2
PHILIPPINE OFFICE MARKET
Metro Manila Cityscape • •
Most of these districts will be fully developed by 2020. Metro Manila may see a deficit in office supply by 2022 as key business districts maintain low vacancy rates.
PROPOSED BULACAN AEROTROPOLIS
3 MAJOR CBDs MAKATI
400 Hectares
ORTIGAS 169 Hectares BGC
300 Hectares
Quezon City
869 hectares of master-planned or Roughly
mixed-use developments spread across the 3 Major CBDS
50 BUSINESS PARKS MAKTAI. MAKATI CBD. CENTURY CITY. ROCKWELL CENTER. CIRCUIT MAKATI. QUEZON CITY. UP TECHNOHUB. EASTWOOD CITY. ETON CENTRIS. ARANETA CYBERPARK. ROBINSONS BRIDGETOWNE IT PARK. VERTIS NORTH. UP TOWN CENTER. FAIRVIEW TERRACES. ALI CLOVERLEAF BALINTAWAK. NUVO. SM CITY NORTH EDSA COMPLEX. MANDALUYONG. GREENFIELD DISTRICT. ROBINSONS CYBERGATE. ROCKWELL SHERIDAN. SAN JUAN. SANTOLAN TOWN PLAZA. ORTIGAS. ORTIGAS CBD. ROCKWELL BUSINESS CENTER. ARCOVIA CITY. SILVER CITY. CAPITOL COMMONS. PARKLINKS. MUNTINLUPA. FILINVEST CITY. LA FUERZA. NORTHGATE CYBERZONE. MADRIGAL BUSINESS PARK. ALABANG WEST. AYALA SOUTH PARK. TAGUIG. ARCA SOUTH. BONIFACIO GLOBAL CITY. UPTOWN. VERITOWN. BONIFACIO CAPITAL DISTRICT LAS PINAS. PORTOFINO. EVIA. PASAY. NEWPORT CITY. SM MALL OF ASIA COMPLEX. METROPOLITAN BUSINESS PARK. DOUBLE DRAGON CYBERCAMPUS. FILINVEST CYBERZONE PASAY. PARANAQUE. ASIAWORLD CITY. ASEANA BUSINESS PARK. AYALA ASEANA. WESTSIDE CITY. MANILA. CITYPLACE. SAN LAZARO.
Approximately 1,891.5 hectares spread across 50 business parks
4 UPCOMING RECLAMATION PROJECTS 1. New Manila Bay International Community (UAA Kinming Group) 2. Manila Waterfront City (WMPD) 3. Solar City Urban Center (MGDC). 4. Coastal Bay Project (SMPH).
1,508 hectares of upcoming reclaimed land shared across 4 projects
San Juan
Manila
1 2
Mandaluyong
3 4
Bay/ Pasay
Ortigas/ Pasig
Makati BGC / Taguig
Parañaque
Las Pinas
Alabang
4
100 KMS TO CLARK
PROPOSED BULACAN AEROTROPOLIS
LEGEND
FILLED – APPROVED PROJECTS
EXISTING INFRASTRUCTURE
OUTLINED – PROPOSED PROJECTS
1
C6 EXTENSION (SEMME) C5 EXTENSION
2021
1
NAVOTAS RECLAMATION PROJECT
2
2
PASAY/ SM 360 RECLAMATION PROJECT
3
CAVITE LAGUNA EXPRESS WAY
2020
3
MCCRP NORTH SECTOR RECLAMATION – SOUTH PARCEL/ MANILA SOLAR CITY (MGDC)
4
NORTH HARBOR LINK
2020
5
MAKATI – BGC SKYTRAIN
2021
LAS PIÑAS – PARAÑAQUE COASTAL BAY PROJECT (ALLTECH)
6
LRT 1 EXTENSION - CAVITE
2021
5
MANILA HARBOR CENTER 50 HAS.
7
NLEX – SLEX CONNECTOR 1
2021
6
BRADI’S SMART HARBOR MANILA
8
NLEX – SLEX CONNECTOR 2
2021
7
NEW MANILA/ UAA KINGMING RECLAMATION
9
MAKATI INTRA-CITY SUBWAY
2025
8
BASECO RECLAMATION PROJECT
10
JICA SUBWAY
2025
9
MANILA WATERFRONT CITY RECLAMATION
10
MCCRP NORTH SECTOR RECLAMATION – NORTH PARCEL (ASSERCO)
11
HORIZON MANILA RECLAMATION (JBROS)
12
PASAY HARBOUR 265 RECLAMATION PROJECT
13
PARAÑAQUE 300 RECLAMATION (SMPHI)
14
844 RECLAMATION BY CAVITEX HOLDINGS (PROVINCE)
15
420 HECTARES RECLAMATION PROJECT (BACOOR)
16
PP. NO. 88 FOR PHIL. NAVY RECLAMATION
17
SANGLEY POINT INTERNATIONAL AIRPORT (PROVINCE)
18
5-ISLAND RECLAMATION BY CENTURY PEAK (PROVINCE)
19
MANILA BAY INTEGRATED FLOOD CONTROL, COASTAL DEFENSE AND EXPRESSWAY PROJECT
TOTAL
Malabon Navotas
Quezon City
EDSA
Marikina
Caloocan NORTH HARBOR
SOUTH HARBOR
145.9 km
Pasig
Mandaluyong Makati
MANILA BAY Pasay
Taguig PROPOSED SANGLEY AIRPORT
NAIA
Parañaque
Las Piñas
13,560 Ha.
19 Projects totaling 13,560 Hectares of reclaimed land along with an infrastructure pipeline of 85.2 Kms of road and 60.7 Kms of rail within Metro Manila and its immediate vicinity has sparked a Rebirth of Manila Bay Interest
Rizal
San Juan
Manila
Muntinlupa
SLEX
4
TOTAL
Valenzuela
2020
C5
LEGEND
North Caloocan
LAGUNA DE BAY
Regional Cityscape LAOAG. CAMELLA. VALDEZ CENTER. CAGAYAN. CAGAYAN SPECIAL ECONOMIC ZONE AND FREEPORT. PROJECT PRIMO. BAGUIO. BAGUIO AYALA LAND TECHNOHUB. SM BAGUIO CYBERZONE BUILDING. PCH IT CENTER. ABANAO SQUARE. NUEVA ECIJA. PALAYAN CITY GOV’T. CENTER & CENTRAL BUSINESS HUB TARLAC. LUISITA BUSINESS PARK. TARLAC PROVINCIAL IT PARK. BULACAN. PDC TECHNOPARK. ALTARAZA. FIRST BULACAN IT PARK. CIUDAD DE VICTORIA. ABS-CBN CAMPUS. HORIZON IT PARK RIZAL. HIGHLAND CITY URDANETA. CB MALL.
Over
101 I.T. parks and
business districts
Countryside development going through unprecedented construction boom driven by
IT-BPM and tourism.
PAMPANGA. CLARK GLOBAL CITY. CLARK SPECIAL ECONOMIC ZONE. PHILEXCEL BUSINESS PARK. BERTAPHIL BUSINESS PARK. SM CITY CLARK. CLARK GREEN CITY. NEPO CENTER. ALVIERA. CAPILION. THE INFINITY. FILINVEST MIMOSA. SKYTECH IT PARK AKLAN. BORACAY NEW COAST. CAPIZ. PUEBLO DE PANAY TECHNOPARK. ILOILO. ILOILO TECHNOHUB. ATRIA PARK DISTRICT. GAISANO CAPITAL. AYALA SICOGON. ILOILO BUSINESS PARK. BACOLOD. LOPUE’S EAST IT CENTER. ONE AND TWO SANPARQ. THE BLOCK IT PARK. ROBINSONS CYBERGATE CENTER. THE UPPER EAST LOPUE’S SOUTHSQUARE IT PARK. BACOLOD IT PARK. CAPITOL CENTRAL. DUMAGUETE. DUMAGUETE BUSINESS PARK. LINKSYS IT PARK. LP IT PARK. YY STAR DAS.
Unprecedented countryside development.
134,096 hectares of master-planned or
Approximately
LAOAG CAGAYAN
2
2
BAGUIO
4
mixed-use developments
CAVITE. BATANGAS. LAGUNA. VERMOSA. PONTEFINO. SUNTECH IT PARK. HAMILO COAST. NUEVA ECIJA 2 2 SMDM IT CENTER. SOUTHFORBES IT PARK. SOUTHWOODS. NUVALI. ETON CITY. BATSTATEU 12 BULACAN/RIZAL PAMPANGA KNOWLEDGE, INNOVATION AND SCIENCE PARK. 7 MAPLE GROVE. PANGASINAN 1 1 QUEZON CAVITE / GREENFIELD CITY. PUERTO AZUL. BATANGAS 13 CEBU. CEBU IT PARK. CEBU SRP. / LAGUNA CEBU BUSINESS PARK. MACTAN NEWTOWN. ABOITIZLAND CEBU. WATERFRONT TOWNSHIP. CITTA DE MARE. SMC. OAKRIDGE BUSINESS PARK. AKLAN 1 1 CAPIZ GATEWAY CENTRAL INFORMATION TECHNOLOGY PALAWAN PARK. ILOILO 5 10 CEBU BOHOL. TAGBILARAN IT HUB DAVAO. MATINA IT 4 BACOLOD 7 PARK. ABREEZA. DAVAO PARK DISTRICT. LANANG IT PARK. DAMOSA IT PARK. NORTHPOINT. 1 BOHOL CAMELLA. CIUDADES. LUBI ISLAND PLANTATION. DUMAGUETE 4 ROBINSONS CYBERPARK DAVAO. A57 TECHNO PARK. AZUELA COVE. 5 PALAWAN. LIO RESORT TOWN. SAN CAGAYAN DE ORO VICENTE. PUERTO PRINCESA. ROXACO ZAMBOANGA 4 LAND BUSUANGA. QUEZON. BALESIN 12 ISLAND CLUB DAVAO ZAMBOANGA. MEGALAND MALL. CITYMALL ZAMBOANGA. ZAMBOECOZONE AND FREEPORT NEW TOWNSHIP. ZAMBOECOZONE Legend: HIGHLANDS. CAGAYAN DE ORO. Number of townships LIMKETKAI CENTER. SM CITY BPO 2. CENTRIO. ONE PROVIDENCE. HABINI 6 BAY DEVELOPMENT. TARLAC
Philippine Office Demand Activity
Building Completion | Industry | District (As of 1Q 2019) As of 1Q 2019, the Philippines has recorded more than 200K sqm of office demand. Metro Manila makes up 92% of the take-up with 187K sqm. The regional districts have started strong as well with Davao coming in at second with 6K sqm take-up followed by Clark and Tarlac with 5K sqm each. The IT-BPM industry led the Philippine office demand for 1Q 2019 with 115K sqm or 56% of the 2019 take-up followed by the Offshore Gaming industry with 36K sqm.
*Gross Leasable Area
7
Metro Manila Demand Activity Industry | District (As of 1Q 2019)
1Q 2019 Metro Manila Demand Activity is now at 187,000 sqm, or about 15% of FY 2018 Demand Activity -- We are optimistic in our FY 2019 demand forecast to reach 1.2M sqm. The IT-BPM industry led the office take-up for 1Q 2019 with 102,000 sqm or 54% of the 2019 take-up followed by the Offshore Gaming industry with 37,000 sqm take-up. The other notable industry is the Flexible Workspace with 5,000 sqm take-up. Quezon City remains the top location for the IT-BPM industry due to its high supply of PEZA space. It will be the go-to district for IT-BPM expansions in 2019. The Offshore Gaming industry still chooses the Bay City as their preferred location.
*Gross Leasable Area
8
Metro Manila Demand Activity FY 2016 | FY 2017 | FY 2018 | 1Q 2019
The IT-BPM industry continues the upward trend since 2017 with now having 102K sqm take-up in three months. We expect for it to grow at a faster pace and reach the forecasted 450K sqm take-up in 2019 should there be more PEZA spaces available in the market
*Gross Leasable Area in thousands (sqm)
9
Regional Demand Activity Industry | District (As of 1Q 2019)
The regional districts have started strong with Davao having 6K sqm take-up followed by Clark and Tarlac with 5K sqm each. We expect Clark Global City to absorb most of the demand for office space outside of Metro Manila. The IT-BPM industry have continued occupying office space outside Metro Manila and moved to the regions across the country where there are available PEZA spaces and a qualified labor pool.
*Gross Leasable Area
10
Philippines Office Supply Current vs. Pipeline
Philippine office supply will grow by 34% in the next 5 years. The unprecedented level of developments outside Metro Manila is expected to add 1.23 million square meters to its current supply of 2.08 million. We forecast Clark Global City to be largest producer of office space outside Metro Manila in the next 5 years.
11
METRO MANILA OFFICE MARKET
Metro Manila Office Supply Current vs. Pipeline
Current vacancy rate across Metro Manila is at 5.57% Offices at Bay and Alabang still enjoy the lowest current vacancy rate at 1%. Makati City and Bonifacio Global City will have a very low supply of new buildings coming in by 2021. We are seeing record high office rental rates across the districts. Bay and Ortigas Center will be the largest suppliers of office space in the next 5 years.
Current supply
for 58 years (1960s to 2018)
Pipeline supply
for 5 years (2019 to 2023E)
10.94M sqm 3.12M sqm
Legend:
Leased
Pre-committed
Vacant
13
Metro Manila Office Supply Pipeline Per District, Per Year (2019 to 2023E)
Metro Manila will continue to see decreasing office supply in the next 5 years, therefore we anticipate a significant increase in rents during this period. In 2021, Metro Manila will see a 38% decrease in new supply that will be added in the market. After 2019, Bonifacio Global City will not have a new stock added until 2023.
3.12M sqm Total supply 2019 to 2023E
*Gross Leasable Area in thousands (sqm)
Legend:
Leased
Under Nego
Vacant
14
Metro Manila Office Supply - PEZA Status PEZA vs. Under Application for PEZA vs. Non-PEZA Vacant Spaces
There is only 216k sqm of PEZA accredited space so far this year in Metro Manila against forecast demand of 450K sqm from the ITBPM industry – this deficit will be the biggest hurdle for growth for the IT-BPM industry – there are 29 buildings (totaling 544K sqm of vacant office space) under PEZA application across Metro Manila. Quezon City will be the go-to district because of the five available townships with PEZA Accredited spaces that can cater to the expansion requirements of the IT-BPM industry.
*Gross Leasable Area in thousands (sqm)
Legend:
PEZA
Under App
None
15
Metro Manila Office Supply - PEZA Status 1960 to 2023 PEZA Vacant Space
There are only 26 PEZA Accredited buildings (totaling 912K sqm vacant space) that can accommodate a take-up of 10,000 sqm and above. Only Quezon City can accommodate the demand from the IT-BPM industry from now until 2023.
16
Regional Office Supply
Pampanga, Cebu, and Davao - Current vs. Pipeline Supply Cebu, Davao, and Pampanga are the major business districts outside Metro Manila contributing about 2.4M sqm of office to the Philippine Supply. Cebu leads the supply of office space outside Metro Manila with more than 1M sqm of office supply with only 57,000 sqm of vacant space available, but we expect Clark to provide supply within the next five years to rival that of Cebu.
*Gross Leasable Area in thousands (sqm)
Legend:
Leased
Vacant
17
Regional Office Supply
Other Regions - Current vs. Pipeline Supply The ever-growing IT-BPM industry significantly impacts acceleration of developments not just in Metro Manila, but all over the Philippines. The efforts of the National Government to fund infrastructure projects positively impact cities nearby Metro Manila such as Cavite, Laguna, and Pampanga as these cities become more accessible.
*Gross Leasable Area in thousands (sqm)
Legend:
Leased
Vacant
18
Economic Drivers by the numbers IT-BPM & POGO Industries
The IT-BPM and POGO Industries continue to be significant demand drivers for office space. The IT-BPM industry generates about USD 1.2B to the office annual rental income while the POGO Industry generates an estimate of USD 170M. These industries contribute about USD 16.5B to the Philippine Economy. In just 3 years, the POGO industry contributed USD 8.2B of salaries which exceeds the IT-BPM industry with USD 6.4B. The POGO Industry is also notable driver for the residential market which generates an annual housing rental income of USD 501M. CONTRIBUTION TO THE PH ECONOMY
ESTIMATED YEARLY SALARY IT-BPM POGO PhP 338B or PhP 435B or USD 6.4B USD 8.2B
ESTIMATED YTD FIT-OUT COST (including furniture, fixtures & technology)
IT-BPM PhP 488B or USD 9.2B
POGO PhP 70.2B or USD 1.3B
Component
Estimated Contribution to the PH Economy
IT-BPM Salaries
USD 6.4B
IT-BPM Office Rental
USD 1.2B
POGO Salaries
USD 8.2B
POGO Office Rental
USD 170M
POGO Housing Rental
USD 501M
ESTIMATED EMPLOYEE FOOTPRINT IT-BPM 1.3M
POGO 354K
ESTIMATED ANNUAL HOUSING RENTAL POGO PhP 26.6B or USD 501M
Estimated Total Contribution to the PH Economy
16.5B
ESTIMATED ANNUAL OFFICE RENTAL IT-BPM POGO PhP 64B or PhP 8.9B or USD 1.2B USD 170M
USD Conversion = $ 53
Source: Bureau of Immigration, IBPAP Organization
19
Real Estate Values
Land Values – Various Sectors as of 1Q 2019 Real Estate Values seen all-time highs across all sectors in 2019. We have seen the highest land value in Bonifacio Global City at PhP 1.3M per sqm and the highest condominium price at PhP 540K per sqm in Shang at The Fort. The Growing Tourist Market (7.1 Million Tourists in 2018) has led to record high prices in tourist hotspots nationwide. Industrial Land values hit highs due to scarcity of supply, especially in the Greater Metro Manila Area.
Luxury Village Properties continue to be a strong and steady investment option given the limited supply. Dasmarinas Village leads the way commanding up to 450,000 per sqm. Golf Shares also ride land values to all time high share prices. Luxury Condominiums also see record high prices, with the poshest condominiums priced at over half a million pesos per sqm.
Commercial
Residential
Tourism
Industrial
Business District
Values PhP/sqm
Luxury Village
Values PhP/sqm
Tourism Hotspot
Values PhP/sqm
Industrial District
Values PhP/sqm
Arca South
300K – 350K
Forbes Park
350K – 400K
El Nido
30K – 40K
Laguna
7K – 8K
Bay City
350K – 450K
Dasmarinas Village
350K – 450K
San Vicente
10K
Cavite
5K – 6K
BGC
480K – 1.5M
Urdaneta
320K
Siargao
10K – 25K
Batangas
6.5K – 7.5K
Davao
195K – 220K
Corinthian
190K
Mactan
12K
Pampanga
6K – 7K
Filinvest City
309K – 420K
Greenhills
250K
Cebu
6.5K – 7.5K
Makati City
400K – 1.2M
Green Meadows
300K
Golf Club
Share Value
Bulacan
6K – 7K
Ortigas
250K – 600K
Valle Verde
200K
Manila Golf
65M
Cagayan De Oro
4K – 5K
Clark
99K *simulated sale
Ayala Alabang
95K – 130K
Wack Wack
35M
Cebu
190K – 350K
Hillsborough
70K
Alabang Country Club
7M
Golf Club Shares
Condominiums Luxury Flat
Values PhP/sqm
Horizon Homes
540K
The Estates
533K
20 20
INDUSTRIAL
Logistics Market
Warehousing Requirements The rise of the E-Commerce industry in the Philippines is driving up the need for warehouse space of Online retailers Online retailers are the fastest growing in the logistics market in terms of warehouse expansion requirements demanding 226,000 Sq.M or 44% of 516,000 sqm.
Source: LPC Research, LPC Industrial Pipeline, Various News Articles
22
Logistics Market
Warehouse Demand arising from E-Commerce Every PhP 50B increment of E-commerce revenue generates 125,000 Sq.M of warehouse demand E-commerce alone will take up about 773,000 SqM of warehouse space by 2023 Warehousing requirements will be increasing on an annual growth rate (CAGR) of 34% YOY
E-Commerce warehouse take up is projected to annually grow by 34% till 2023
773 577 431
CAGR 2019 – 2023 34% 2015-2018 24%
321 240 134
89
110
70
2015
2016
2017
*Warehouse Space (SqM) in Thousands Source: CBRE Research, Google-Temasek
Legend:
2018
2019
2020
2021
2022
2023
Demand of warehouse space for E-Commerce per year
23
Logistics Market Warehouse Specifications
E-Commerce is changing how warehouses are typically designed; designs are becoming more sophisticated Due to higher specifications, warehouse construction costs are expected to increased by 43% but will translate to a 66% increase in average warehouse lease rates
Past Specifications
New Specifications
70% of lot area
Warehouse Footprint
70% of lot area
30% of lot area
Open Area
30% of lot area
4 Meters to 8 Meters
Ceiling Height (Clear Height)
8 Meters to 12 Meters
3,000 psi
Floor Loading
3,000 psi (8 – 10 meters) 4,000 psi (10 – 12 meters)
Drive in type of loading bay 3 bays per 5,000 sqm
Loading Bays
4 Meter depth with canopy 6 bays per 5,000 sqm
PhP 14,000 P/Sq.M
Average Construction Costs
PhP 20,000 P/Sq.M
1,000 to 5,000 sqm
Typical Warehouse Sizes
2,000 Sq.m to 10,000 Sq.m
BTS: 10 years RBF/SFB: 3 – 5 years
Typical Lease Terms
BTS: 10 years RBF/SFB: 3 – 5 years
PhP 120 – 150 p/sqm
Typical Lease Rate
PhP 220 – 250 p/Sq.M
Other New Specifications: Wet stand pipe, smoke detector and sprinkler system
3-phase electricity
Roll up doors
Small office/mezzanine office and CR facilities
High bay lights
Reinforced concrete flooring with rebars at 8 inches depth
RESIDENTIAL
The Chinese Impact
Coming of New Residential Market There is a surge in Mainland Chinese buyers in the residential condominium sector and we anticipate for this to continue for the long term especially with rekindled diplomatic ties between Philippines and China. Because of foreseen significant shift in buyers, residential sales will no longer be dominated by the OFWs
“1Q 2018: half of residential sales came from overseas buyers of which 50% are mainland China. If we don’t control them, it could reach up to 90%” – DMCI
President Isidro Consunji
Chinese investors accounted for 34% of sales compared to 10% in 2016
30% of 1Q residential sales are Chinese buyers up from 10% in 2017 and less than 5% in 2016
Source: Nikkei Asian Review. DOT, DOLE, Ayala Land Annual Report
26
Inventory Analysis
Project Performance by location in Metro Manila Mainland China buyers have preference for CBD districts, near schools & support commercial retail and near Chinese communities or locations where there are already existing Chinese (Usually takes up 20% to 45% of foreign buyers) Assuming with a constant aggregate take-up of 7,757 units, the remaining inventory will be depleted in 3 months
*Depletion of inventory = Unsold units / total monthly take-up **Average monthly take-up = Total monthly take-up / no. of current projects Source: LPC Research
27
Shang at The Fort is the Most Expensive Condominium Metro Manila price ranges are positioned at PhP 113K/sqm to PhP 540K/sqm
Shang at The Fort (Horizon Homes) has seen the most expensive condominium price at PhP 540K per sqm. Sustained demand amidst limited supply of condominiums in Makati enabled prices to an all-time high of PhP 533,000/sqm due to growing affluent market
Residential condominium buyers are mostly Investors rentals for BPO and POGO market and Professionals for End-use Mainland Chinese make up the largest share of foreign buyers for investment purposes Developers may start to have a focus group targeting Chinese market and look for Chinese developers as partners
28 Source: LPC Research
The Chinese Impact
Coming of New Residential Market Chinese buyers will continue to push property prices up. BAY AREA 2019
2009 164%
PhP 270k/sqm
PhP 102k/sqm Sea Residences
Current Price
Launch Price
SMDC
2019
2009 74%
Anchor Land 2018 Selling Price: PhP 285k/sqm % Sold: 75% Take-up: 192 units/month Turnover: 2024
PhP 228k/sqm
PhP 131k/sqm Solemare Park Suites
Copeton Baysuites
Current Price
Launch Price
Anchor Land
2019
2009
Gentry Manor
200%
PhP 91k/sqm Bay Garden Club Federal Land
Launch Price
Megaworld
PhP 273k/sqm Current Price
2018 Selling Price: PhP 322k/sqm % Sold: 75% Take-up: 35 units/month Turnover: 2024
29
The Chinese Impact
Coming of New Residential Market Strong demand has led to tenants dictating record high prices for rental units. Rental rates have seen an increase of up to 80% of rates from 3 years ago BAY GROWTH IN RENTAL RATES in Bay area 1BR units have gone from Php25,000 back in 2015 to Php45,000 while a 2BR unit’s price rose from Php55,000 to Php85,000 High Rental rates - Bay: P1.2k to P1.6k per sqm per month Alabang: P1k to P1.6k per sqm per month Tenants are maximizing the area of the unit by fitting 4 people in 1BR units, and 8 people in 2BR units Lease terms - Prefer to pay in cash for 1 year advance and 6 months deposit
The Chinese Impact
Coming of New Residential Market High rental growth rates in Bay and Alabang are driven by Chinese workers from offshore gaming customers and mainland Chinese who frequent brick and mortar casinos compared to Non-POGO tenants in Makati and BGC A total of 57 POGO licenses were issued from 2016 to 2019
31 Source: LPC Research (based on a 1BR unit), price excl. of VAT
TOURISM
Asia Pacific International Tourist Arrivals FY 2017 vs. FY 2018
The World Tourism Organization’s (UNWTO) Global Tourist Arrivals for 2020 was unexpectedly achieved in 2018, with 1.4 billion arrivals. Philippine tourist arrivals grew by 7% from 6.6 million in 2017 to 7.1 million in 2018. China continues to be the driver for tourism in Asia as seen in Hong Kong with 14% growth, 15% in South Korea and the 30% growth in the Philippines. Countries which enforced simpler visa requirements attracted more visitors as evident in Japan, Vietnam and Myanmar which grew by at least 9% to as much as 22% in tourist arrivals.
Exponential Chinese Tourist Influx Top 10 Tourist Market in the Philippines
In 2018 the Philippines grew by a notable 7.6%, surpassing the global average of tourist arrivals The top 3 source markets of Philippine Tourism are: South Korea, China, and USA. South Korea remained the top source market with 1.6 million arrivals despite its -1.2% decrease in 2018. However, China continues to be the fastest growing market with 34% increase.
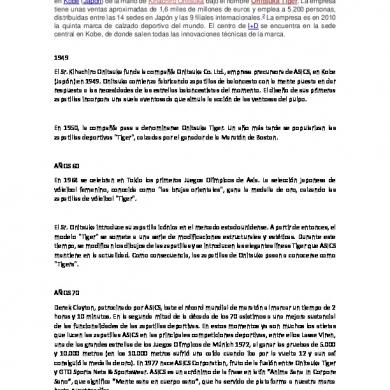
Mobile Payments boosts Chinese Tourists’ spending Chinese Tourists exhibiting stronger purchasing power
In 2017, Mainland Chinese tourist became the biggest spenders and contributed the most to Global Tourism Revenue with USD 258B which is almost twice as much as US-tourist spending of USD 135B.
Chinese tourists are now using mobile payments such as WeChat Pay and Alipay all over the world; 93% of Chinese tourists would increase their spending if mobile payments are made available. About 1,000 establishments in the Philippines are starting to accept payment via Chinese mobile payment applications. Being open to more mobile payments will encourage the Mainland Chinese tourists to spend more than an average of USD 1K per day.
RUSSIA
EUROPE $3,754 USA $4,462
GERMANY FRANCE
S.KOREA $3,007
AUSTRIA SWITZERLAND
HK $2,847
UNITED ARAB ERIMATES
MACAU $2,335 THAILAND $2,026
WECHAT PAY AND ALIPAY WECHAT PAY ONLY
Source: Nielsen Global, WeChat Pay, Alipay (TechinAsia), AUB-Vice President Maria Magdalena Surtida
JAPAN $2,952
TAIWAN $2,027 PHILIPPINES $1,154
SINGAPORE $2,971 AUSTRALIA $3,541
Our Insights. Your Success.
Real Estate Options
DISCLAIMER: 1. This Leasing Material has been prepared in good faith and with due care by LPC solely for the information of potential lessees to assist them in deciding whether they are interested in the premises offered for lease. 2. The information does not form part of any offer or contract and is intended as a guide only 3. You should not rely on any material contained in this Leasing Material but should make independent investigations to satisfy yourselves as to the correctness and relevance of any statements or representations, and consult with legal, financial and tax advisers where appropriate. 4. All calculations including, but not limited to dimensions, area and rent, contained in the Leasing Material are based on figures provided to the client by outside sources and have not been independently verified by LPC and therefore may not be correct, complete, or relevant 5. No representation or warranty is made by LPC as to the accuracy or completeness of the Leasing Material, in whole or in part. No liability for negligence or otherwise is assumed by LPC or the lessor of this property for any information contained in the Leasing Material 6. All Dollar ($) amounts quoted, if any, do not include any goods and services tax, value added tax, consumption tax or similar tax unless specifically stated in writing 7. Except as expressly indicated herein, LPC does not undertake any obligation to advise you of any changes or updates with respect to the information contained herein
Related Documents

Ph Real Estate Market
February 2021 1
Real Estate Investments
January 2021 1
Real Estate Marketing
January 2021 1
Real Estate Course
February 2021 0
Real Estate Investing Report
February 2021 2
Real Estate Management System
January 2021 1More Documents from "invensys87"
Ph Real Estate Market
February 2021 1
Cerezo Rosa - Acoustic Bass
January 2021 1

El Metodo Zugzwang 2
January 2021 1
Universidad Peruana De Ciencias Aplicadas
February 2021 1